
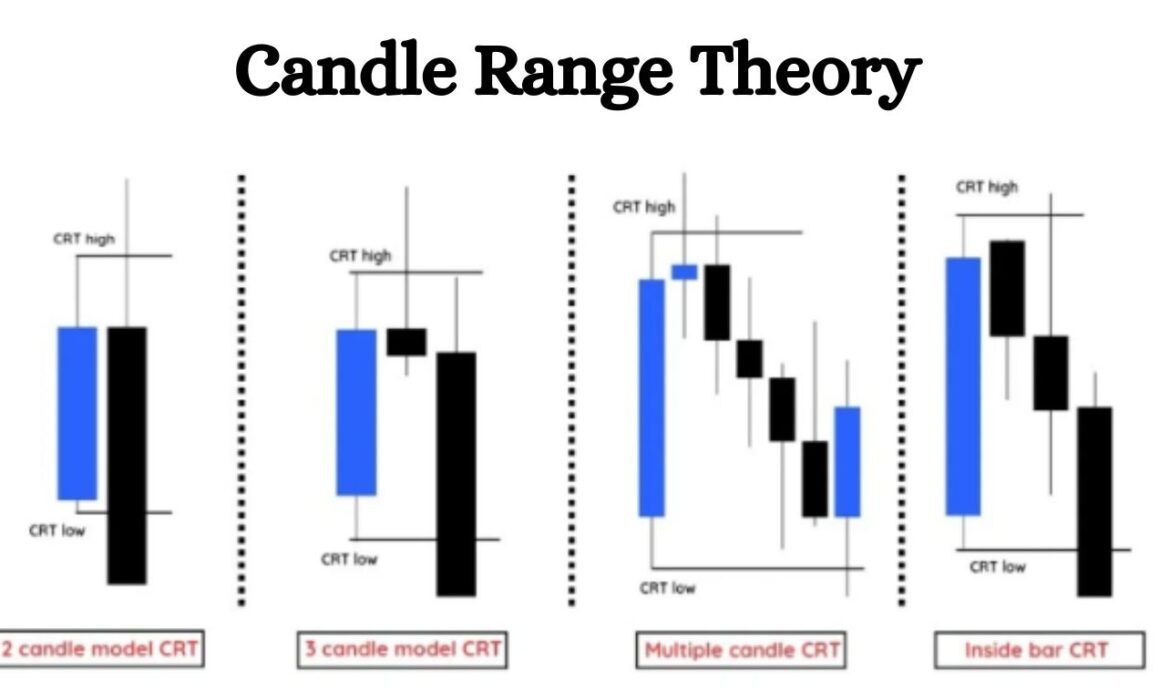
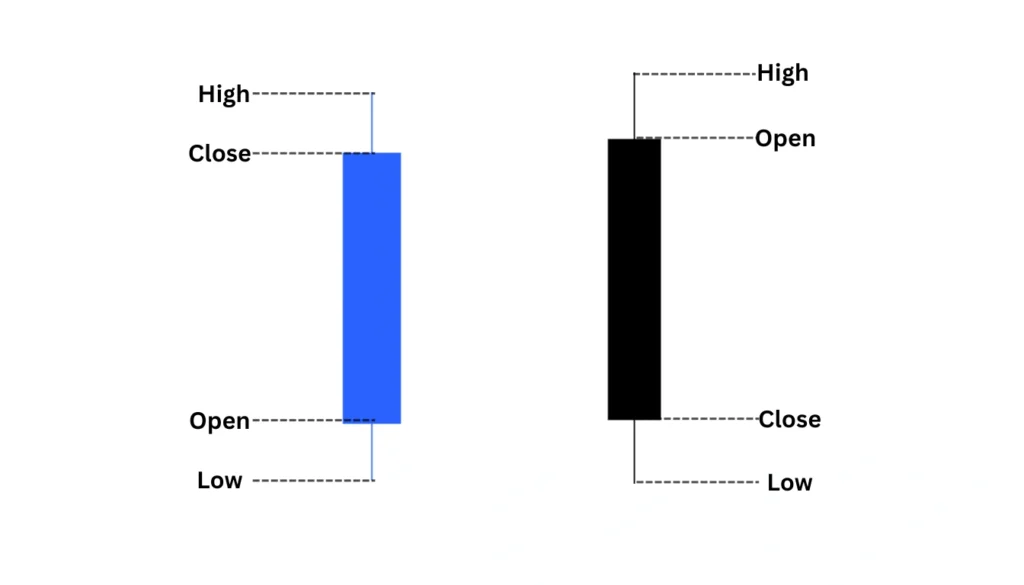
What Is a Candle?
Imagine you’re watching a race. A candlestick is like a picture that shows you where the race started, where it went highest, where it went lowest, and where it finished. In trading, we call this a candle. Each candle tells a story about price movement during a specific time period.
Think of it like a thermometer. The top shows the hottest temperature (highest price), the bottom shows the coldest (lowest price), and the colored box in the middle shows where things started and ended. Green candles mean prices went up, like a happy day. Red candles mean prices went down, like a sad day.
Traders look at these candles every single day. They help us understand what happened with the price. Did it go up fast? Did it go down slowly? Did it jump around a lot? The candle shows everything in one simple picture.
What Is a Candle Range?
A candle range is the distance between the highest and lowest point of a candle. Think of it like measuring how tall a jump was. If you jump from the ground to a table, the range is from the ground to the tabletop.
In candle range theory, we look at one special candle and measure from its bottom to its top. This creates an invisible box around that candle. This box becomes very important because price often respects this box later.
The candle range is like drawing a boundary. Imagine drawing two lines on a wall—one at the top of your jump and one at the bottom. Everything between those lines is your range. In trading, everything between the high and low of that candle is the candle range.
This simple measurement helps traders predict where price might go next. It’s like knowing the size of a swimming pool before you dive in.
Why Candle Range Theory Matters
Candle range theory helps us understand where price might move next. It’s like having a map before going on a treasure hunt. Without the map, you’re just guessing. With the map, you know where to look.
When big traders (smart money) want to move the price, they often use candle ranges as their playground. They push price up to the top of the range, then push it down to the bottom, collecting money from confused traders. Understanding candle range theory helps you see what they’re doing.
This candle range theory matters because it shows us hidden patterns. Price doesn’t move randomly. It follows certain rules, and the candle range is one of those rules. When you know the range, you can predict breakouts, reversals, and strong moves.
Many professional traders use candle range theory every single day. It works in forex strategy, stocks, and crypto. Once you understand it, trading becomes less scary and more logical.

How Candle Range Theory Works (Easy Explanation)
Let me tell you a story. Imagine a rubber band stretched between your two hands. The more you stretch it, the more energy it stores. When you let go, it snaps back fast. Candle range theory works exactly like this.
When price moves inside a candle range, it’s like the rubber band being stretched. Energy builds up. Traders are watching, waiting, wondering which way it will snap. The longer price stays inside the range, the more energy accumulates.
Then suddenly, price breaks out of the range—either up or down. This is when the rubber band snaps. The price moves fast and strong because all that stored energy releases at once. Smart traders know this is coming and prepare for it.
The whole idea behind candle range theory is simple: ranges create energy, and breakouts release that energy. By identifying the range early, you can catch the big move when it happens.
The Simple Rule Behind CRT
Here’s the golden rule that makes everything click: If the price stays inside the candle range, it is gathering energy. When it breaks out, it moves fast.
This one rule explains most of what happens in trading. Think of it like water building up behind a dam. The longer the water stays trapped, the bigger the pressure. When the dam breaks, water rushes out powerfully.
Price behavior follows this same pattern. When candles keep forming inside the range without breaking it, pressure builds. Traders start taking positions. Orders stack up. Everyone waits for the breakout.
When the breakout finally happens, all those waiting orders trigger at once. This creates momentum. The price doesn’t just break out slowly—it explodes out of the range with speed and strength.
Remember this rule every time you trade. If you see price consolidating inside a candle range, get ready. Something big is about to happen.
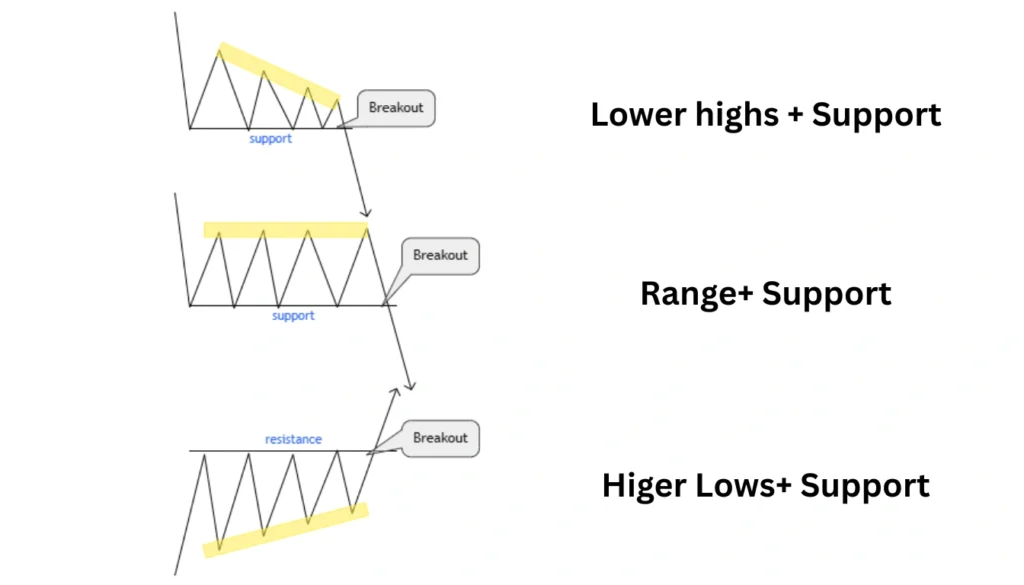
The 3 Types of Candle Range Theory Moves
Strong Breakout
A strong breakout is like a rocket launching into space. Price breaks the candle range and keeps going without looking back. The candle that breaks out is big and powerful, showing everyone that serious traders are involved.
You know it’s a strong breakout when the volume increases, the candle closes far beyond the range, and price doesn’t return to test the range immediately. This is the breakout everyone dreams of catching because it leads to big profits.
Strong breakouts usually happen when smart money is moving large amounts. They push the price through the range with force, and smaller traders jump in, adding more fuel to the fire.
Weak Breakout
A weak breakout is like trying to jump over a fence but barely making it. Price breaks the candle range but doesn’t go far. It struggles, moves slowly, and looks tired.
These breakouts happen when there’s not enough buying or selling power behind the move. Maybe only small traders are participating. Maybe the big players aren’t interested. The result is a breakout that fails to deliver.
Weak breakouts are dangerous because they often reverse quickly. Price might break the range, trick some traders, then return inside the range and go the opposite direction.
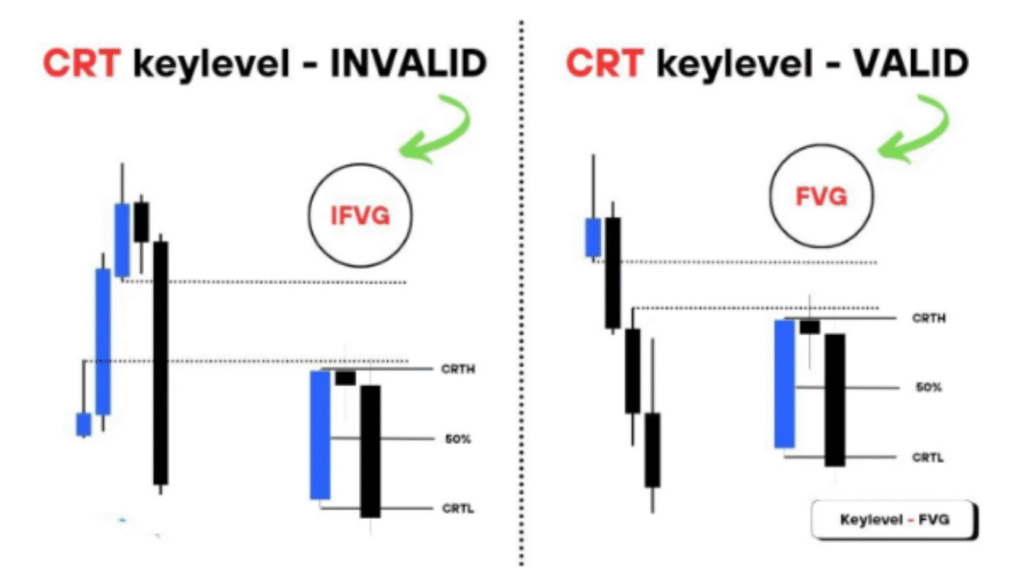
Fake Breakout
A fake breakout is like a magic trick—it looks real but it’s just an illusion. Price breaks the candle range to fool traders, then quickly reverses and goes the other way.
Smart money often creates fake breakouts on purpose. They push price above the range, trigger everyone’s buy orders, then sell heavily, pushing price back down. This manipulation concept catches many beginners.
The best way to avoid fake breakouts is to wait for candle close confirmation. Never enter a trade just because price touched outside the range. Wait until the candle actually closes beyond the range.
How to Mark a CRT Candle (Step-by-Step Guide)
Marking a candle range is super easy. First, open your trading chart and pick your timeframe. Most traders use M15 or M30 for finding CRT candles.
Look for a candle that stands out. This is usually a candle at the beginning of a trading session, like the London or New York open. This candle should be bigger than the ones around it.
Once you find your special candle, draw a horizontal line at its highest point (the top of the wick). Then draw another horizontal line at its lowest point (the bottom of the wick). These two lines create your range box.
Some traders like to shade the area between the lines to make it more visible. You can use any drawing tool on your platform—rectangle boxes work great for this purpose.
Now watch what happens. Price will move around, but that range box stays there. You’re waiting to see when price breaks out of this box with a strong candle close.
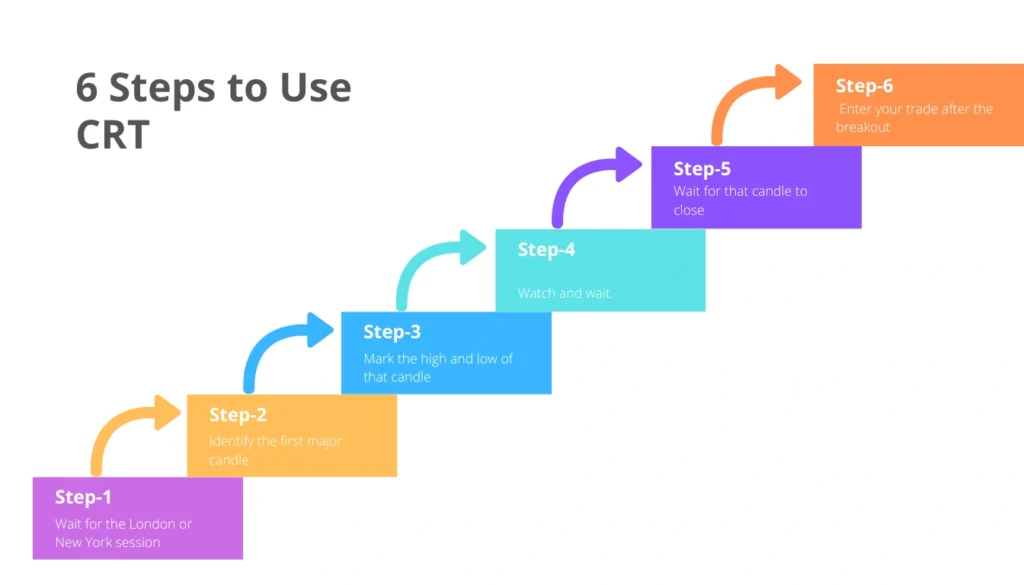
How to Use CRT in Real Trading (Easy 6 Steps)
Step 1: Wait for the London or New York session to open. These are the best sessions for candle range trading.
Step 2: Identify the first major candle that forms. This is usually within the first 15-30 minutes of the session opening.
Step 3: Mark the high and low of that candle to create your range box. Use the indicator drawing tools on your chart.
Step 4: Watch and wait. Don’t trade yet. Let price play inside the range. Be patient like a cat watching a mouse.
Step 5: When price breaks the range with a strong candle, wait for that candle to close. This is your candle range confirmation signal.
Step 6: Enter your trade after the breakout candle closes. Put your stop-loss just inside the range and aim for a target that’s at least twice the range size.
Following these six steps removes emotion from trading. You have clear entry and exit rules. No guessing, no panic, just systematic trading based on candle range analysis.
Simple Example Trade Using Candle Range Theory
Let’s walk through a buy trade together. Imagine the London session opens, and the first M30 candle forms with a high at 1.2500 and a low at 1.2450. You draw your range box between these levels.
For the next hour, price bounces inside this box—up and down, up and down. You do nothing. You just watch. Then suddenly, a strong green candle breaks above 1.2500 and closes at 1.2520.
This is your signal. You enter a buy trade at 1.2520. Your stop-loss goes at 1.2445 (just below the range). Your target is 1.2570 (50 pips up, matching the range size). The trade moves in your favor, and you win.
Now for a sell trade example. The New York session opens with a candle ranging from 1.2600 to 1.2550. Price consolidates inside this intraday candle range setup for some time.
Then a strong red candle breaks below 1.2550 and closes at 1.2530. You enter a sell trade at 1.2530, place your stop at 1.2605 (above the range), and target 1.2480 (50 pips down). Price drops, and you collect profits.
Both examples show the same pattern: identify range, wait for breakout, confirm with candle close, enter trade with proper risk management.
Candle Range Theory in Different Sessions (London, NY, Asian)
The London session is the best time for candle range breakout trading. Why? Because London brings the most volume and liquidity. When European traders wake up and start trading, price moves with real power.
The first candle range strategy after London opens often gives the cleanest setups. The breakouts are genuine because big banks and institutions are actively trading. Fake breakouts happen less frequently during London hours.
The New York session is also excellent, especially the first hour when it overlaps with London. This creates maximum volume and strong directional moves. Daily candle range strategy works beautifully during NY open.
The Asian session is trickier. Volume is lower, ranges are smaller, and movements are often choppy. While candle range theory can work during Asian hours, the breakouts tend to be weaker and more prone to reversals.
For beginners, stick to London and New York sessions. Master candle range theory during high-volume times first. Once you’re consistently profitable, you can experiment with other sessions.
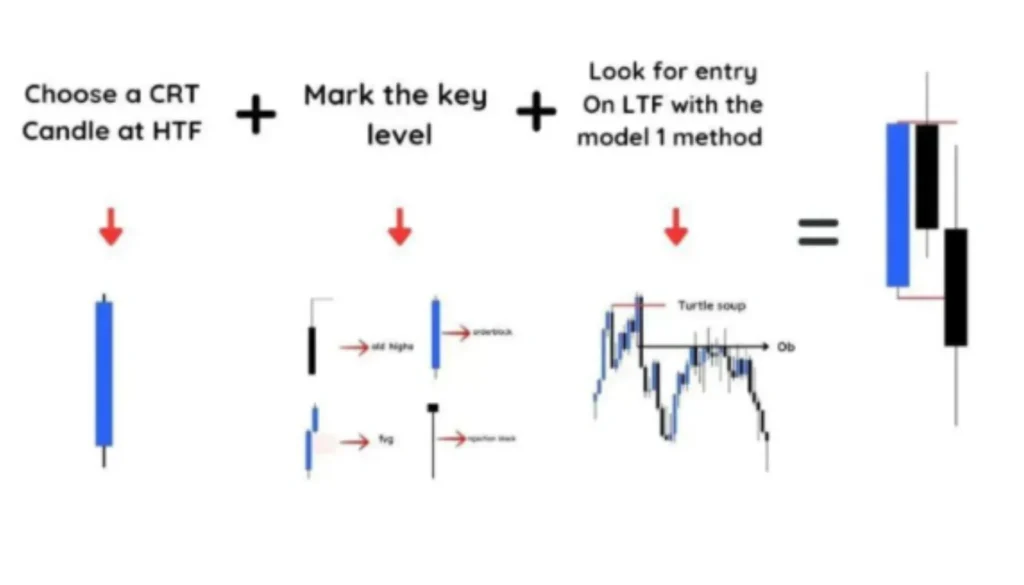
Combining CRT with ICT’s PO3 (Very Simple Version)
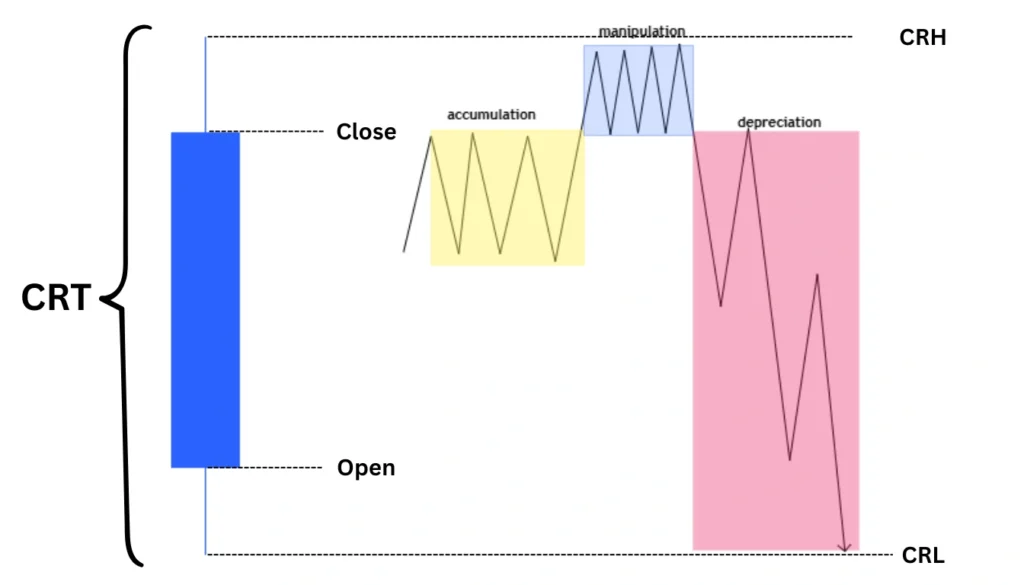
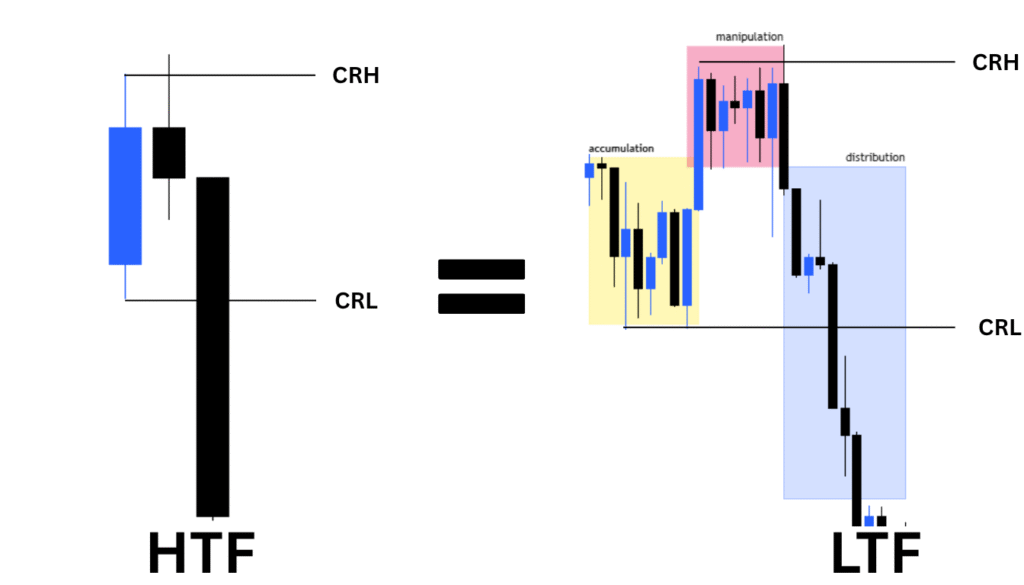
ICT’s PO3 stands for Power of Three: Accumulation, Manipulation, and Distribution. Think of it like a three-act play where smart money follows the same script every time.
Accumulation is when smart money quietly collects positions inside the candle range. They’re building their army, getting ready for battle. Price moves sideways, looking boring.
Manipulation is when they create a fake move to trap regular traders. They might push price above the range to trigger buy orders, then reverse it. This is the candle range manipulation concept at work.
Distribution is when they release their positions in the direction they really want price to go. After trapping traders with manipulation, they push price hard in the true direction, making big profits.
Candle range theory fits perfectly inside this PO3 framework. The range represents accumulation. The first breakout attempt is often manipulation. The second strong move is distribution.
By combining Candle Range Theory with market structure candle range understanding and PO3, you see the complete picture of what smart money is doing.
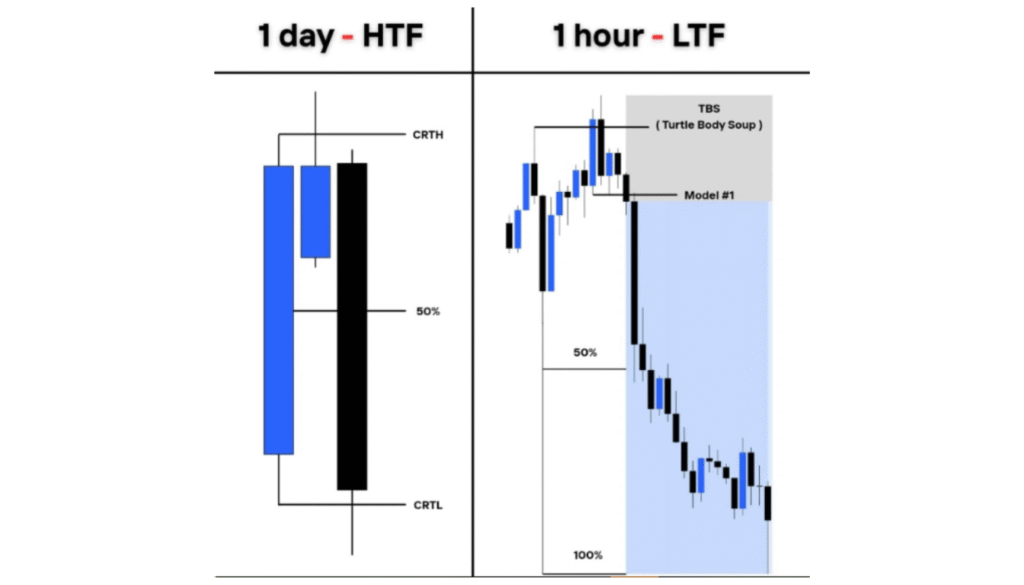
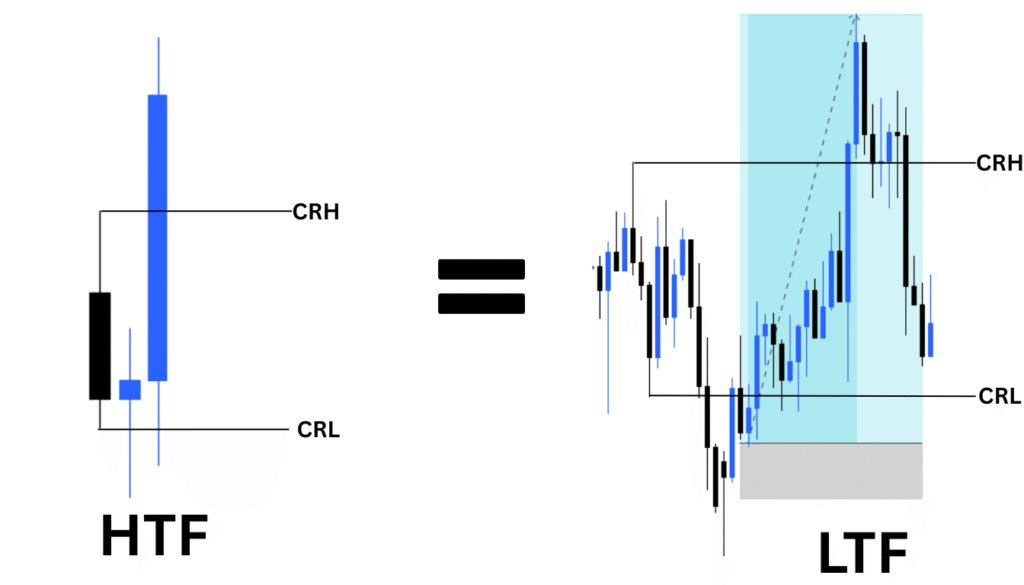
Multi-Timeframe Candle Range Theory (Made Super Easy)
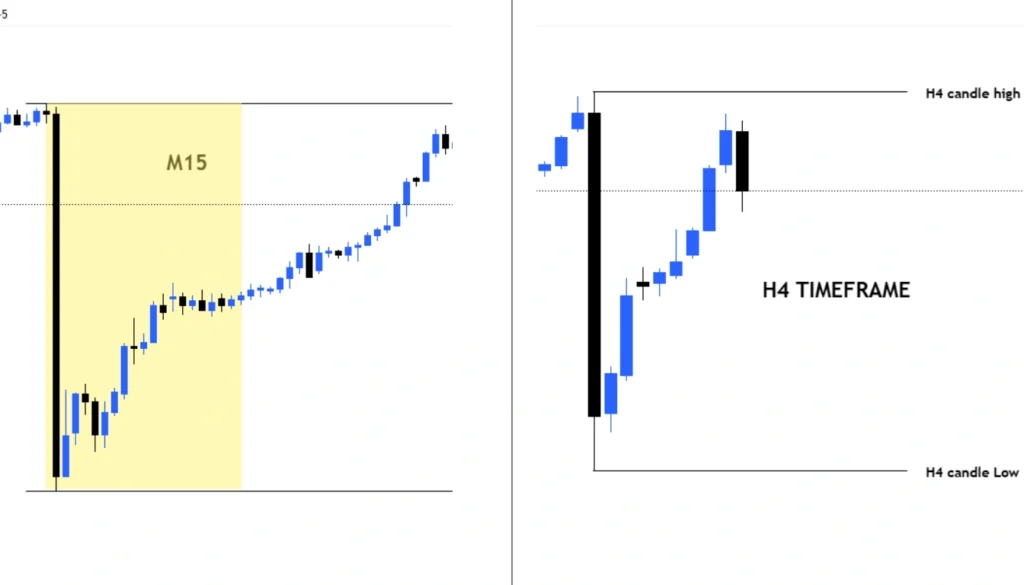
Using multi-timeframe candle range is like using binoculars and a magnifying glass together. The binoculars (higher timeframe) show you the big picture. The magnifying glass (lower timeframe) shows you the exact entry point.
Start by opening the H1 or H4 chart. Look for the main candle range on this higher timeframe. This tells you the overall direction. If price is pushing toward the top of the H4 range, you’re looking for buy opportunities.
Now switch to M15 or M5. Find smaller candle ranges that form in the direction of the bigger range breakout. These smaller ranges give you precise entry points with tight stop-losses.
For example, if the H4 candle range breaks upward, you wait for M15 to form a small range. When M15 breaks that small range to the upside, you enter. This gives you high probability trades with excellent risk-to-reward.
The key is alignment. The HTF Candle Range Theory shows direction, the LTF CRT shows timing. Never trade against the higher timeframe range direction.
Best Timeframes for Candle Range Theory
For finding direction and marking your main candle range, use M15 or M30. These timeframes show clear candle structures without too much noise. The ranges are meaningful and breakouts are reliable.
The M15 timeframe is perfect for beginners learning candle range theory trading. It’s not too fast and not too slow. You have time to think and react without missing opportunities.
For precise entries, drop down to M1 or M5. Once you know direction from M15, use M5 to find the exact moment to enter. This combination gives you the best of both worlds.
Some advanced traders use H1 for direction and M15 for entries. This works well for swing trading or if you can’t watch charts constantly. The H1 candle range breakout zones are powerful and give bigger profit targets.
Avoid using very high timeframes like H4 or D1 for CRT unless you’re a very experienced trader with large capital. The ranges are huge, requiring big stop-losses that beginners can’t afford.
Start with M15 for direction and M5 for entry. Practice with this combination until you’re consistently profitable, then experiment with other timeframe combinations.
Where to Use CRT and Where NOT to Use It
Use candle range theory during trending markets when price shows clear direction. The best time is during session opens—London and New York—when volume is high and institutions are active.
Use Candle Range Theory when you see clean candle structures with respect for previous ranges. If price consistently reacts to old range levels, it’s a good environment for candle range trading strategy.
Use Candle Range Theory after news releases have settled and price establishes a new range. Wait about 30 minutes after major news, then look for the new CRT candle to form.
Do NOT use CRT during ranging markets where price is trapped between strong support and resistance with no clear direction. In these conditions, breakouts fail constantly, leading to candle range reversal signals that lose money.
Do NOT use CRT during major news releases. Price spikes violently in both directions, creating false breakout zones that have nothing to do with real market structure.
Do NOT use Candle Range Theory during very low volume times like late Friday or holidays. Without volume, ranges are meaningless and breakouts lack follow-through.
Do NOT use Candle Range Theory when multiple ranges overlap and conflict with each other. Confusion leads to bad decisions. Wait for clarity.
Common Mistakes Traders Make with Candle Range Theory
The biggest mistake is entering too early—before the breakout candle closes. Beginners see price touching the range boundary and jump in immediately, only to watch it reverse. Always wait for candle close confirmation.
Another common error is using ranges from random candles instead of significant session candles. Not every candle matters. Focus on the first candle of major sessions or candles that form at important price levels.
Many traders ignore candle range volume analysis. A breakout without volume increase is likely fake. Always check if volume supports the breakout before entering.
Some beginners chase breakouts after they’ve already moved far from the range. If the breakout candle is already 2-3 times the range size, you’re too late. The risk-to-reward becomes terrible.
Traders often forget about risk management for CRT. They risk too much per trade or don’t use stop-losses properly. Every CRT trade should have a fixed stop-loss just inside the range.
Another mistake is using CRT without considering overall market structure. A range breakout against the daily trend will struggle. Always trade with the higher timeframe direction.
Finally, many traders give up too quickly. Candle range theory requires practice. You’ll make mistakes at first. This is normal. Keep a trading journal, learn from losses, and gradually improve.
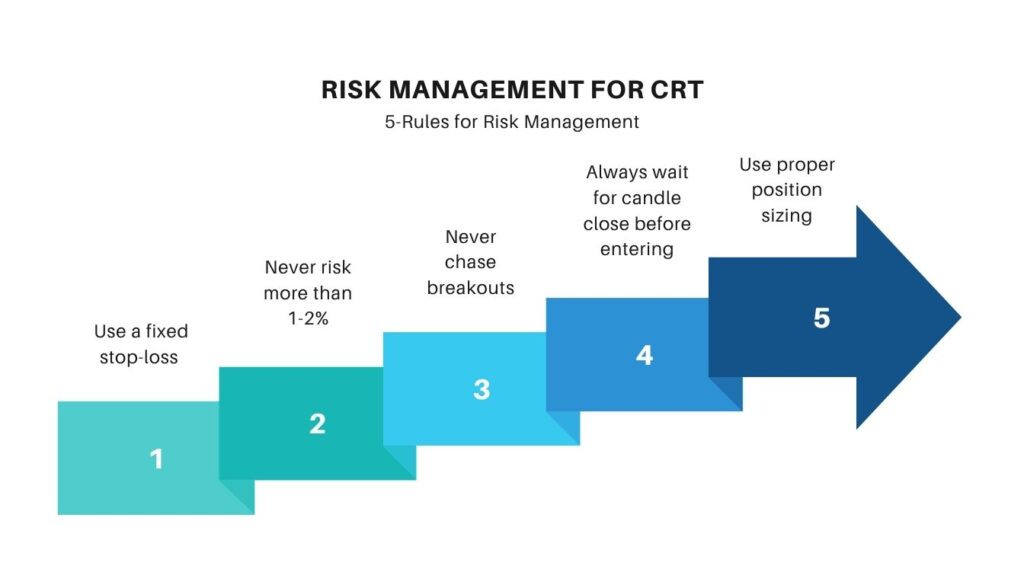
Risk Management for CRT
Always use a fixed stop-loss for every CRT trade. Place it just inside the candle range—about 5-10 pips inside the opposite boundary. This protects you if the breakout fails.
Never risk more than 1-2% of your account on a single Candle Range Theory trade. Even the best setups can fail. Proper position sizing keeps you in the game long-term.
Never chase breakouts after they’ve moved significantly. If you miss the entry near the breakout point, let it go. There will be another trade. Chasing leads to poor risk-to-reward ratios and emotional trading.
Always wait for candle close before entering. This single rule eliminates most fake breakouts. Price might spike outside the range temporarily, but if the candle closes back inside, there’s no valid breakout.
Use proper position sizing based on your stop-loss distance. If the range is 50 pips and you’re risking $100, calculate your lot size accordingly. Never use fixed lot sizes regardless of range size.
Set realistic targets—usually 1.5 to 2 times the range size. Don’t be greedy. Collect consistent wins and move on to the next trade.
Consider using trailing stops once price moves in your favor. This locks in profits while giving the trade room to continue.
CRT vs ICT Opening Range
Both CRT and ICT opening range look at the beginning of sessions, but they have important differences. Understanding these differences prevents confusion.
ICT opening range focuses specifically on the first few minutes of major session opens—especially the first M1 or M5 candle. It’s very precise timing-based. Traders mark this exact opening range and wait for manipulation and distribution.
Candle range theory is more flexible. Candle Range Theory can use opening candles, but it also works with any significant candle throughout the session. You might mark a CRT candle at 3 PM if conditions are right.
ICT opening range typically uses much smaller timeframes (M1, M5) for the initial range. Candle Range Theory traders often prefer M15 or M30 for their main range candles.
Both concepts share the idea that ranges create trading opportunities through breakouts. Both involve watching for manipulation before true directional moves.
The main difference is flexibility. ICT opening range is strict about timing. Candle Range Theory gives you more freedom to choose which candles to mark based on price action and market conditions.
Many professional traders use both. They mark the ICT opening range at session opens, then also mark CRT candles throughout the session when significant candle structures form.
CRT vs Normal Candle Patterns
Normal candle patterns like doji, hammer, or engulfing patterns show you what one or two candles look like. They give hints about possible reversals or continuations.
Candle range theory is more powerful because it creates a framework—a range box—that price respects over multiple candles. Instead of just looking at one candle’s shape, you’re watching how price behaves around a defined zone.
Candle patterns alone are weaker because they don’t give you clear entry and exit rules. A hammer candle might mean reversal, but where do you enter? Where’s your stop-loss? How far should you target?
Candle Range Theory gives you everything: the range boundaries define your stop-loss, the breakout point defines your entry, and the range size helps you calculate your target. It’s a complete trading system.
Another advantage of CRT is that it works with market structure and liquidity concepts. Smart money respects ranges. They manipulate ranges. Candle patterns don’t account for this manipulation.
That said, you can combine both approaches. If you see a strong candle pattern forming at a CRT range boundary, it adds confirmation to your trade. The pattern plus the range creates high-probability setups.
Think of candle patterns as individual puzzle pieces. Candle range theory is the picture on the box that shows you how all the pieces fit together.
FAQs (Simple, Child-Level Answers)
Why does Candle Range Theory work?
Candle Range Theory works because big traders use ranges to accumulate positions and trap smaller traders. When they’re ready to move price, they break the range with force. By following the range, you’re following where the smart money is going.
Do I need indicators?
No! Candle range theory doesn’t need any fancy indicators. You only need price action—the candles themselves. Just draw lines at the high and low of your chosen candle. That’s it. Keep it simple.
What is the best session for Candle Range Theory?
The London session is best, followed by New York. These sessions have high volume and strong liquidity. The Asian session works too, but breakouts are weaker. Start with London and NY until you master the basics.
How long does a candle range stay valid?
Usually until the end of that trading session or until a strong breakout occurs. Some ranges stay relevant for several hours. If price respects the range, keep watching it. If price breaks and completely forgets about the range, mark a new one.
Can CRT work with stocks and crypto?
Yes! Candle range theory works on any market—forex, stocks, crypto, commodities. The concepts are universal because they’re based on how price moves and how traders behave, which is the same everywhere.
What if the breakout fails?
If the breakout fails and price returns inside the range, close your trade with a small loss. Don’t hope it comes back. Failed breakouts often lead to strong moves in the opposite direction. Accept the loss and look for the next opportunity.
How many Candle Range Theory trades should I take per day?
Quality over quantity. One or two good Candle Range Theory trades per day is perfect. Wait for the best setups during session opens. Don’t force trades just to be busy. Patience pays in trading.
Final Thoughts
Candle range theory is one of the simplest yet most powerful concepts in trading. By understanding how price respects ranges and how breakouts work, you gain a real edge in the markets.
The beauty of Candle Range Theory is its simplicity—no complex indicators, no confusing calculations, just pure price action based on candle structures.

Start by practicing on demo accounts, mark your ranges during London and New York sessions, wait patiently for confirmed breakouts, and always use proper risk management.
With time and practice, candle range theory can transform your trading from guessing to systematic profitability. Remember, every expert trader was once a beginner who refused to give up. Your journey with CRT starts today!
[…] for a confirmation candle to close in your […]
Nice content
Thanks for you feedback