

Build Profitable AI Trading Strategies— Guide for Beginners
Introduction to AI Trading
Trading used to be something only big banks and expert investors could do well. But today, things have changed. AI is now helping everyday people trade smarter.
What AI means in trading AI in trading means using computer programs that can think, learn, and make decisions. These programs study market data and find patterns that humans might miss.
Why AI is changing the way people trade AI trading strategies work faster than any human. They can read thousands of charts in seconds. This speed gives traders a big advantage.
How AI helps traders make faster decisions Instead of waiting and guessing, AI systems give signals right away. They react to market changes in real time. This helps traders avoid missing good opportunities.
Why more beginners are using AI tools today AI tools are now simpler and cheaper than before. Many platforms require zero coding. Even a beginner can set up an automated trading system today with just a few clicks.
What Makes a Trading Strategy High-Performing?
Not every strategy makes money. A high-performing strategy does more than just win sometimes.
Understanding performance in trading Performance means how well your strategy works over time — not just once or twice.
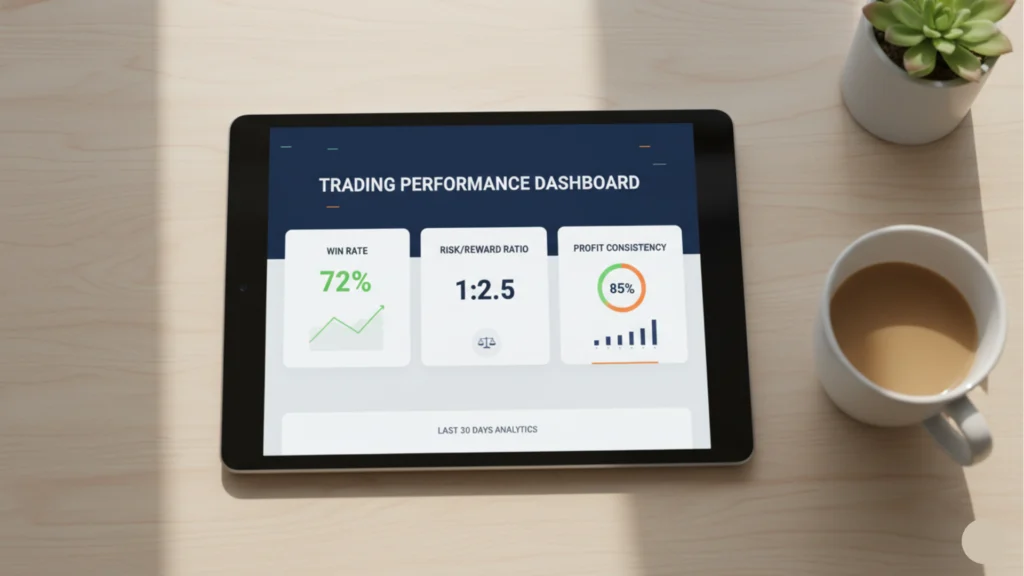
Win rate vs profit consistency A strategy with 60% wins but tiny profits is not great. You want consistent profits. Even a 45% win rate can be profitable with the right risk-to-reward ratio.
Risk-to-reward ratio explained simply If you risk $10 to make $30, your ratio is 1:3. That is good. AI-powered trading models help you find trades with better ratios.
Why high returns alone are not enough Big returns with huge risks are dangerous. A smart AI trading strategy balances both returns and safety.
What Is Artificial Intelligence in Trading?
Simple meaning of AI in financial markets AI in financial markets means using smart software to study prices, volumes, and news. It then makes predictions about what might happen next.
How AI learns from market data AI uses past data to find patterns. This is called machine learning for stock trading. The more data it studies, the smarter it gets.
Difference between AI trading and manual trading Manual trading depends on human judgment. AI trading depends on data and logic. AI does not get tired, emotional, or distracted.
Common examples of AI in trading platforms Many brokers now offer AI trading signals. Tools like QuantConnect and MetaTrader 5 use intelligent trading algorithms to help users automate strategies.
Why Traders Use AI to Build Strategies
Faster market analysis Real-time AI trading analysis can process news, price movements, and indicators in milliseconds. A human cannot match that speed.
Emotion-free decision making Fear and greed ruin many trades. AI does not feel emotions. It just follows the rules you set.
Automation of trade execution Once your strategy is ready, the system trades for you automatically. This is the core benefit of automated trading with artificial intelligence.
Better pattern recognition AI finds patterns in charts and price action that the human eye easily misses. This is why AI-enhanced technical analysis is so powerful.
Handling large amounts of market data Markets produce millions of data points daily. AI tools for trading process all of it quickly and efficiently.

Core Components of an AI Trading System
Every successful AI trading system has five key parts.
- Data collection system — gathers market prices, news, and indicators
- AI model or prediction engine — the brain that finds patterns
- Backtesting system — tests the strategy on old data
- Trade execution system — places buy and sell orders
- Risk management system — protects your capital
All five parts must work together for the strategy to succeed.
Data: The Fuel That Powers AI Trading
Why data is important for AI Without data, AI cannot learn anything. Data is like food for your AI model.
Historical market data This is old price and volume data. It helps train your model on past market behavior.
Real-time market data This is live data. Your AI uses it to make decisions right now.
News and sentiment data AI can read news headlines and social media. This is called sentiment analysis. It helps predict sudden market moves.
Alternative data sources Things like satellite images, credit card transactions, and web traffic are used by advanced AI trading systems to find hidden market clues.

How to Collect Trading Data for AI Models
Free sources for market data Yahoo Finance, Alpha Vantage, and Quandl offer free historical data. These are great starting points for beginners.
Paid market data providers Bloomberg and Refinitiv offer high-quality data. These are better for professional AI trading software users.
Broker APIs Many brokers like Interactive Brokers or Alpaca provide APIs. You can pull live data directly into your model.
Web scraping for financial insights You can collect news and social media data using Python scraping tools. This helps build better predictive trading models with AI.
Cleaning and preparing data for AI Raw data often has errors. You must clean it before using it. This step is called data preprocessing and it is very important.
Choosing the Right Market for AI Trading
- Stocks — good for long-term AI strategies, lots of data available
- Forex — fast-moving, great for AI forex trading strategies
- Crypto — volatile but full of opportunities for AI crypto trading strategy
- ETFs — lower risk, good for portfolio trading
- Futures — advanced, better for experienced users
Which market is best for beginners? Stocks or crypto are easiest to start with. There is tons of free data and many beginner-friendly tools available.
Choosing the Right AI Model for Trading
Machine learning models These include Random Forest, XGBoost, and Linear Regression. They are great for quantitative trading with machine learning.
Deep learning models Neural networks can process complex data. They are used in deep learning for trading strategies.
Natural language processing NLP reads news and social media to predict market sentiment. It is great for AI-based stock market prediction.
Reinforcement learning This model learns by trying actions and getting rewards. It is used in advanced AI trading bot development.
Which model suits which strategy? Short-term trades work well with deep learning. Long-term strategies work well with simpler machine learning models.
How AI Finds Hidden Market Patterns
- Trend detection — finds uptrends and downtrends automatically
- Price action recognition — reads candlestick patterns like a pro
- Volume analysis — checks if moves are backed by real buying
- Correlation between assets — finds links between stocks, forex, and crypto
- Predicting market sentiment — reads mood of the market from news and social data
This is how AI-driven market analysis gives traders an edge.
Step-by-Step Guide to Building High-Performing Trading Strategies with AI
Step 1: Learn Basic Trading Concepts
Before touching any AI tool, learn the basics.
- Understanding charts — learn how to read candlestick and bar charts
- Technical indicators — study RSI, MACD, Moving Averages
- Risk basics — understand stop-loss and position sizing

Step 2: Pick a Trading Goal
Your goal shapes your entire strategy.
- Scalping — tiny profits, very fast trades
- Day trading — open and close within one day
- Swing trading — hold for days or weeks
- Long-term strategy — hold for months
Pick one and focus on it fully.
Step 3: Gather Quality Data
- Historical prices from free sources
- Add technical indicators like RSI and Bollinger Bands
- Include news sentiment data for better accuracy
Step 4: Train Your AI Model
- Feed your clean data into the model
- Let it create prediction rules from patterns
- Test if predictions match real past results
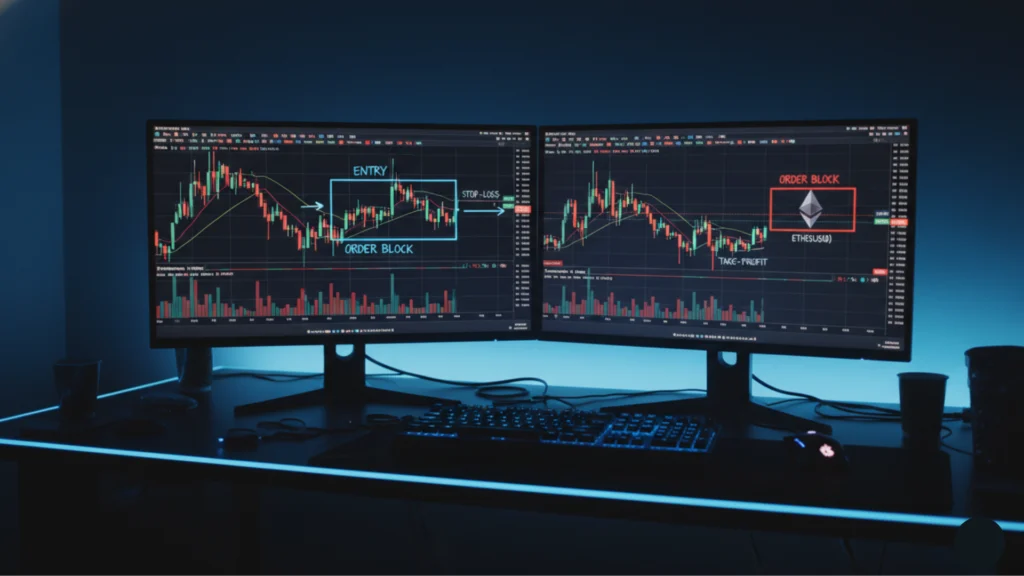
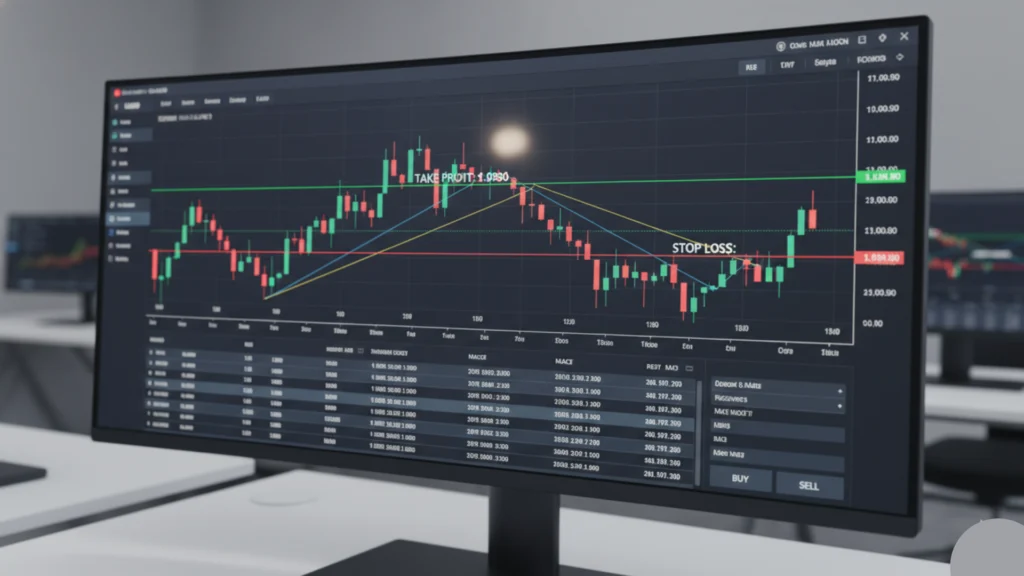
Step 5: Create Buy and Sell Rules
- Entry conditions — when should the AI enter a trade?
- Exit conditions — when should it take profit?
- Stop-loss logic — when should it cut the loss?
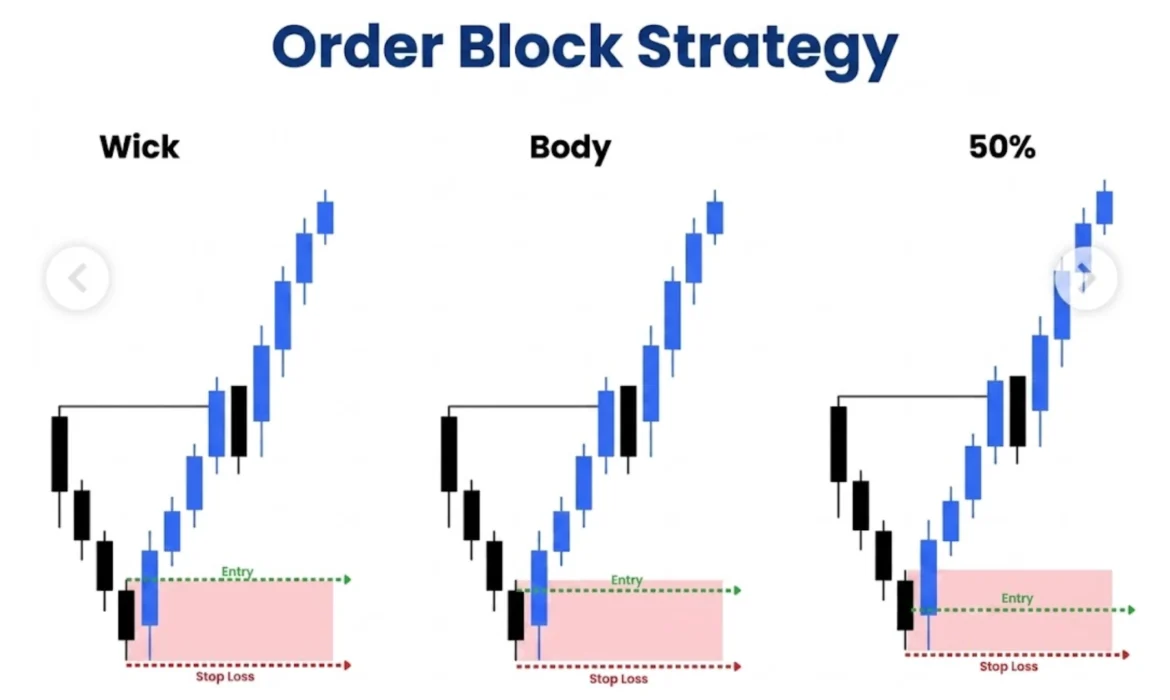
These rules are the heart of your order block strategy.
Step 6: Backtest the Strategy
Backtesting means testing your strategy on old data to see if it would have worked.
- Use tools like QuantConnect or TradingView
- Measure win rate, drawdown, and profit factor
- AI strategy backtesting shows weaknesses before going live
Step 7: Paper Trade First
- Set up a demo account with your broker
- Run your strategy on live prices without real money
- Forward testing shows if results match backtesting
This step saves beginners from costly mistakes.
Step 8: Go Live with Small Capital
- Start with money you can afford to lose
- Track every trade carefully
- Scale up only after consistent performance
Real Example of an AI Trading Strategy
Stock example: Use machine learning to find stocks breaking above 50-day moving average with rising volume. Enter on breakout, exit at 5% profit.
Crypto example: Use sentiment analysis on Twitter and Reddit. Buy when positive sentiment spikes. Sell when sentiment drops.
Forex example: Use deep learning to predict EUR/USD direction based on economic news and price patterns.
Beginner case study: A beginner used QuantConnect with a simple moving average crossover strategy. After backtesting and paper trading for 30 days, they went live with $500 and made a 12% return in 6 weeks.
Best AI Tools for Building Trading Strategies
- TradingView — great for chart analysis and strategy alerts
- MetaTrader 5 — popular for forex and automated trading
- QuantConnect — full Python-based algorithmic trading platform
- TensorFlow / PyTorch — for building deep learning models
- ChatGPT — for generating ideas, writing code, and strategy debugging
- AlgoBuilder and no-code AI platforms — perfect for beginners without coding skills
How to Use ChatGPT to Build Trading Strategies
ChatGPT is a powerful AI tool for traders. Here is how to use it:
- Generate strategy ideas — ask for new strategy concepts based on indicators
- Write trading scripts — request Python code for your strategy
- Explain technical indicators — understand RSI, MACD, Fibonacci in simple words
- Improve backtesting code — ask ChatGPT to fix or optimize your existing code
- Debug trading bots — paste your code and ask what is wrong
This makes build trading strategy with AI much easier for beginners.
Risk Management for AI Trading Strategies
Why risk management matters Even the best AI strategy can lose. Proper risk management protects your account.
- Stop-loss setup — always define your maximum loss per trade
- Position sizing — never risk more than 1-2% of your account on one trade
- Daily loss limits — stop trading if you lose more than 3% in a day
- Portfolio diversification — spread risk across multiple assets
Risk management is what separates winners from those who blow their accounts.
Common Mistakes When Building AI Trading Strategies
- Using poor quality or dirty data
- Overfitting the model to past data — it works on history but fails live
- Ignoring transaction costs like spreads and commissions
- Trusting AI without monitoring it regularly
- Starting with real money too soon
Avoid these mistakes and your AI stock trading strategy will last longer.
How to Improve Your AI Strategy Over Time
- Retrain the model every few months with new data
- Add new data sources like sentiment or macro indicators
- Remove weak indicators that add noise
- Adjust to changing market conditions — what worked last year may not work today
- Continuous testing keeps your strategy sharp
Trading strategy optimization with AI is an ongoing process, not a one-time task.
AI Trading Strategy vs Traditional Trading Strategy
| Feature | AI Trading | Traditional Trading |
|---|---|---|
| Speed | Milliseconds | Minutes or hours |
| Accuracy | Data-driven | Experience-based |
| Emotions | None | High influence |
| Automation | Full | Manual |
Both approaches have merit. Combining human insight with AI power is often the best approach.
How Much Money Do You Need to Start AI Trading?
- Free tools setup — $0 (use demo accounts and free platforms)
- Low-budget setup — $100–$500 to go live
- Mid-level setup — $1,000–$5,000 for better results
- Professional setup — $10,000+ with premium data and tools
Hidden costs include data subscriptions, broker fees, and server hosting for bots.
Is AI Trading Safe for Beginners?
Benefits: faster decisions, no emotions, automation
Risks: models can fail, markets change, bugs can cause big losses
Learning curve: it takes time to understand both trading and AI
Always use a demo account first. Start with a no-code AI trading platform if coding feels hard.
Can AI Beat Human Traders?
AI strengths: speed, consistency, data processing, no emotions
Human strengths: intuition, common sense, adapting to news events
Where humans still win: during unexpected global events, AI often fails. Humans understand context better.
Best approach: use AI for execution and analysis. Use human judgment for big decisions.
Future of AI in Trading
- AI trading in 2026 and beyond will be even more accessible
- Self-learning bots will adjust to market changes automatically
- Multi-agent systems will manage complex portfolios autonomously
- AI hedge funds are already beating many human-managed funds
- Retail trader opportunities will grow as tools get cheaper and easier
Beginner Roadmap to Start AI Trading
- Learn trading basics
- Learn simple Python coding
- Choose one market to focus on
- Collect and clean your data
- Build your first simple strategy
- Backtest thoroughly
- Paper trade for at least 30 days
- Go live with small capital
- Improve slowly over time
Checklist Before Launching Your AI Trading Strategy
✅ Strategy rules clearly defined
✅ Data quality checked and cleaned
✅ Backtesting completed with good results
✅ Paper trading results stable for 30+ days
✅ Risk management rules added
✅ Broker connection tested and working
Frequently Asked Questions
Question: Can AI guarantee profits in trading?
Answer: No. AI improves your odds but cannot guarantee profits. Markets are unpredictable and all trading involves risk.
Question: Do I need coding skills to build AI trading strategies?
Answer: Not always. No-code AI trading platforms let you build strategies without writing a single line of code.
Question: Can beginners use AI for trading?
Answer: Yes. Many AI tools for trading beginners are simple, visual, and easy to use even with no experience.
Question: Which AI tool is best for strategy building?
Answer: TradingView and QuantConnect are great starting points. ChatGPT is useful for generating and debugging strategies quickly.
Question: How long does it take to create an AI trading strategy?
Answer: A basic strategy can take 1–2 weeks. A well-tested, optimized strategy may take 2–3 months.
Question: Is AI trading legal?
Answer: Yes. Automated and algorithmic trading is legal in most countries. Always check your local broker and financial regulations.
Question: Can ChatGPT build trading bots?
Answer: Yes. ChatGPT can write Python code for trading bots, explain logic, and help fix errors. It is a great coding assistant.
Question: What is the safest way to start AI trading?
Answer: Start with a demo account, backtest your strategy, paper trade for 30 days, then go live with very small capital.
Conclusion
Building high-performing trading strategies with AI is possible for anyone — even beginners. The key is to start simple, learn step by step, and always test before going live.
Key takeaways:
- AI makes trading faster, smarter, and more consistent
- Always backtest and paper trade before using real money
- Risk management is more important than any strategy
- AI is a tool — human oversight is still needed
- Keep improving your strategy as markets change
AI is not a magic money machine. But when used correctly, it is one of the most powerful tools a trader can have. Start small, stay patient, and let data guide your decisions.
Order Block Strategy: How to Trade Like Smart Money in 2026
Why Order Block Strategy Works in Trading
The order block strategy is one of the most powerful tools in trading today. It is used by smart money traders, institutions, and beginners who want to trade like the pros. But why does it actually work?
Why Institutions Create Order Blocks
Big banks and institutions cannot buy or sell millions of dollars in one go. They need to split their orders. So they leave behind a “block” of orders at certain price zones. These zones are called institutional order blocks. When price comes back to these zones, institutions fill the rest of their orders. That is why price reacts strongly there.
How Price Reacts to Order Blocks
When price reaches an order block zone, it often bounces sharply. This is because big players are waiting there. A bullish order block causes price to rise. A bearish order block causes price to fall. The reaction is fast and strong.
Why Traders Trust Order Block Zones
Traders trust these zones because they are based on real buying and selling by institutions. Unlike random lines, smart money order blocks have a reason behind them. They are not guesses. They are logical zones where price has reacted before.
Step-by-Step Order Block Strategy for Beginners
Learning order block trading strategy for beginners is easier when you break it into simple steps.
Step 1: Find the Market Trend
Always start with the big picture. Is price going up or down? Use a higher timeframe like the daily or 4-hour chart. If price is making higher highs and higher lows, it is bullish. If it is making lower highs and lower lows, it is bearish. Only trade order blocks in the direction of the trend.
Step 2: Mark the Order Block Zone
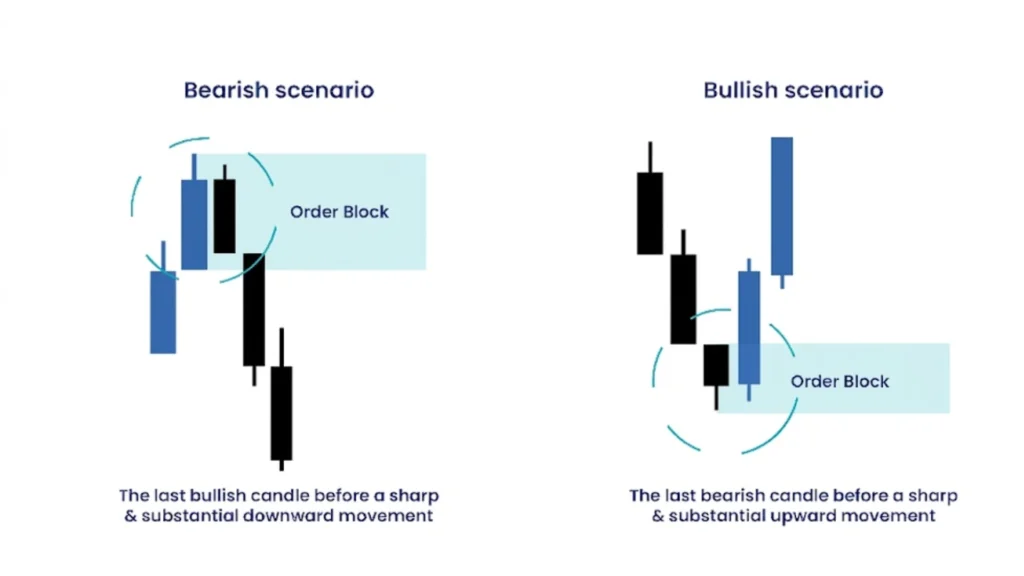
Look for the last bearish candle before a big bullish move. That is your bullish order block. For a bearish order block, look for the last bullish candle before a strong drop. Mark the high and low of that candle as your zone.
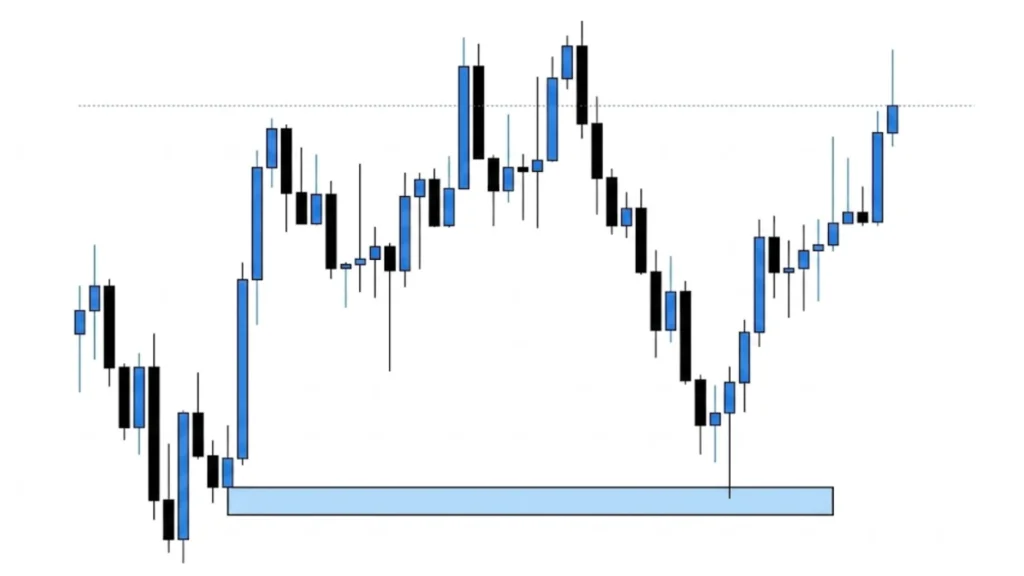
Step 3: Wait for Price Retest
Do not jump in right away. Wait for price to come back and retest the order block zone. This is called a retest or pullback. Patience here is everything.
Step 4: Confirm Entry Signal
Once price enters the zone, look for a confirmation signal. This could be a strong rejection candle, a fair value gap, or a break of structure. Never enter without a signal.
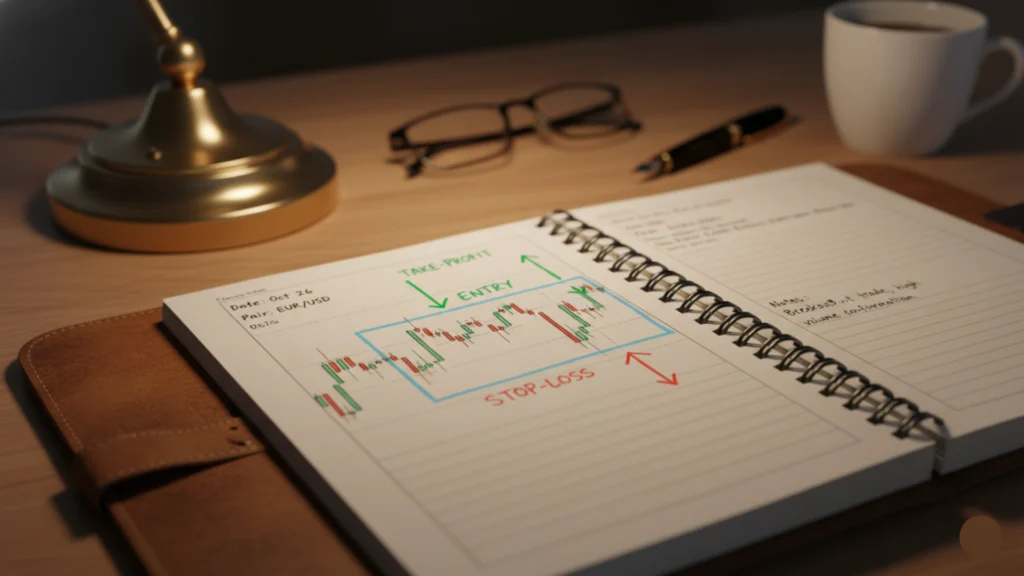
Step 5: Manage the Trade
Set your stop-loss below the order block. Set your take-profit at the next key level. Follow your plan and do not move your stop-loss out of emotion.
How to Confirm an Order Block Strategy Setup
A good order block setup needs confirmation. Without it, you are just guessing.
Confirm with Break of Structure (BOS)
A break of structure order block setup means price broke a previous high or low. This tells you momentum is real. When BOS happens near your zone, it is a strong signal.
Confirm with Liquidity Sweep
An order block liquidity sweep happens when price briefly dips below a low or above a high to grab stop-losses. This is a trap set by smart money. After the sweep, price reverses. This is a great time to enter.
Confirm with Fair Value Gap (FVG)
A fair value gap and order block setup is very powerful. FVG is a gap between candles where price moved too fast. When an FVG is inside your order block zone, it adds extra strength to the setup.
Confirm with Strong Candlestick Rejection
Look for a big bullish or bearish candle with a long wick inside the zone. This shows that price tried to move one way but got pushed back hard. That is order block confirmation in action.
Order Block Strategy and Market Structure
Market structure and order block go hand in hand. You cannot trade order blocks without understanding structure.
Understanding Higher Highs and Higher Lows
In a bullish market, price makes higher highs (HH) and higher lows (HL). This tells you buyers are in control. You should look for bullish order blocks at the HL areas.
Understanding Lower Highs and Lower Lows
In a bearish market, price makes lower highs (LH) and lower lows (LL). Sellers are in control. Look for bearish order blocks at LH areas.
Change of Character (CHOCH)
Change of character and order block is a key concept. CHOCH happens when price breaks the pattern. For example, in a downtrend, price suddenly makes a higher high. This may signal a reversal. Look for order blocks after CHOCH for early entries.
Break of Structure in Order Block Trading
BOS confirms that price is continuing in one direction. If you see a BOS after a retest of your order block zone, that is a clean signal to enter the trade.
Best Entry, Stop-Loss, and Take-Profit in Order Block Strategy
Order block risk management is just as important as finding the zone.
Best Entry Point in an Order Block
The best entry is at the top of a bullish order block or the bottom of a bearish order block. You can also wait for a rejection candle inside the zone. This gives you the tightest stop-loss and best reward.
Where to Place Stop-Loss
Place your order block stop loss a few pips below the order block for buys. For sells, place it above the zone. This protects you if the zone fails.
How to Set Take-Profit Targets
Your order block take profit should be at the next major high or low. You can also aim for the next liquidity pool or imbalance zone. Use the higher timeframe chart to identify these levels.
Ideal Risk-to-Reward Ratio
Always aim for at least 1:2 or 1:3 risk-to-reward. This means if you risk $100, you should aim to make $200 or $300. This is how professional traders stay profitable even with losses.
How to Use Order Block Strategy on TradingView
Order block strategy on TradingView is simple once you know the steps.
How to Draw Order Blocks on TradingView
Use the rectangle tool on TradingView. Draw from the high to the low of your chosen candle. Color bullish zones blue or green. Color bearish zones red or orange. Keep it clean and simple.
Best Order Block Indicators
The best order block indicator tools on TradingView include the “ICT Order Block” script and “Smart Money Concepts” indicator. These automatically mark zones for you. They save time and reduce errors.
Setting Alerts for Order Blocks
Use TradingView alerts to notify you when price enters a zone. Set an alert on the rectangle border. This way, you do not have to stare at the chart all day.
TradingView Tips for Beginners
Use the multi-timeframe view. Check the 1-hour, 4-hour, and daily charts together. Always zoom out before zooming in. Clean charts are better than busy ones.
Order Block Strategy for Scalping
Order block scalping strategy uses small timeframes to catch quick moves.
Best Timeframes for Scalping Order Blocks
Use the 1-minute, 5-minute, or 15-minute charts. Mark your zones on the 15-minute and enter on the 1-minute or 5-minute.
Fast Entry Techniques
Wait for a rejection wick inside the zone. Enter on the close of the rejection candle. Move your stop-loss to breakeven once price moves in your favor.
Scalping Risk Management
Never risk more than 0.5% to 1% per scalp trade. Scalping requires discipline. Keep your losses small and let your wins grow.
Swing Trading with Order Block Strategy
Order block swing trading is slower but offers bigger rewards.
Best Timeframes for Swing Trading
Use the daily or 4-hour chart to find zones. Enter on the 1-hour for a better price. Swing trades can last days or even weeks.
Holding Trades for Bigger Moves
Be patient. Once you enter, give the trade space to breathe. Do not close early because of small pullbacks. Let the market structure guide your exit.
Combining Swing Trading with Market Structure
Always align your swing trade with the higher timeframe trend. If the daily is bullish, only take bullish order block setups on the 4-hour. This adds extra confidence to your trades.
Order Block Strategy in Forex, Crypto, and Stocks
The order block strategy works across multiple markets.
Order Block Strategy in Forex Trading
Forex order block strategy is very popular. Currency pairs like EUR/USD and GBP/USD create clean order blocks. Trade during London and New York sessions for best results.
Order Block Strategy in Crypto Trading
Order block for crypto trading works well because crypto is driven by whale activity. Whales behave like institutions. Their footprints show up as order blocks on Bitcoin and Ethereum charts.
Order Block Strategy in Stock Trading
Order block for stock market trading works best on liquid stocks. Use it on daily and 4-hour charts. Earnings seasons can disrupt zones, so be careful around news events.
Order Block Strategy for Bitcoin and Ethereum
Bitcoin Order Block Example
On a Bitcoin daily chart, mark the last bearish candle before a big bullish rally. That zone often gets retested before the next move up. This is a classic order block in Bitcoin trading setup.
Ethereum Order Block Example
Ethereum often forms cleaner order blocks than Bitcoin. Use the 4-hour chart. Watch for strong moves away from zones. When price comes back, the reaction is usually fast.
Crypto Market Volatility and Order Blocks
Crypto is more volatile than forex. Use wider stop-losses. Do not be scared by wicks. Focus on the zone and confirmation, not every small candle.
Common Signs of a Fake Order Block
Not every zone is valid. Knowing the difference between a valid order block and an invalid order block saves you money.
Weak Price Reaction
If price barely moved away from the zone the first time, it is probably not a strong order block. Look for zones that caused big, fast moves.
No Strong Displacement
A real order block creates strong displacement. If the move away from the zone was slow and weak, skip the zone.
Multiple Retests Without Bounce
If price has already touched the zone two or three times, it is likely used up. A fresh order block or unmitigated order block has only been tested once.
Lack of Market Structure Confirmation
If there is no BOS or CHOCH near the zone, be careful. Structure confirmation makes the setup much stronger.
Order Block Strategy Checklist Before Entry
Always run through this checklist before entering any order block trading setup.
Is the Trend Clear?
Check the higher timeframe. Is the trend up or down? Only trade in that direction.
Is the Order Block Fresh?
Has the zone been tested before? A fresh, unmitigated order block is always stronger than a used one.
Is There Liquidity Nearby?
Is there a cluster of stop-losses near the zone? Liquidity nearby makes the setup more attractive for smart money.
Is Risk-to-Reward Worth It?
Is your take-profit at least twice your stop-loss? If not, skip the trade. Protect your capital always.
Best Indicators to Combine with Order Block Strategy
RSI and Order Blocks
When RSI is oversold at a bullish order block, it adds confidence. When it is overbought at a bearish order block, it is a strong sell signal.
Moving Average and Order Blocks
Use the 50 or 200 EMA. If price is above the 200 EMA and retests a bullish order block, the setup is stronger.
Fibonacci Retracement
Draw Fibonacci from a swing high to swing low. When the 61.8% or 78.6% level aligns with your order block, it is a very strong zone.
Volume Analysis
High volume near your order block zone confirms institutional activity. Low volume means little interest.
VWAP Confirmation
VWAP is great for intraday trading. If price bounces off VWAP and your order block at the same time, it is a strong signal.
Common Order Block Strategy Mistakes to Avoid
Marking Too Many Order Blocks
More is not better. Mark only the strongest, freshest zones. Too many zones create confusion.
Ignoring Higher Timeframe Trend
Always check the big picture. Trading against the trend is one of the most common order block trading mistakes.
Entering Without Confirmation
Never enter just because price is in the zone. Always wait for confirmation like a rejection candle or BOS.
Poor Risk Management
Even the best setup can fail. Always use a stop-loss. Never risk more than 1% to 2% of your account per trade.
How Professional Traders Use Order Block Strategy
Institutional Trading Concepts
Institutions plan their moves in advance. They create zones intentionally. Understanding institutional trading zones helps you see the market through their eyes.
Smart Money and Order Blocks
Smart money concept trading is all about following the big players. Order blocks are the footprints they leave behind. Find the footprints and trade with them.
Combining Liquidity and Order Blocks
Professional traders combine order block liquidity sweep with their entries. They wait for price to grab liquidity before entering. This gives them a much better entry price.
Can You Use Order Block Strategy Without ICT?
Understanding ICT Concepts
ICT order block concepts were developed by Inner Circle Trader (ICT). They include market maker models, PD arrays, and more. They are detailed but powerful.
Using Order Blocks Independently
Yes, you can use the order block strategy without studying all ICT concepts. The basic idea of marking zones and waiting for reactions works on its own.
Which Approach Is Better for Beginners
Start with the basics. Learn how to mark and trade order blocks first. Then slowly add ICT concepts as you grow. Do not overwhelm yourself at the start.
How to Backtest an Order Block Strategy
Using Replay Mode
TradingView has a bar replay feature. Go back in time and practice finding and trading order block setups. This builds skill fast without risking real money.
Recording Trade Results
Write down every backtest trade. Note the timeframe, entry, stop-loss, result, and what you learned. Over time, patterns will emerge.
Improving Strategy Accuracy
After 50 to 100 backtested trades, look for what worked and what did not. Adjust your rules based on data, not emotion.
Order Block Trading Journal Template
What to Record in a Trading Journal
Write down: Date, asset, timeframe, order block type (bullish/bearish), entry price, stop-loss, take-profit, result, and notes about the setup.
Tracking Wins and Losses
Track your win rate and average risk-to-reward. If your win rate is 50% and your RR is 1:2, you are profitable. Numbers do not lie.
Learning from Past Trades
Review your journal weekly. Look for repeated mistakes. Learning from losses is how you grow as a trader.
Best Time to Trade Order Block Strategy
London Trading Session
The London session (8 AM to 12 PM GMT) is the most active forex session. Many order block trading setups trigger during this time.
New York Trading Session
The New York session (1 PM to 5 PM GMT) is the second most active. Combine it with London for the best volatility.
Asian Session
The Asian session is quieter. Price often consolidates. Use this time to plan your trades, not execute them.
Session Overlaps
The London-New York overlap (1 PM to 5 PM GMT) is the most volatile period. This is when the biggest moves happen. Perfect for order block day trading.
Is Order Block Strategy Good for Beginners?
Benefits for New Traders
The order block trading strategy for beginners is great because it is logical and visual. You can see the zones on the chart. It teaches you to think like institutions, not just react to price.
Challenges Beginners Face
Beginners often mark too many zones or enter too early. It takes time to develop patience and discipline. The strategy is simple, but the mindset takes practice.
Tips to Learn Faster
Start on a demo account. Backtest 100 trades before going live. Watch experienced traders apply the order block strategy on real charts. Practice every single day.

The order block strategy is not just a trading method. It is a complete way of understanding how markets move. When you learn to see the market through institutional eyes, everything changes. Start simple, be patient, and trust the process.

Risk Management in Forex: Protect Your Trading Money
What Is Risk Management in Forex?
Risk management in forex means planning how to protect your money while trading currencies. It is not just about making profits. It is about making sure you do not lose everything when a trade goes wrong.
Every trade in the forex market carries some level of risk. Prices move fast. Even experienced traders face unexpected losses. That is why risk management in forex is so important.
When you manage risk properly, you decide in advance how much money you are willing to lose on a trade. You also plan your exit points before entering. This keeps your trading account safe even during bad runs.
Why Risk Management in Forex Matters Before You Place Your First Trade
Before you ever click “buy” or “sell,” you need to understand one thing — saving your capital comes first.
Many beginners think forex trading is about finding the next big winning trade. But professionals know the real goal is to stay in the game long enough to profit consistently.
Making profit and protecting money are two different things. You can have 10 winning trades, but one huge loss can wipe them all out. That is why forex capital protection must come before profit chasing.
Beginners often ignore risk control because they are excited. They want fast results. But skipping risk management is the fastest way to lose your trading account.
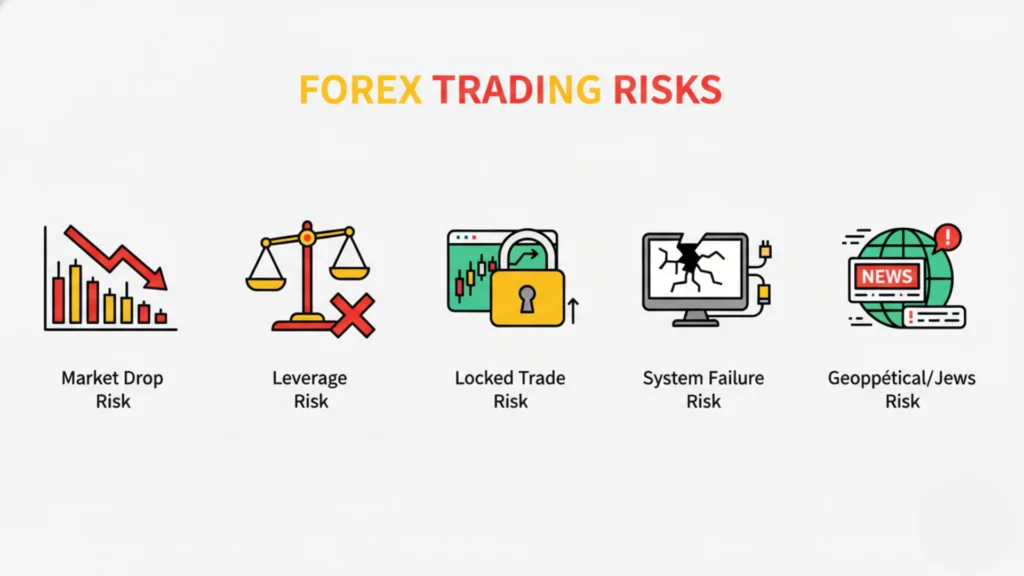
What Are the Main Risks in Forex Trading?
Market risk is the most common. Prices change every second. No one can predict the market perfectly.
Leverage risk is very dangerous for new traders. Leverage lets you control large amounts of money with a small deposit. But it also multiplies your losses quickly.
Liquidity risk happens when you cannot exit a trade at your desired price. This often occurs during major news events.
Operational risk includes technical problems like internet failure, platform crashes, or wrong order entries.
Country and political risk means that news like elections, wars, or economic changes in a country can cause sudden and sharp currency movements.
Common Types of Forex Risk
Transaction risk happens when the currency exchange rate changes between the time you open and close a trade. This affects your actual profit or loss.
Translation risk is more common for businesses. It happens when foreign assets are converted back to the home currency and the rate has changed.
Economic risk is the long-term effect of economic changes on currency values. If a country’s economy gets weaker, its currency usually falls.
Interest rate risk means that central banks raising or lowering interest rates can cause big currency movements. Traders must watch central bank news carefully.
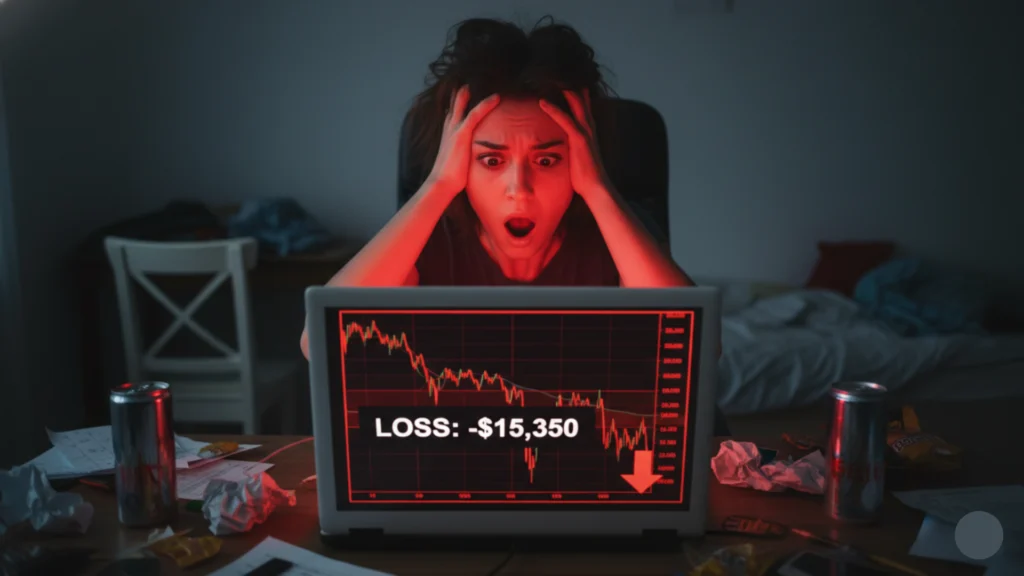
Simple Example of Risk in Forex Trading
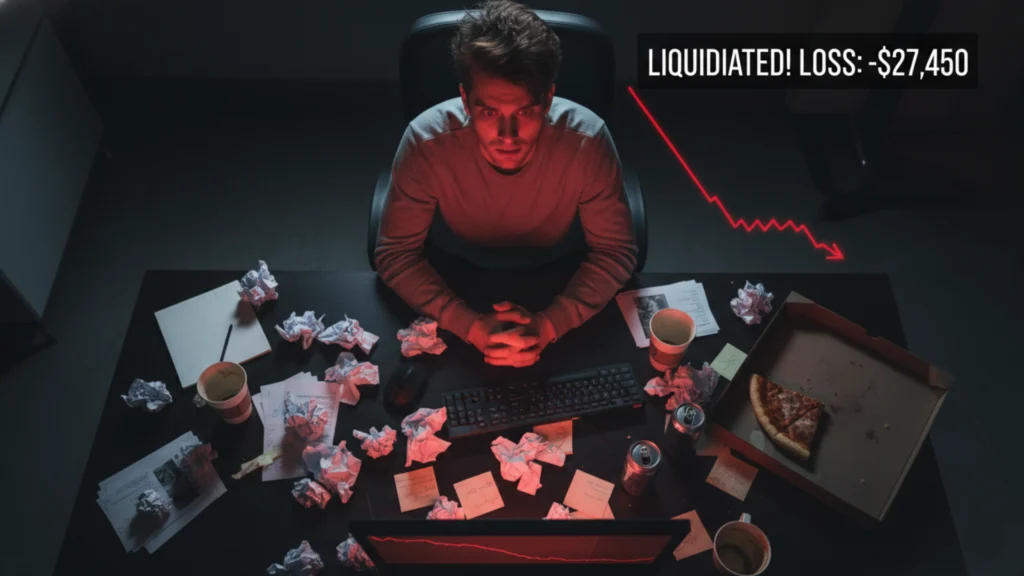
Imagine a beginner opens a $1,000 trading account. They feel confident and risk $500 on a single trade — that is 50% of their account. The trade goes wrong, and they lose $500.
Now they only have $500 left. To recover, they need to make a 100% gain just to get back to where they started. That is very hard.
This is a real-life story for thousands of new traders. It shows why forex loss management matters from the very beginning. One bad trade, made without proper risk control, can destroy weeks or months of effort.
Safe trading means never risking more than you can afford to lose on a single trade.
Core Risk Management in Forex Rules
The 1% Rule in Forex Trading
The 1% rule means you never risk more than 1% of your total trading account on a single trade. If your account has $1,000, you risk only $10 per trade.
Many traders use this rule because it protects your account during losing streaks. Even if you lose 10 trades in a row, you still have 90% of your money left.
For example, with a $2,000 account, your maximum risk per trade is $20. This is the foundation of smart forex risk per trade management.
Position Sizing
Position sizing means choosing how many units or lots to trade based on your risk limit. It is not about guessing. It is about calculating the right trade size every time.
If you set a stop loss of 20 pips and your maximum risk is $10, your position size should match that calculation. Forex position sizing keeps losses predictable and controlled.
Stop Loss Orders
A stop loss order automatically closes your trade when the price moves against you by a set amount. It is the most basic and powerful tool in forex trading risk control.
Without a stop loss, one bad trade can run for hours and wipe out your account. Common mistakes include placing stop losses too tight, or not using them at all.
Take Profit Orders
A take profit order closes your trade automatically when it reaches your profit target. This removes the temptation to stay in a trade too long out of greed.
Take profit orders support forex trading discipline. They help you lock in gains without emotion getting in the way. Good traders always plan their exit before they enter.
Risk Reward Ratio
The risk reward ratio in forex tells you how much profit you aim for compared to how much you are risking. A 1:2 ratio means for every $1 you risk, you aim to make $2.
Most professional traders aim for at least a 1:2 or 1:3 risk to reward ratio. This means even if you lose more trades than you win, you can still be profitable overall.
Best Risk Management Strategies in Forex
Use Proper Leverage
High leverage is one of the biggest reasons traders lose money. Using 1:500 leverage means a small move against you creates a huge loss.
For beginners, safe leverage is usually between 1:10 and 1:20. Managing leverage in forex trading is not just smart — it is essential for survival.
Diversify Your Trades
Putting all your money into one currency pair is very risky. If that pair moves against you, everything is at risk.
Forex portfolio diversification means spreading trades across different currency pairs. This way, one loss does not destroy your entire account.
Use Hedging Strategies
Hedging in forex means opening a trade in the opposite direction to protect yourself from big losses. For example, if you are long on EUR/USD, you might open a small short position to reduce risk.
Simple hedging methods include using correlated pairs or options. Forex hedging strategy works well for traders who want to reduce exposure during uncertain market conditions.
Set Daily and Weekly Loss Limits
A daily loss limit means you stop trading for the day if you lose a certain amount. This prevents emotional trading after a bad day.
For example, if your daily risk limit is 3% of your account, you stop trading the moment you reach that loss. This is one of the best daily risk management in forex habits you can build.
Trade Only with a Clear Plan
Random trading always leads to random results. A proper forex trading risk plan includes your entry rules, exit rules, risk percentage, and trading hours.
Building a daily routine makes you a more disciplined and consistent trader. It removes guesswork and keeps emotion out of your decisions.
Beginner Mistakes in Risk Management in Forex
Trading Without a Stop Loss
This is the most dangerous habit. Always use a stop loss, no matter how confident you feel about a trade.
Risking Too Much on One Trade
Never put a large portion of your account on one trade. Stick to the 1% or 2% rule every time.
Using Too Much Leverage
High leverage feels exciting but destroys accounts fast. Keep leverage low, especially as a beginner.
Revenge Trading After Losses
After a loss, many traders try to win it back immediately. This is called revenge trading, and it leads to even bigger losses. Walk away, breathe, and come back later.
Ignoring Market News
Big news events like interest rate decisions or job reports can cause sudden, sharp market moves. Always check the economic calendar before trading.
How to Protect a Small Forex Account
Start with small lot sizes. Micro lots let you trade with very little risk per pip. This gives you experience without destroying your account.
Avoid overtrading. More trades do not mean more profit. Focus on quality setups, not quantity.
Focus on survival before profits. Your first goal as a beginner is to keep your account alive. Profits will come with experience and discipline.
Grow slowly. Doubling your account in a week is a fantasy. Consistent, small gains compound beautifully over time. Protecting your small account is the best forex trading survival strategy.
Managing Losing Streaks in Forex
A losing streak is a series of back-to-back losing trades. Every trader faces them. The key is how you respond.
Reduce your trade size when you are losing. If you normally risk 1%, drop it to 0.5% until your confidence and account recover.
Know when to stop. If you have hit your weekly loss limit, stop trading. Rest, review your strategy, and return with a fresh mind. Forex account drawdown control saves careers.
Risk Management in Forex for Different Trading Styles
Risk Management in Forex for Scalping
Scalpers make many quick trades. They must use very tight stop losses and only risk a tiny amount per trade due to the high frequency of trades.
Risk Management in Forex for Day Trading
Day traders should set a clear daily loss limit. Close all trades before the market closes to avoid overnight gaps.
Risk Management in Forex for Swing Trading
Swing traders hold trades for days or weeks. They need wider stop losses but must maintain strong forex drawdown management practices.
Risk Management for Long-Term Traders
Long-term traders face weekend and overnight risks. Smaller position sizes and strong fundamental analysis are essential for this style.
Daily Forex Risk Management Checklist
Before Entering a Trade
Check the current market conditions and avoid trading during high-impact news. Set your stop loss and take profit levels. Use a forex trade risk calculator to confirm your position size is correct.
During the Trade
Follow your plan strictly. Do not move your stop loss further away from your entry. Stay calm and avoid emotional changes based on short-term price movements.
After Closing the Trade
Review what happened. Did you follow your plan? Record everything in your trading journal — wins, losses, and lessons. This is the core of forex trading discipline.
Useful Forex Risk Management Tools
Forex Risk Calculator
Forex Risk Calculator helps you calculate how much money you are risking based on your stop loss size and account balance.
Position Size Calculator
This tells you exactly how many lots to trade based on your risk percentage and stop loss distance.
Trading Journal
A journal records every trade. It shows patterns in your wins and losses and improves decision-making over time.
Economic Calendar
This shows upcoming news events that may affect currency prices. Checking it daily is a key part of risk management in forex trading.
Broker Risk Management in Forex Features
Many brokers offer features like negative balance protection, margin alerts, and stop out levels. Use them fully.
Risk Management vs Money Management in Forex
Risk management in Forex focuses on how much you can lose on a single trade or in a single day. It is about protecting your account from big drawdowns.
Money management in forex is broader. It covers how you grow your account, how you reinvest profits, and how you allocate capital across trades.
The key difference is that risk management in forex is defensive, while money management also includes the growth side. Both are essential, and neither works well without the other.
How Professional Forex Traders Manage Risk
Professionals never risk more than 1-2% per trade. They follow written rules every single day without exception.
When they face losses, they do not panic. They reduce position sizes, review their strategy, and return when conditions improve.
Most importantly, professionals protect capital first. They know that as long as they have money in their account, they have another chance. Forex trading without losing money entirely is possible when you treat capital preservation as the top priority.
Emergency Risk Plan for Sudden Market Moves
During major news events, spreads widen and prices jump. Avoid trading 30 minutes before and after big announcements.
During unexpected volatility, close or reduce risky positions immediately. Do not wait and hope the market recovers.
During broker or platform failure, always have your broker’s phone number ready. Know how to close trades manually if your platform crashes. This is part of every serious forex trading risk plan.
Best Habits for Strong Risk Discipline
Write your trading rules down and follow them every day. Rules that only exist in your head are easy to break.
Stay calm during losses. Every trader loses. The ones who succeed are those who lose small and win consistently.
Review your trades every week. Spot your mistakes and celebrate good discipline, not just profits.
Learning from mistakes is the most powerful growth tool in forex trading. Trading psychology and risk management in forex go hand in hand.
Can You Make Consistent Profit Without Risk Management in Forex?
No. The answer is almost always no. Traders who ignore risk control may win for a while, but eventually one bad trade or bad streak destroys everything.
Risk control in currency trading is what separates short-term gamblers from long-term professionals. It gives your strategy the space to work over time.
The connection between safety and success in forex is simple — the longer you stay in the game, the more opportunities you have to profit. Best forex risk management strategy is the foundation under every great trading career.
Frequently Asked Questions About Risk Management in Forex
Question: What is the best risk management strategy in forex?
Answer: The best strategy combines the 1% rule, stop loss orders, proper position sizing, and a risk reward ratio of at least 1:2. Consistency matters more than any single technique.
Question: How much should I risk per trade?
Answer: Most traders recommend risking 1% to 2% of your account per trade. This keeps losses small and manageable even during long losing streaks.
Question: Can beginners use leverage safely?
Answer: Yes, but only with low leverage levels like 1:10 or 1:20. High leverage should only be used by experienced traders who fully understand the risks.
Question: How do I calculate forex trading risk?
Answer: Use a forex risk calculator. Enter your account size, stop loss in pips, and risk percentage. The calculator shows you the correct position size.
Question: Why do most traders lose money in forex?
Answer: Most traders lose because they use too much leverage, ignore stop losses, trade emotionally, and skip proper risk management in Forex. Beginner risk management in forex education is the most important first step.
Inducement in Forex: How Smart Money Traps Retail Traders
Introduction: What is Inducement in Forex?
Inducement in forex is when the market moves in one direction on purpose — just to trick traders into entering a trade — and then reverses sharply the other way.
Think of it like a bait trap. The market “shows” you something that looks real. You jump in. Then it goes the opposite way.
Why must traders understand it?
If you don’t know about inducement, you will keep losing trades and never know why. Most retail traders fall into these traps every single day.
Quick example:
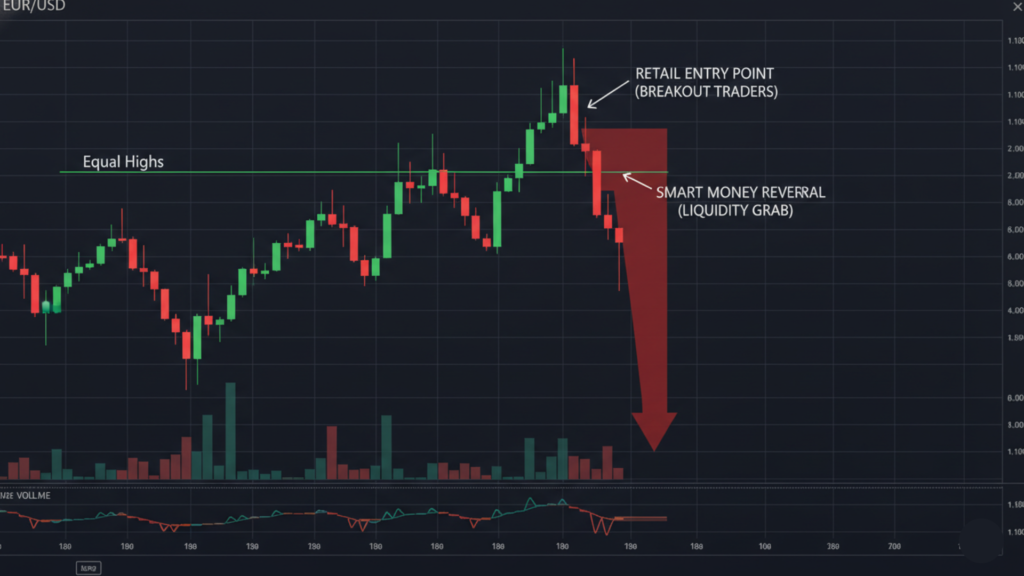
Imagine price is moving up and breaks a recent high. You think, “Great! This is a breakout!” You buy. Then suddenly, price drops hard and hits your stop loss. That was inducement.
Why Inducement Happens in the Forex Market
Big players — like banks and institutions — need a lot of buy or sell orders to move their huge positions. They can’t just click a button and enter like you do.
They need liquidity. And who provides that? Retail traders like us.
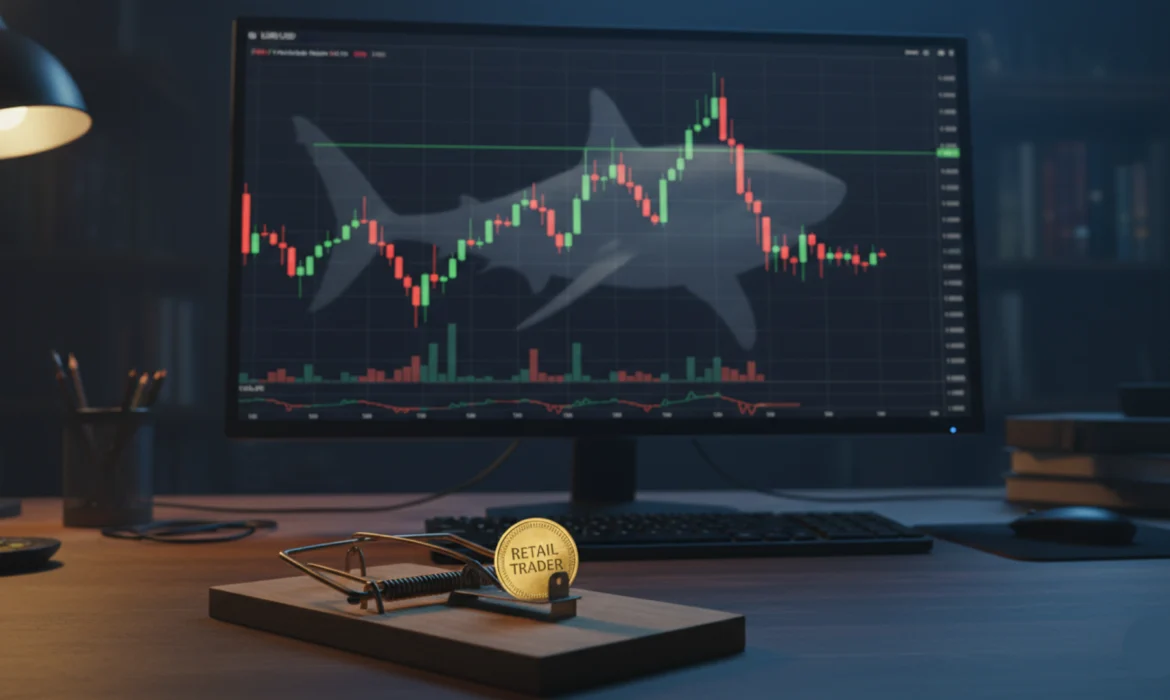
Simple story — “Trap and Move”:
Imagine a big fish in a pond. It moves the water to push small fish into one corner. Then it eats them all at once. That’s exactly what happens in forex. Big money pushes price into an area where retail orders are sitting — then collects them all and moves the real direction.
This is the heart of the forex inducement strategy.

Who Creates Inducement? (Smart Money Explained)
Banks and institutions move billions of dollars every day in the forex market. They plan their entries carefully. They know where retail traders place their stops and entries.
Market makers are companies or banks that provide prices to the market. They often know where most orders are sitting. So they can move price toward those areas first before reversing.
Retail vs Smart Money:
| Retail Traders | Smart Money |
|---|---|
| React to price | Plan price movement |
| Chase breakouts | Set the traps |
| Follow indicators | Follow liquidity |
| Enter early | Enter after liquidity is collected |
Smart money concepts forex traders use always focus on where liquidity is hiding — not just where price is going right now.
How Inducement Works (Step-by-Step)
Here’s exactly how inducement in forex plays out:
- Price moves in one direction — looks like a strong trend or breakout
- Retail traders enter — thinking it’s a real move
- Liquidity builds up — stop losses and pending orders pile up
- Price reverses sharply — smart money collected what it needed
This is how inducement forex explained works in real life. The move that looks like a breakout is actually a collection of retail orders. Once collected, price moves the real direction.
Key Concepts You Must Understand First
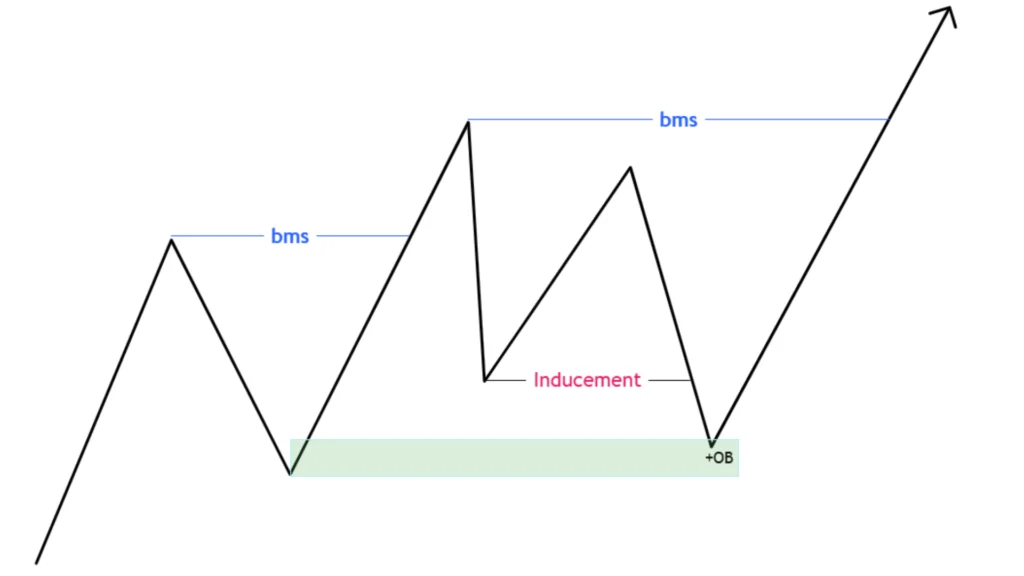
Market Structure (BOS & CHOCH)
Market structure means the way price moves — higher highs and higher lows in an uptrend, lower highs and lower lows in a downtrend. A Break of Structure (BOS) means price broke a recent swing high or low. A Change of Character (CHOCH) means the trend is shifting. Inducement in market structure often happens right before a BOS or CHOCH.
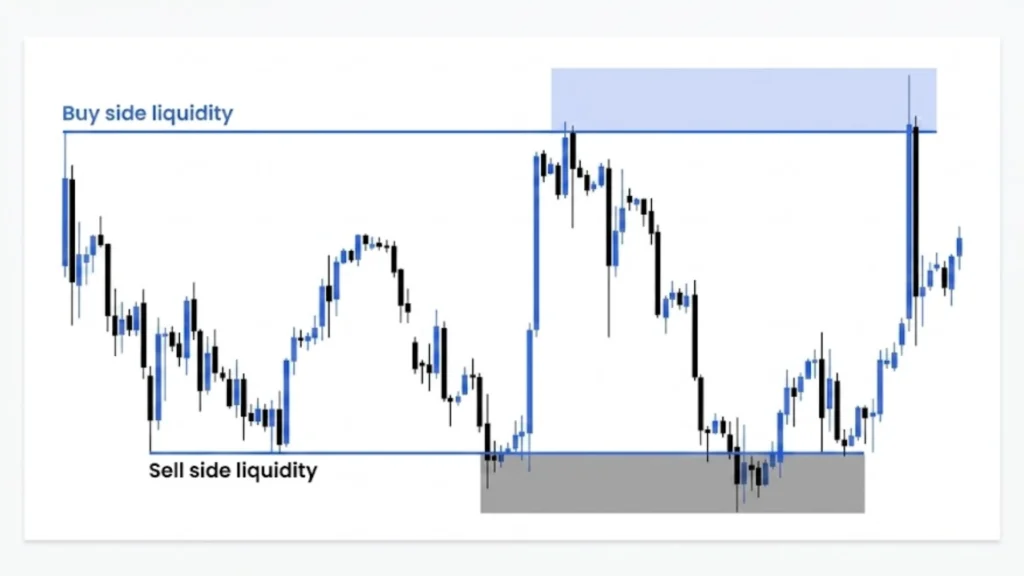
Liquidity (Buy-side & Sell-side)
Buy-side liquidity sits above recent highs — that’s where traders have placed their stop losses from short trades and pending buy orders. Sell-side liquidity sits below recent lows. Smart money targets these areas. Liquidity inducement trading is all about finding these pools.
Order Blocks (Basic Idea)
An order block is the last candle before a big move. Banks often leave their orders there. When price comes back to that area, it often reacts strongly. Inducement and order blocks work together — inducement often leads price back to an order block.
Supply and Demand Zones
Supply zones are areas where price dropped sharply from. Demand zones are areas where price rose sharply from. Inducement at support and resistance levels often happens near these zones to grab liquidity before the real move.
Types of Inducement in Forex
Support & Resistance Inducement (False Breakouts)
Price breaks above a well-known resistance level. Traders buy. Then price quickly falls back below and drops hard. This is a classic false breakout forex strategy trap. The break was only to collect buy orders above resistance.
Trendline Inducement
Price breaks below a trendline. Traders sell. Then price shoots up and never looks back. Trendline inducement forex happens when everyone is watching the same line — making it a perfect liquidity target.
Range / Consolidation Inducement
In a sideways market, price breaks one side of the range — grabs stops — then breaks the other side. Range inducement trading is very common in quiet market hours.
Premature Reversal Inducement
Price looks like it’s reversing. Traders enter the reversal early. Then price continues in the original direction first — hits their stops — and then actually reverses. Patience is the key here.
Session-Based Inducement (London/New York)
This happens at the start of major sessions. Session-based inducement traps early traders who jump in at the open before the real move is set.
Inducement vs Similar Concepts (Avoid Confusion)
Inducement vs Liquidity Grab
A liquidity grab is a quick spike to collect orders. Inducement is a more planned move that creates a “believable” setup to trap traders. Inducement vs liquidity grab — both are traps, but inducement is more deceptive and slower.
Inducement vs Pullback
A pullback is a normal, healthy retracement in a trend. Inducement vs pullback — a pullback moves with structure; inducement breaks structure briefly to trap traders before reversing.
Inducement vs Fake Breakout
These are very similar. The difference: inducement vs fake breakout — a fake breakout is the event, inducement is the reason behind it. Inducement is the strategy; the fake breakout is the tool.
How to Identify Inducement on Charts (Step-by-Step)
Here’s how to identify inducement in forex step by step:
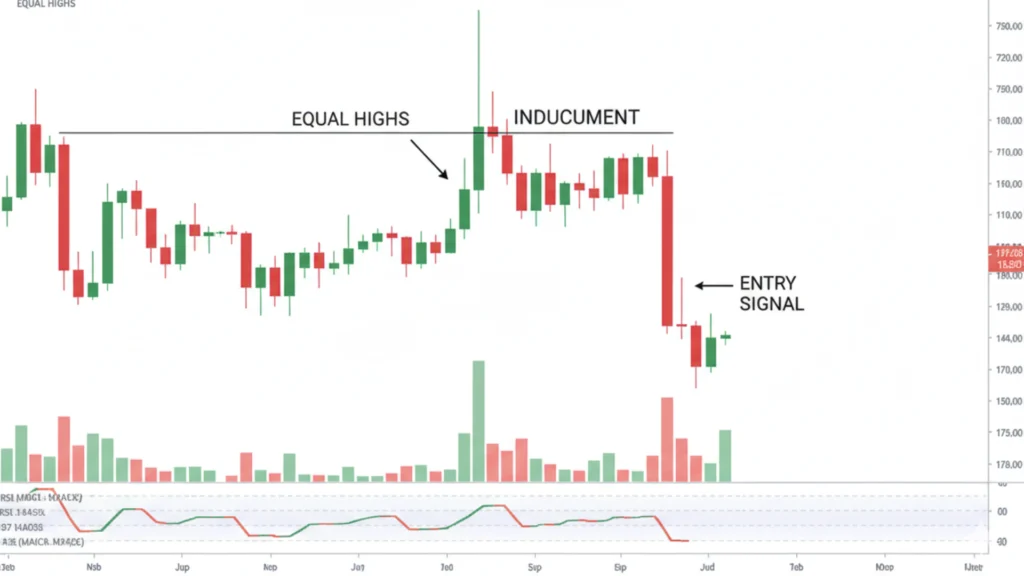
- Look for equal highs or equal lows — these are liquidity magnets
- Watch for a fake breakout above those levels
- Identify the liquidity zone that was just swept
- Wait for a structure shift — a candle closing back inside the range
- Look for confirmation like a strong rejection candle or order block reaction
How to trade inducement forex always starts with patience. Don’t enter during the trap move. Wait for the reversal confirmation.
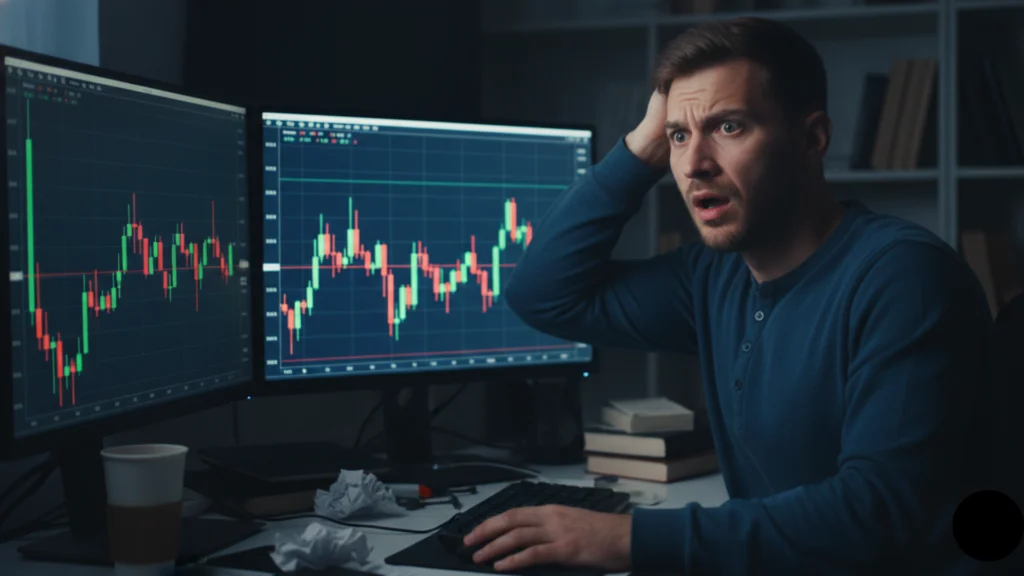
What Retail Traders Think vs What Smart Money Does
Retail traders think: “Price is breaking a level — this is a signal! I need to enter now!”
Smart money does: “Perfect. Retail traders are buying. Now we have the liquidity we need to sell our huge position.”
This simple mindset shift is everything. Stop loss hunting forex is not random — it’s planned. When you understand this, you stop being the prey and start trading with the big players.
Inducement Trading Strategy (Complete Setup)
Here’s a complete inducement trading setup:
- Step 1: Identify the trend on a higher timeframe
- Step 2: Mark buy-side and sell-side liquidity zones
- Step 3: Wait for an inducement move into that liquidity
- Step 4: Confirm with a break of structure in the opposite direction
- Step 5: Enter after confirmation candle closes
This is the core of the advanced inducement trading strategy. Simple but powerful when done with discipline.
Entry, Stop Loss, and Take Profit Rules
- Entry: After the confirmation candle closes — never before
- Stop loss: Place it above or below the liquidity zone that was swept (inducement risk management forex)
- Take profit: Target the next liquidity zone or swing high/low
- Risk-to-reward: Aim for minimum 1:2 — meaning risk $1 to make $2
Inducement entry and exit strategy is clean when you follow these rules strictly.
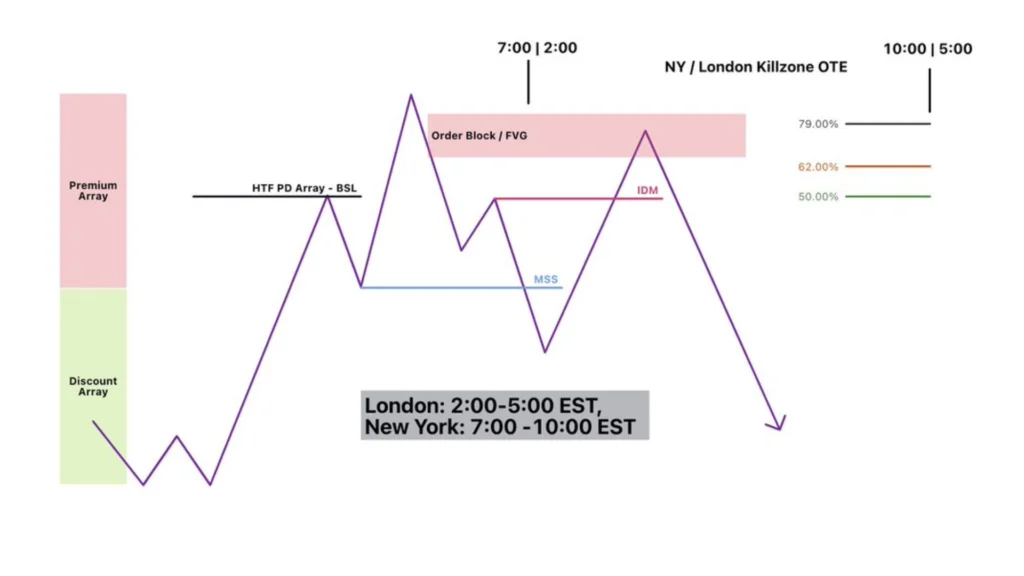
Best Timeframes for Inducement Trading
- Higher timeframe (H4 or Daily): Find the trend and liquidity zones
- Lower timeframe (H1 or M15): Look for the inducement and entry confirmation
Best timeframe for inducement trading example: Use H4 for direction, M15 for your entry. Multi timeframe inducement analysis gives you a clearer picture.
Best Forex Pairs for Inducement
Major pairs like EUR/USD and GBP/USD are the best for inducement trading because they have the highest liquidity. More liquidity means cleaner traps and faster reversals. Exotic pairs have irregular moves and are harder to read.
Best Trading Sessions for Inducement
- London Session: High volatility, lots of inducement setups at session open
- New York Session: Another wave of volatility, especially during the overlap with London
Low-volatility sessions like the Asian session often just build liquidity for the London and NY sessions to sweep. Volatility is what makes inducement work.
Real Example of Inducement (Story Format)
Here’s a real inducement trading example told as a story:
Price on EUR/USD created equal highs at 1.0900 over two days. Retail traders noticed and placed buy orders just above that level. On Tuesday morning, price pushed above 1.0900. Traders entered — excited about the breakout. Then suddenly, in just 30 minutes, price crashed back down and kept falling for 200 pips. Every single buy stop was hit. Smart money had collected all those buy orders and used them to sell their massive positions. Classic inducement in price action.
Failed Inducement (When It Doesn’t Work)
Sometimes what looks like inducement doesn’t reverse. This is called failed inducement.
Signs of failure:
- Weak rejection — price barely comes back after the sweep
- Multiple attempts to break the level — shows real buying pressure
- Fast reversal back above the swept level
Opportunity insight: Failed inducement often means the real breakout is coming. If price sweeps a level and comes back twice without reversing strongly — the trend might actually be continuing. Adapt and don’t force the trade.
Common Mistakes Traders Make
- Entering too early — jumping in during the trap instead of waiting for confirmation
- Ignoring confirmation — no structure break = no trade
- Overtrading — not every move is inducement
- Misunderstanding structure — confusing a real break of structure with an inducement move
How to Avoid Inducement Traps
- Wait for confirmation before entering any trade
- Don’t chase breakouts — if you missed it, let it go
- Focus on liquidity zones — know where stops are sitting
- Be patient — how to avoid inducement traps is mostly about doing nothing until the right moment
Forex liquidity traps are everywhere. Your job is to spot them — not fall into them.
Risk Management for Inducement Trading
- Risk only 1–2% per trade — protect your account
- Use proper lot size based on your stop loss distance
- Avoid revenge trading — if you got trapped, don’t immediately re-enter out of anger
Good risk management means you can survive many wrong trades and still grow your account over time.
Inducement Trading Checklist (Quick Guide)
Use this forex inducement checklist before every trade:
- ✅ Is there liquidity nearby? (equal highs/lows, stop clusters)
- ✅ Did price fake the breakout?
- ✅ Is the structure broken after the sweep?
- ✅ Do I have a confirmation candle or pattern?
- ✅ Is my risk-to-reward at least 1:2?
How to Practice Inducement (Beginner Guide)
Inducement forex for beginners starts with practice — not live trading.
- Use chart replay on TradingView to go back in time and practice
- Backtest past charts — mark every inducement you can find on historical data
- Mark setups daily — even when not trading, annotate your charts
The more you see it, the faster you’ll recognize it in real time.
When NOT to Trade Inducement
- During news events — price moves are unpredictable and driven by fundamentals
- In low volatility markets — no liquidity to grab means no clean inducement
- When structure is unclear — if you can’t read the chart clearly, don’t trade
Tips to Become Consistent in Inducement Trading
- Be patient — wait for the full setup, not just one piece of it
- Follow your rules strictly — emotion is your biggest enemy
- Focus on quality trades — 2 good trades a week beats 20 bad ones
Institutional trading strategies forex traders use are all about consistency and discipline over time.
Key Takeaways
- Inducement in forex is a planned trap to collect retail liquidity
- Smart money creates the trap; retail traders fall into it
- Always wait for structure confirmation before entering
- Use higher timeframes for direction and lower for entry
- Risk management is non-negotiable
- Practice on past charts before trading live
Frequently Asked Questoins And Answers
Question: What is inducement in forex?
Answer: Inducement in forex is when price moves in a false direction to trap traders, collect their stop losses, and then reverse the real way.
Question: How does inducement work?
Answer: Smart money pushes price into a liquidity zone, triggers retail stops, collects orders, and then moves price in the opposite direction.
Question: How to identify inducement?
Answer: Look for equal highs/lows, a false breakout above/below them, and then a sharp reversal with a break of structure.
Question: Inducement vs liquidity?
Answer: Liquidity is the pool of orders sitting in the market. Inducement is the act of moving price to collect that liquidity.
Question: Can beginners trade inducement?
Answer: Yes! Inducement forex for beginners is very learnable. Start with chart replay, keep it simple, and focus on one setup at a time.
Conclusion
Inducement in forex is one of the most powerful concepts in modern trading. Once you understand how smart money moves price to collect liquidity, you stop making the same mistakes over and over.
It takes time. It takes practice. But every chart you study and every setup you mark brings you closer to trading with confidence instead of confusion.
Be patient. Follow your checklist. Protect your capital. And remember — the goal isn’t to trade every move. It’s to trade the right ones.
Types of CRT Trading: Master Candlestick Range Theory
What is Candlestick Range Theory (CRT) in Trading?
Simple Meaning of CRT
CRT stands for Candlestick Range Theory. It is a way to read price movement using candles on a chart. Each candle tells a story. CRT helps you understand that story.
Think of a candle like a battleground. Buyers and sellers fight inside it. CRT shows you who won and what will happen next.
Why Traders Use It
Traders use CRT because it gives them a clear picture of what big players are doing. It helps them stop guessing and start trading with logic. When you understand types of CRT trading, you trade smarter, not harder.
How It Works in the Market
The market moves in a pattern. It collects orders, tricks small traders, and then moves in the real direction. CRT helps you see this pattern before it completes.
Understanding the Candlestick Range
What is a Candlestick Range
A candlestick range is simply the space between the highest and lowest price of a candle. Imagine a rubber band stretched between two points. That stretch is the range.
High, Low, Open, Close
Every candle has four parts. The open is where price started. The close is where it ended. The high is the highest point it reached. The low is the lowest point. These four parts are the heart of candlestick range strategy.
Why Range Is Important
The range tells you how much price moved. A big range means strong movement. A small range means the market is quiet. In CRT trading, small ranges often come before big moves.
Universal Truths Behind CRT Trading
Price Moves in Phases
Price never just goes straight up or down. It always moves in three phases — rest, trick, and move. This is the foundation of smart money trading concepts.
Market Is Controlled by Big Players
Banks and institutions control the market. They have billions of dollars. They push price to collect orders before moving in their planned direction. Small traders often get caught in this trap.
Why Manipulation Happens
Big players need liquidity. They push price into areas where stop losses sit. This triggers small traders and fills the big orders. After that, the real move begins. This is market manipulation trading strategy in action.
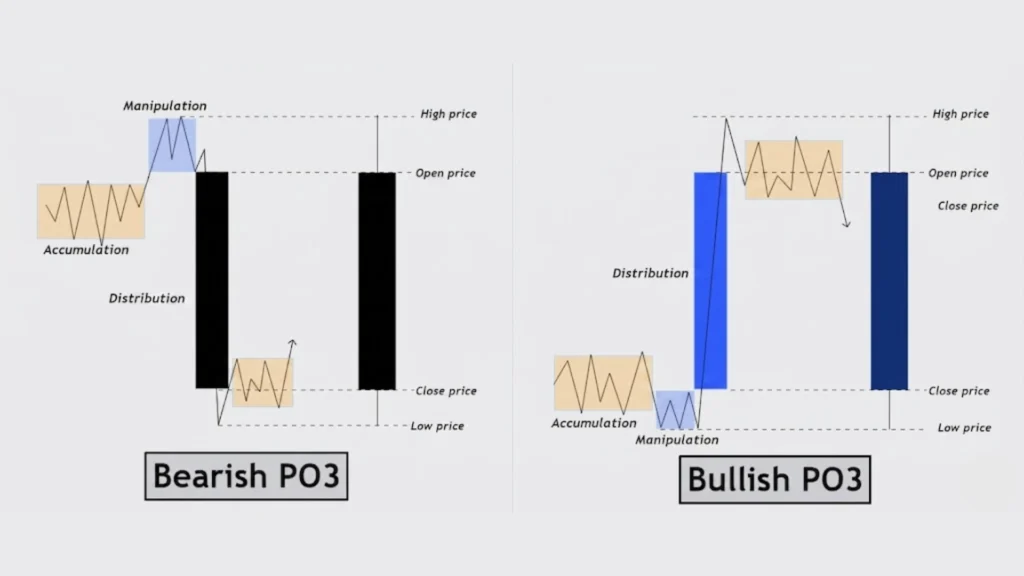
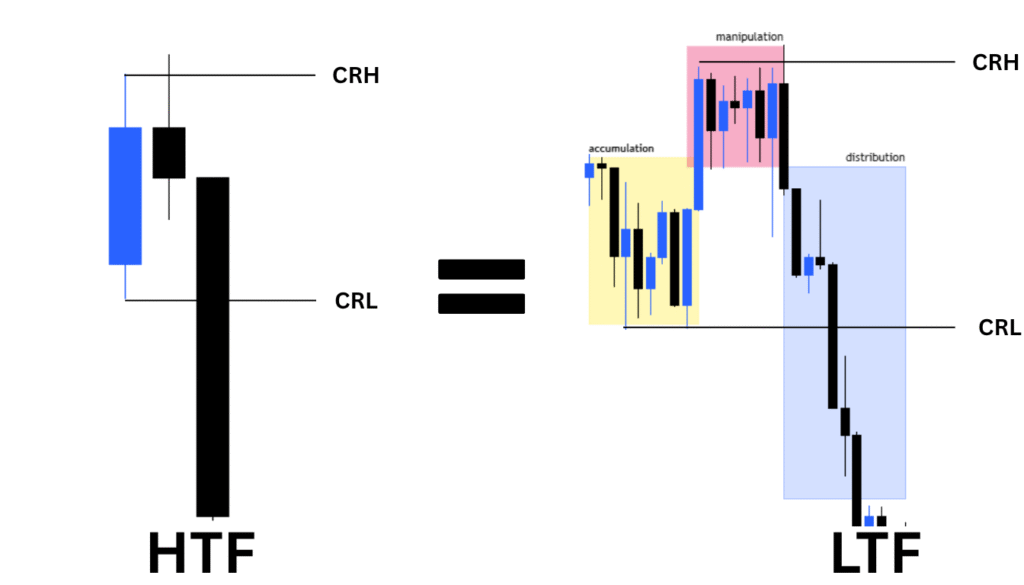
What is PO3 (Power of 3) in Trading?
PO3 means Power of 3. It describes the three phases every candle or price cycle goes through. Understanding PO3 is key to mastering types of CRT trading.
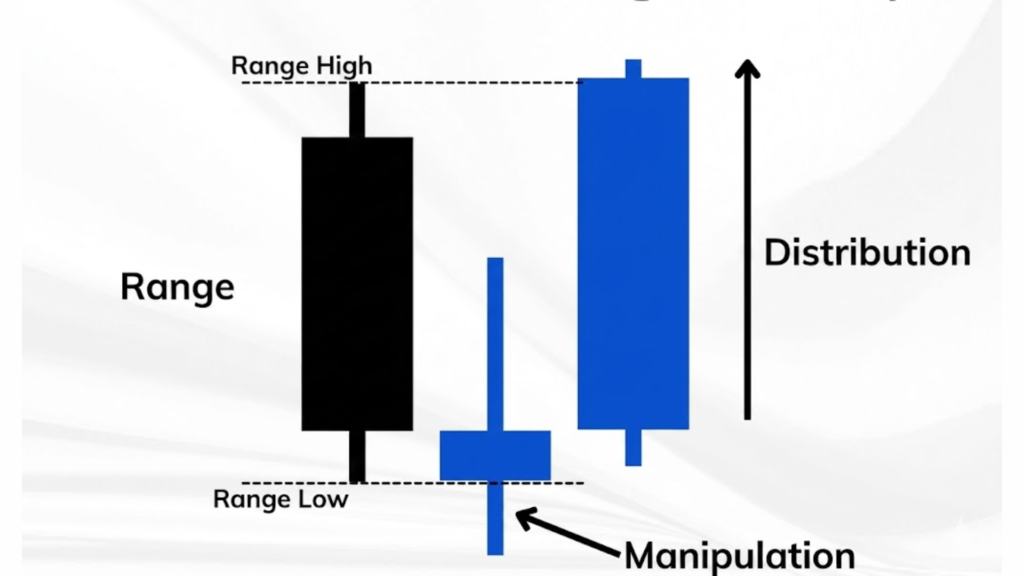
1. Accumulation Phase
This is the quiet phase. Price moves sideways. Big players are collecting their orders silently. Small candles form. Nothing seems to happen. But something big is building. In the forex accumulation phase explained simply — big money is loading up.
2. Manipulation Phase
This is the trick phase. Price suddenly moves in the wrong direction. It hits stop losses. Small traders panic and exit. This is the candlestick manipulation pattern at work. It looks like a breakout but it is fake.
3. Distribution Phase
This is the real move. After manipulation, price shoots in the true direction. Big players have their orders filled. Now they let price run. This is the distribution phase trading traders want to catch.
What is Candlestick Range Theory (CRT)?
How CRT Connects with PO3
CRT uses the PO3 idea but applies it to individual candles. Each candle has its own accumulation, manipulation, and distribution. This is how candlestick range theory trading works at the core.
Why CRT Is Powerful
CRT is powerful because it repeats on every timeframe. Whether you look at a 5-minute chart or a daily chart, the same pattern appears. This makes it one of the most reliable price action CRT strategies available.
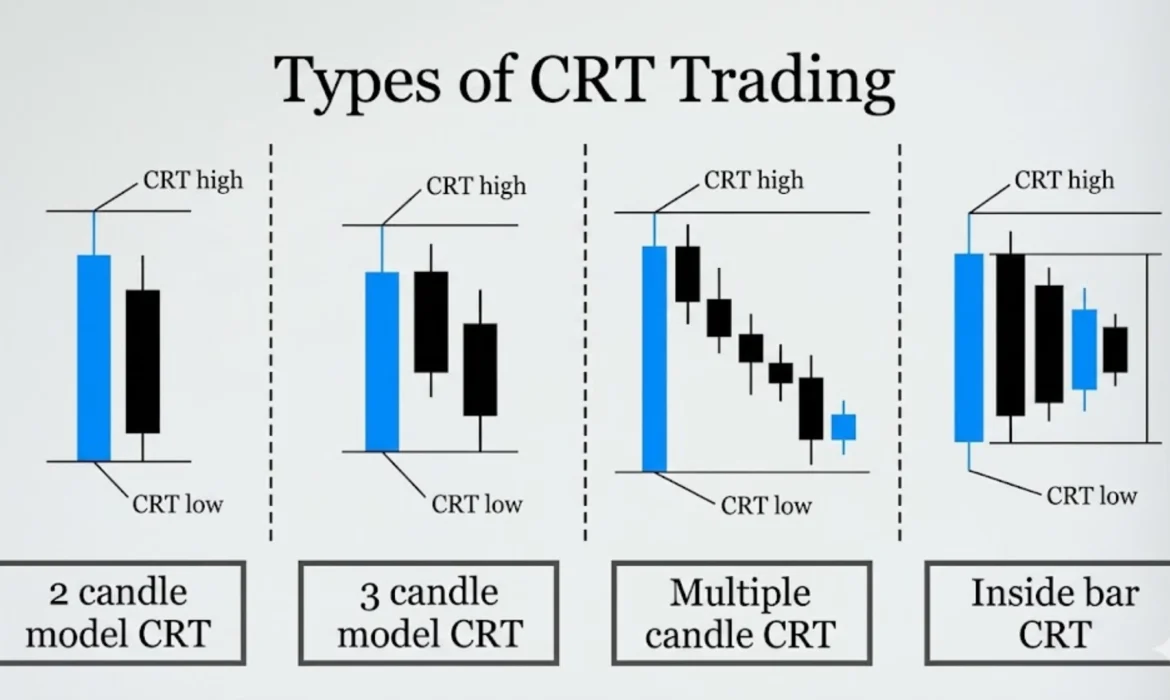
Types of CRT Trading
This is the most important section. Let us break down all the main types of CRT trading clearly.
1. Single Candle CRT
In this setup, one candle does everything. It shows accumulation at the open, manipulation at the wick, and distribution at the close. It is the most basic CRT trading pattern. Great for quick decisions. Single candle trading setup is perfect for fast markets.
2. Multi-Candle CRT
Here, multiple candles form the three phases together. For example, five small candles form accumulation. One big wick candle is manipulation. Then a strong move completes distribution. Multi candle trading strategy gives more time to confirm the trade.
3. Intraday CRT Trading
Intraday CRT trading means you open and close trades within the same day. You look at the 15-minute or 1-hour chart. You spot the phases within the daily session. This is great for traders who want quick results. The intraday CRT trading strategy is popular among active forex traders.
4. Swing CRT Trading
Swing CRT trading uses higher timeframes like the 4-hour or daily chart. Trades last for days or even weeks. This type suits traders who cannot watch screens all day. Swing trading CRT method gives bigger profit targets and more breathing room.
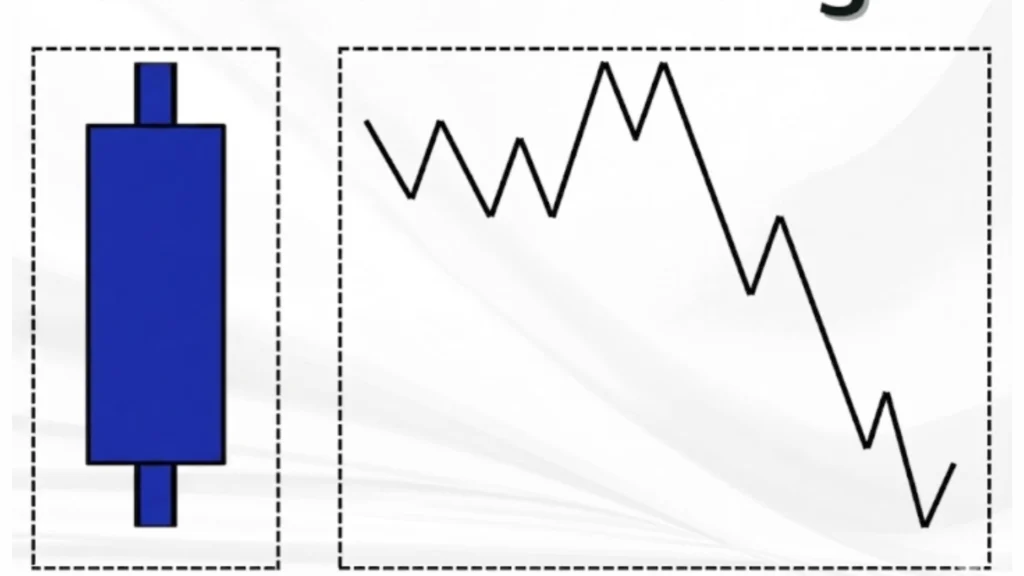
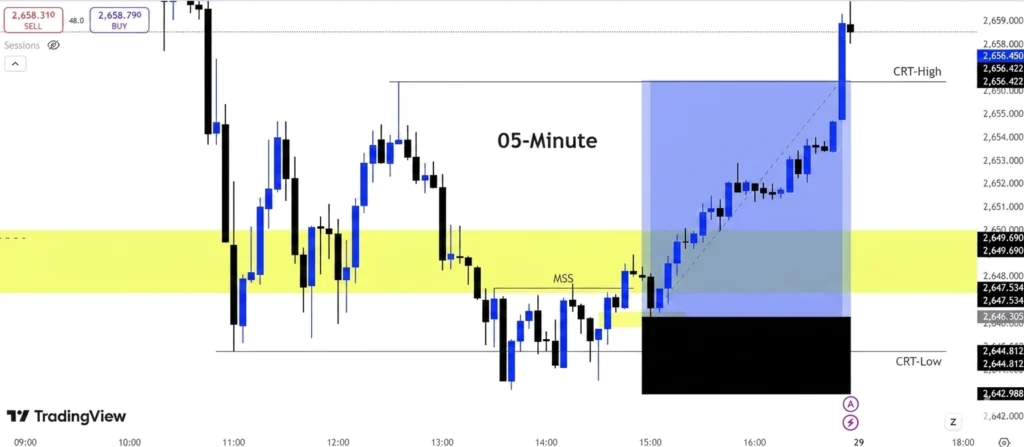
How CRT Looks on a Chart
Reading CRT on a real chart is simple once you know what to look for.
Small candles mean accumulation. Price is resting. Then one candle shoots up or down to grab liquidity. That is manipulation. After that, a strong clean candle forms and moves in the real direction. That is distribution. The whole structure is the power of 3 trading strategy in visual form.
Step-by-Step Example of CRT Trading
Step 1: Identify Accumulation
Look for a zone where price moves sideways with small candles. This means big players are loading orders.
Step 2: Wait for Manipulation
Watch for a sharp spike that breaks a recent high or low. This is the fake move. Do not trade it. Wait.
Step 3: Enter in Distribution
When price reverses from the manipulation spike and starts moving strongly, that is your entry. This is the highest probability zone in CRT trading examples.
Step 4: Exit Strategy
Place your target at the next liquidity zone or swing high/low. Use a clear CRT entry and exit strategy with defined levels before you enter.
How to Trade the Candlestick Range Theory
Entry rules are simple. Wait for manipulation to complete. Look for a strong reversal candle. Enter at the close of that candle.
Exit rules follow market structure. Target the next significant level. Use the previous high or low as a guide.
Confirmation signals include a Fair Value Gap, a strong rejection wick, or a close above the manipulation high in how to trade candlestick range theory correctly.
Best Timeframes for CRT Trading
1H vs 4H vs Daily
The 1-hour chart is great for intraday CRT trading. The 4-hour chart is best for swing CRT trading. The daily chart gives the clearest picture of phases.
Which One Is Best for Beginners
For beginners, the 4-hour chart is recommended. It gives enough time to think. It reduces noise. It makes CRT trading for beginners much easier to apply.
Risk Management in CRT Trading
Always use a stop loss. Place it just beyond the manipulation wick. This keeps your loss small if the trade fails.
Risk only 1% to 2% per trade. Never risk more. Protecting your capital is more important than any single trade. Good risk management is what separates winners from losers in advanced forex trading strategies.
Common Mistakes in CRT Trading
Entering too early is the biggest mistake. Wait for manipulation to fully complete. Jumping in during the manipulation phase leads to stop-outs.
Ignoring market structure is also dangerous. Always check the bigger picture before entering. Overtrading kills accounts. Take only the best setups.
CRT vs Normal Trading (Simple Comparison)
Normal trading reacts to price. CRT trading anticipates price. Normal traders see a breakout and buy. CRT traders see a breakout and wait for the fake-out.
CRT can be more effective because it follows how big players actually operate. It aligns you with smart money concepts forex instead of fighting it.
How CRT Connects with ICT Concepts
CRT and ICT trading strategy basics share the same roots. Both focus on liquidity and manipulation.
Fair Value Gap (FVG) often forms during the distribution phase. It acts as a magnet for price. Order blocks form during accumulation. They are strong support and resistance zones. Liquidity zones are where manipulation targets. Knowing these makes your CRT trading checklist stronger.
CRT Trading Checklist (Before You Enter a Trade)
Before entering, confirm the accumulation phase is clearly visible. Then confirm manipulation has completed with a strong wick. Check if price has returned inside the range. Set your stop loss beyond the wick. Set your target at the next liquidity level. This is your complete CRT trading checklist.
When NOT to Use CRT Trading
Do not trade CRT during high-impact news events. Price becomes unpredictable. Avoid sideways markets where no clear phases form. If market structure is unclear, skip the trade. Patience is a strategy too.
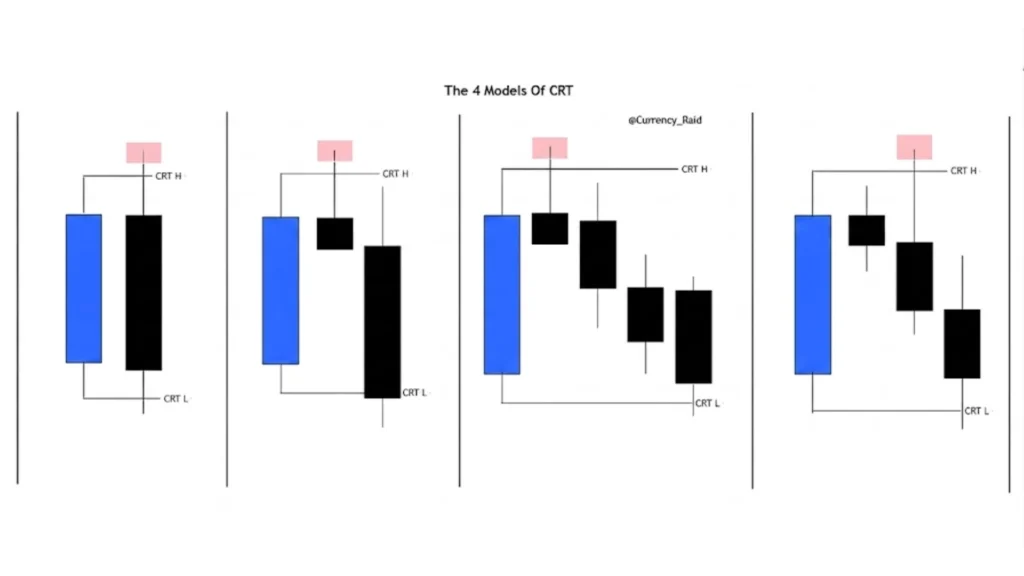
Types of CRT Candlestick Models
There are several CRT models used by traders. The basic single-candle model is the most common. The nested model uses a candle inside a larger candle’s range. The session model applies CRT to entire trading sessions like London or New York. Each model follows the same PO3 logic. Learning these forex CRT models adds depth to your trading.
Related ICT Concepts You Should Learn
ICT Hidden Order Block
A hidden order block is a small candle inside a larger move. It often acts as a strong reentry zone. It connects closely with accumulation in CRT.
ICT Fair Value Gap
A Fair Value Gap is a price imbalance on the chart. Price tends to return to fill it. In CRT, the FVG often forms during the distribution move.
ICT Reversal Patterns
These are specific candle formations that signal a change in direction. They often appear at the end of the manipulation phase in CRT.
ICT Suspension Block
A suspension block is a zone where price pauses before continuing. It is often found at the start of accumulation. Understanding ICT and CRT trading connection makes both concepts more powerful.
Frequently Asked Questions (FAQs)
Question: Is CRT trading good for beginners?
Answer: Yes. CRT trading for beginners is simple to learn. Start with the 4-hour chart and focus on spotting the three phases.
Question: Can I use CRT in crypto or gold?
Answer: Absolutely. CRT works on any liquid market including crypto, gold, indices, and CRT forex trading.
Question: How long does each phase last?
Answer: There is no fixed time. Accumulation can last hours or days. Manipulation is usually fast. Distribution depends on momentum.
The Bottom Line
CRT is one of the most logical trading strategies out there. It teaches you to think like big players. You stop reacting and start anticipating. The types of CRT trading — single candle, multi-candle, intraday, and swing — all follow the same three phases. Learn them well and your trading will transform.
Do You Want to Succeed in Trading?
Success in trading is not about luck. It is about learning, practicing, and being patient. CRT gives you a framework. But you must put in the screen time to master it.
Start with demo trading. Watch the phases form. Journal your trades. Learn from your mistakes. Forex market structure trading rewards those who study and stay consistent. The market will always be there. Your job is to keep improving every single day.

Best Time to Trade Forex: Guide to Sessions, Hours & Profits
What is Forex Trading? (Easy Explanation)
Forex trading is one of the biggest markets in the world. Millions of people trade currencies every single day. But before you start, you need to understand the basics.
What Does “Forex” Mean?
Forex stands for Foreign Exchange. It simply means buying and selling currencies. For example, you swap US dollars for euros. That’s forex! The forex market runs all day, five days a week.
How People Make Money in Forex
Traders make money by guessing which currency will go up or down. If you buy a currency cheap and sell it when the price rises, you profit. Simple as that.
Simple Example of Currency Exchange
Imagine you buy 1 euro for $1.10. Later, the euro rises to $1.15. You sell it and earn $0.05 profit. That small difference adds up fast in forex trading.

Why Timing is Important in Forex Trading
The best time to trade forex is not random. Timing can make or break your trades. Good timing means more money. Bad timing means more risk.
What Happens When the Market is Active
When the market is active, prices move fast. There is high liquidity, meaning many buyers and sellers are online. This is perfect for making quick profits.
What Happens When the Market is Slow
During slow hours, prices barely move. Spreads become wider, costing you more. This is one of the worst times to trade forex.
How Timing Affects Profit and Risk
Good timing reduces risk. If you trade during peak forex trading hours, your orders fill quickly. You get better prices and cleaner chart patterns.
Forex Market Hours (Beginner-Friendly Overview)
Understanding forex market open time and close time is your first step as a beginner.
What Time Does the Forex Market Open and Close?
The forex market opens on Monday morning in Sydney and closes Friday evening in New York. That covers almost the entire week. The forex trading schedule runs 24 hours during weekdays.
Why Forex Runs 24 Hours a Day
Forex runs 24 hours because different countries are awake at different times. When one market closes, another opens. This creates a never-ending trading cycle.
Major Forex Trading Sessions (Simple View)
There are four major sessions: Sydney, Tokyo, London, and New York. Each session has its own energy level and trading style. Knowing them helps you find the best forex trading sessions for your goals.

Understanding Forex Time Zones Made Easy
Forex trading time zones confuse many beginners. Let’s make it super simple.
What is a Time Zone? (Simple Explanation)
A time zone tells you what time it is in a specific part of the world. When it’s morning in London, it might be night in Tokyo.
How Forex Time Zones Work Around the World
Each forex session follows a different time zone. Use a forex market time converter to check the correct local time for each session. This saves a lot of confusion.
Easy Trick to Remember Trading Times
Think of a relay race. Sydney passes the baton to Tokyo. Tokyo passes it to London. London passes it to New York. Each runner takes over without stopping the race.
Best Forex Trading Sessions Explained
Knowing each session helps you pick the ideal time to trade currency pairs.
Sydney Session (Quiet Start)
Sydney session forex hours start the week. It’s the quietest session. Price moves are small. Good for beginners learning without too much risk.
Tokyo Session (Asian Market)
The Tokyo session forex trading period is slightly more active. Pairs like USD/JPY move well here. Asian news affects prices during this time.
London Session (Most Active)
The London session forex hours are the most active of the day. Almost 35% of all forex trades happen here. Volatility is high, spreads are tight, and opportunities are everywhere.
New York Session (High Volatility)
New York session forex time overlaps with London for a few hours. This overlap creates explosive price moves. It’s one of the most active forex trading hours of the day.

Best Time to Trade Forex During the Day
Most Active Hours of the Day
The most active forex trading hours are between 8 AM and 12 PM New York time. This is when London and New York sessions overlap. Volume is highest and prices move the most.
Best Time for High Volatility
If you love fast trades, trade during news releases or session overlaps. Forex market volatility times are perfect for scalpers and day traders.
Best Time for Stable Trading
If you prefer calm trading, choose the Sydney or early Tokyo session. Prices move slowly. Risk is lower. Great for beginners testing strategies.
Forex Market Overlaps (Most Profitable Times)
Forex session overlap times are the golden hours of trading. This is when two sessions are open at the same time.
London and New York Overlap
This is the most powerful overlap. It runs roughly from 1 PM to 5 PM GMT. High liquidity forex hours + high volatility = big opportunities. EUR/USD and GBP/USD shine here.
Tokyo and London Overlap
This overlap is shorter but still useful. It runs from 8 AM to 9 AM GMT. EUR/JPY pairs tend to move well during this window.
Why Overlaps Create Big Opportunities
When two major markets are open together, more traders are active. More traders mean more volume. More volume means better prices and faster order execution. This is when the best time to trade forex truly shines.

Best Time to Trade Forex Based on Your Location
Your location matters. Here’s how to find your personal best forex trading time.
Best Trading Time in Pakistan
The best time to trade forex in Pakistan is between 1 PM and 9 PM PKT. This covers the London session and part of the New York session — both highly active.
Best Trading Time in the UK
UK traders are lucky. The London session is local time for them. Morning hours between 8 AM and 12 PM GMT are peak hours for UK-based forex traders.
Best Trading Time in the USA
US traders should focus on the New York session. The window from 8 AM to 12 PM EST is ideal. The London-New York overlap during this time brings the highest trading volume.
Best Time to Trade Based on Trading Style
Your trading style decides when you should be in the market.
Scalping (Fast Trading)
Scalping best time forex is during peak hours — London or New York sessions. Prices must move fast. Tight spreads are essential. Overlaps are perfect for scalpers.
Day Trading (Same Day Trades)
Day trading forex best hours are during session overlaps. Open and close trades within one day. Stick to the busiest sessions for the cleanest setups.
Swing Trading (Longer Trades)
Swing trading forex timing is more flexible. You hold trades for days. You still enter during active sessions but don’t need to watch the screen all day.
Best Currency Pairs and Their Trading Times
EUR/USD Best Trading Time
The best time to trade EUR/USD is during the London-New York overlap. This pair has the highest volume and tightest spreads in the world.
USD/JPY Best Trading Time
The best time to trade USD/JPY is during the Tokyo session and early London session. Asian economic news directly affects this pair.
GBP/USD Best Trading Time
The best time to trade GBP/USD is during the London session. UK economic news and European data move this pair strongly.
Best Days of the Week to Trade Forex
Why Tuesday to Thursday Are Best
Tuesday, Wednesday, and Thursday are the best days to trade forex. Markets are fully active. Volatility is balanced. News is spread across the week evenly.
Why Monday Can Be Slow
Monday mornings are quiet. Markets are warming up. Traders are waiting for the week’s direction. Avoid rushing into trades early Monday.
Why Friday Can Be Risky
Friday afternoons are unpredictable. Many traders close positions before the weekend. This causes sudden price swings. Be extra careful on Fridays.
Best Months to Trade Forex
High Activity Months
January to April and September to November are the most active months. Markets are fully operating. Big banks and institutions are trading heavily.
Low Activity Months (Holiday Seasons)
December and August are slow. Many traders are on holiday. Liquidity drops. Spreads widen. This is often the worst time to trade forex for beginners.
How Seasons Affect Trading
Summer slows things down. Winter (especially December) brings holiday season. Spring and autumn bring the best trading conditions overall.
What Are the Worst Times to Trade Forex?
Low Liquidity Hours
Between 5 PM and 7 PM EST, both London and New York are closed. Tokyo hasn’t fully started. Liquidity drops sharply. Avoid trading during these dead hours.
Late Night Trading Risks
Night trading forex comes with risks. Low volume means price gaps and unpredictable moves. Beginners especially should avoid late-night sessions.
Weekend Market Closure
Forex market weekend hours are closed for retail traders. The market shuts Friday night and opens Sunday night. Never hold risky trades over the weekend.
How News Events Affect Forex Trading Time
What is Forex News?
Forex news includes economic reports like jobs data, inflation numbers, and interest rate decisions. These events move prices rapidly.
High Impact News Events
Events like US Non-Farm Payroll, Fed decisions, and CPI reports cause massive price spikes. These are key moments in the forex trading schedule every week.
Should Beginners Trade During News?
No. Beginners should avoid trading during high-impact news. Prices move too fast and too unpredictably. Wait for the dust to settle before entering.
Common Mistakes Beginners Make About Timing
Trading at Random Times
Many beginners open trades whenever they feel like it. This is dangerous. Always check which session is active before placing any trade.
Ignoring Market Sessions
Ignoring forex session times leads to trading in slow markets. Low volatility means your strategy won’t work properly.
Trading When Tired or Distracted
Tired trading leads to emotional decisions. Always trade when your mind is fresh and focused. This is one of the most important forex trading for beginners timing tips.
Step-by-Step: How to Choose Your Best Trading Time
Step 1: Pick Your Currency Pair
Start by selecting a pair you understand. EUR/USD is great for beginners. It’s the most liquid pair in the world.
Step 2: Check Active Market Session
Find out which session is most active for your pair. Use a forex market time converter if needed.
Step 3: Match With Your Daily Routine
Your trading time must fit your lifestyle. Don’t stay up all night if it drains your energy. Trade during hours that work for you.
Step 4: Avoid High-Risk Hours
Stay away from news events, Friday afternoons, and late-night dead zones. Stick to safe, active windows for consistent results.
Best Tools to Track Forex Market Time
Forex Time Zone Converters
Use tools like World Time Buddy or Forex Factory’s market clock. They show every session’s open and close time in your local time zone.
Trading Platforms
Platforms like MetaTrader 4 and MetaTrader 5 show market session indicators directly on your chart. They help you stay on track.
Mobile Apps for Forex Tracking
Apps like Investing.com and Forex Factory show live market hours, news calendars, and session overlaps. Perfect for traders on the go.
How Your Energy and Focus Affect Trading Time
Why Trading While Tired is Risky
Fatigue kills focus. You miss signals, make emotional decisions, and lose money. Never trade when you’re sleepy or stressed.
Best Time to Trade When Your Mind is Fresh
Most people are sharpest in the morning. If the London or New York session aligns with your morning, that’s your best time of day to trade forex.
Building a Healthy Trading Routine
Sleep well. Eat before trading. Set a fixed schedule. Treat forex like a real job. Discipline in timing leads to better results over time.
Safe Trading Tips for Different Times of Day
Morning Trading Tips
Check the economic calendar first. Identify key news for the day. Trade during the active London session for best results.
Afternoon Trading Tips
This is the London-New York overlap — the most powerful forex market overlap time. Use your best strategy here. Stay focused and disciplined.
Night Trading Tips
Avoid night trading unless you’re experienced. If you must trade, use tight stop losses and reduce your position size significantly.
Simple Daily Forex Trading Schedule (Example)
Example Routine for Beginners
- 7:30 AM GMT — Review charts and check news calendar
- 8:00 AM GMT — London session opens, look for setups
- 1:00 PM GMT — London-New York overlap begins, enter best trades
- 5:00 PM GMT — Close all trades or set stop losses
- Evening — Review the day, journal your trades
When to Analyze the Market
Always analyze before the session opens. Don’t analyze and trade at the same time. Pre-planning leads to cleaner decisions.
When to Enter Trades
Enter trades after confirmation — not before. Wait for the market to show clear direction. Patience at the right time is the real edge in forex.
Mini Case Study: Choosing the Best Time to Trade
Example of a Beginner Trader
Ahmed started trading forex without knowing about sessions. He traded late at night when the market was dead. He lost money consistently.
Mistakes Made and Lessons Learned
Ahmed was trading during low liquidity hours. His spreads were wide, and prices barely moved. After learning about the London session, he switched his trading window.
Final Outcome
Ahmed now trades EUR/USD during the London-New York overlap. His win rate improved. He trades less but earns more. Timing made all the difference.
Quick Summary: Best Time to Trade Forex
Most Active Hours
8 AM to 12 PM EST (London-New York overlap) is the most active and profitable window for most traders.
Best Sessions
London session is the most active. New York session adds high volatility. Together, they form the golden window for the best time to trade forex.
Key Takeaways
Know your session. Match your pair. Avoid dead hours. Trade fresh and focused. Use tools to track time zones. Timing is everything in forex.
Frequently Asked Questions (FAQ)
Question: What is the best time to trade forex for beginners?
Answer: The best time is during the London session, between 8 AM and 12 PM GMT. It’s the most active and offers tight spreads and clear price movements.
Question: What is the most profitable time to trade forex?
Answer: The London-New York overlap (1 PM to 5 PM GMT) is the most profitable. High liquidity forex hours and strong volatility create the best trading conditions.
Question: Is it good to trade forex at night?
Answer: Generally, no. Night trading forex is risky for beginners. Liquidity is low, spreads widen, and price movements become unpredictable.
Question: What is the hardest month to trade forex?
Answer: December is the hardest month. Holiday seasons reduce trading volume significantly. Many professional traders take a break during this period
Final Checklist Before You Start Trading
✔ Check Market Session
Always confirm which session is currently active before placing any trade. Use a forex session times chart or app.
✔ Choose Active Currency Pair
Pick a pair that is known to be active during your chosen session. EUR/USD during London. USD/JPY during Tokyo.
✔ Avoid Low Liquidity Times
Stay away from dead zones — late nights, early Monday mornings, and Friday afternoons. These are the worst time to trade forex.
✔ Stay Focused and Alert
Only trade when you’re fully awake and focused. A clear mind leads to better decisions and safer trades every single time.
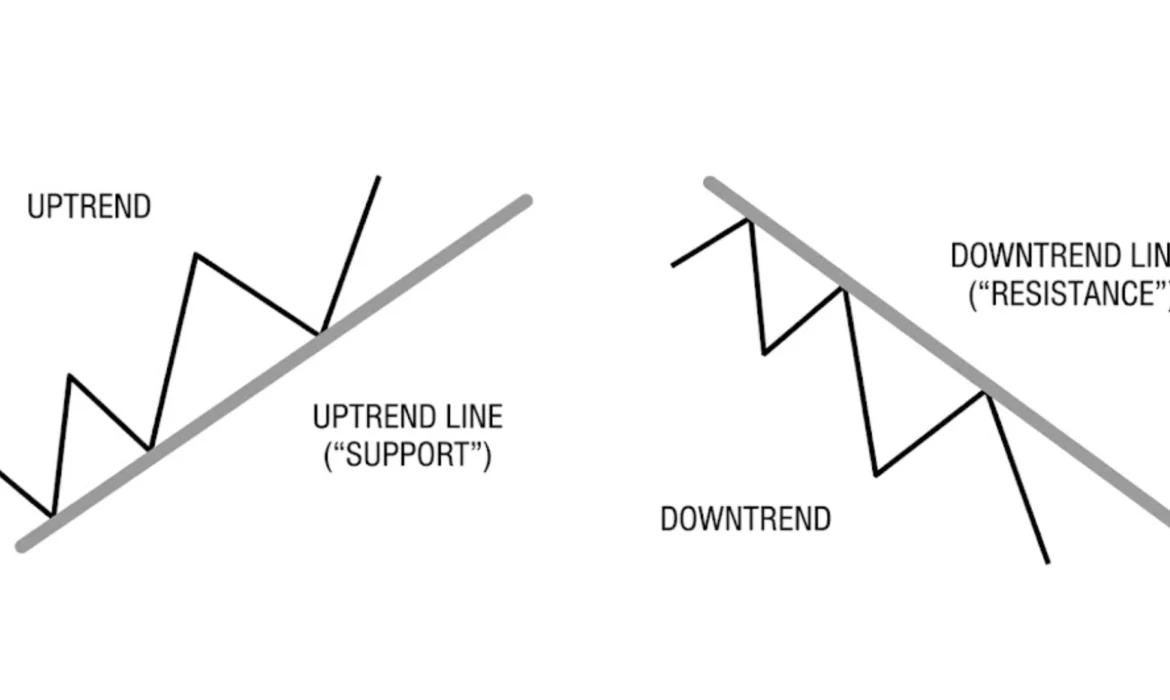
Trendline in Forex Trading: A Beginner’s Simple Guide
What is Forex Trading?
Simple Explanation of the Forex Market
Forex means “foreign exchange.” It is the biggest financial market in the world. People buy and sell currencies here — like US dollars, euros, or British pounds. This market runs 24 hours a day, five days a week.
Think of it like a shop. But instead of buying clothes or food, you are buying money from one country and selling money from another.
How People Make Money in Forex
Traders make money by guessing which currency will go up or down. If you think the euro will become stronger than the dollar, you buy euros. When the price goes up, you sell and make a profit. Simple, right?

What is a Trendline in Forex Trading?
Easy Definition
A trendline in forex trading is a straight line drawn on a price chart. It connects important price points — like peaks or valleys. It shows traders where the price is going.
Why Traders Use Trendlines
Traders love to use of trendlines because they are simple and powerful. They help you see the market direction at a glance. No complicated math needed.
How Trendlines Show Price Direction
When a line goes up, the market is going up. When it goes down, the market is falling. The trendline in forex acts like a guide for the price movement.
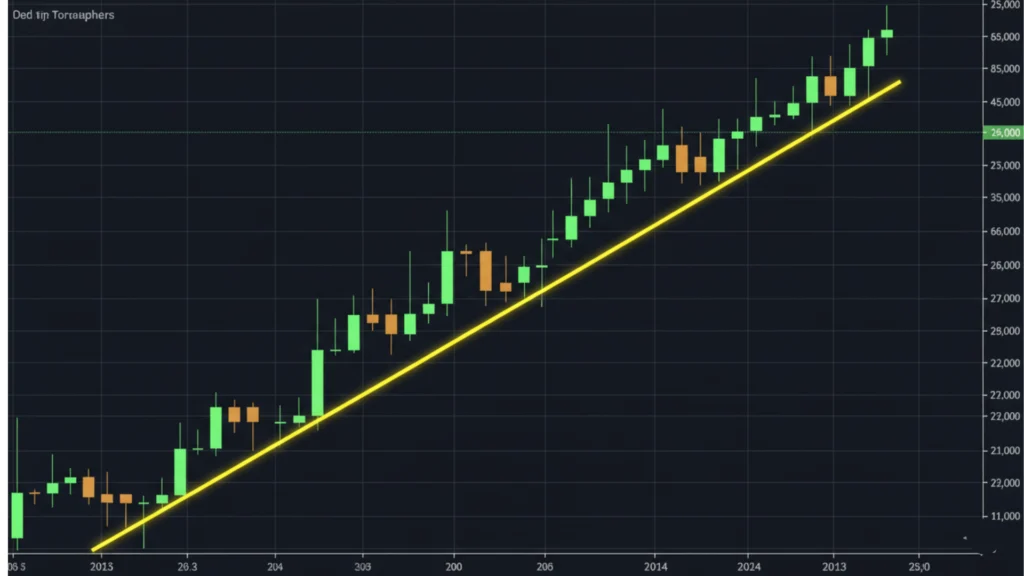
Trendlines Explained in a Simple Way
Imagine you are walking up a hill. Each step you take is a little higher than the last. If someone draws a line under your footsteps, that line goes upward. That is an uptrend line.
Now imagine walking down the hill. Each step is lower. The line goes downward. That is a downtrend.
Price in forex moves the same way. It goes up in steps, or down in steps. The trendline connects those steps so you can see the pattern clearly.

Why Trendlines Are Important for Traders
Trendlines are one of the most popular tools in forex technical analysis. Here is why traders cannot live without them.
Helps Find Buying and Selling Points: When price touches the trendline, that is a signal. Traders know it is time to buy or sell.
Makes Trading Decisions Easier: Instead of guessing randomly, you follow the line. This keeps your thinking clean and simple.
Reduces Confusion: New traders often feel lost looking at messy charts. A trendline cuts through the noise and shows what really matters — the trend direction.
Types of Trendlines in Forex Trading
Uptrend Line (Bullish Trend)
An uptrend line is drawn by connecting higher lows. Each low point is higher than the one before it. This means buyers are strong. Price is going up.
When price comes back down and touches this line, it is often a buying opportunity. This is where smart traders enter the market and ride the trend upward.
Downtrend Line (Bearish Trend)
A downtrend line connects lower highs. Each high is lower than the last. Sellers are in control here. Price is falling.
When price goes up and touches this line, it is often a selling opportunity. This is key to trendline trading forex — you sell at the line and profit as price falls.
Sideways Trend (Range Market)
Sometimes price does not go up or down clearly. It moves sideways — bouncing between a top level and a bottom level. This is called a range market.
Here, trendline support level acts as the floor and trendline resistance level acts as the ceiling. Traders buy at the bottom and sell at the top.
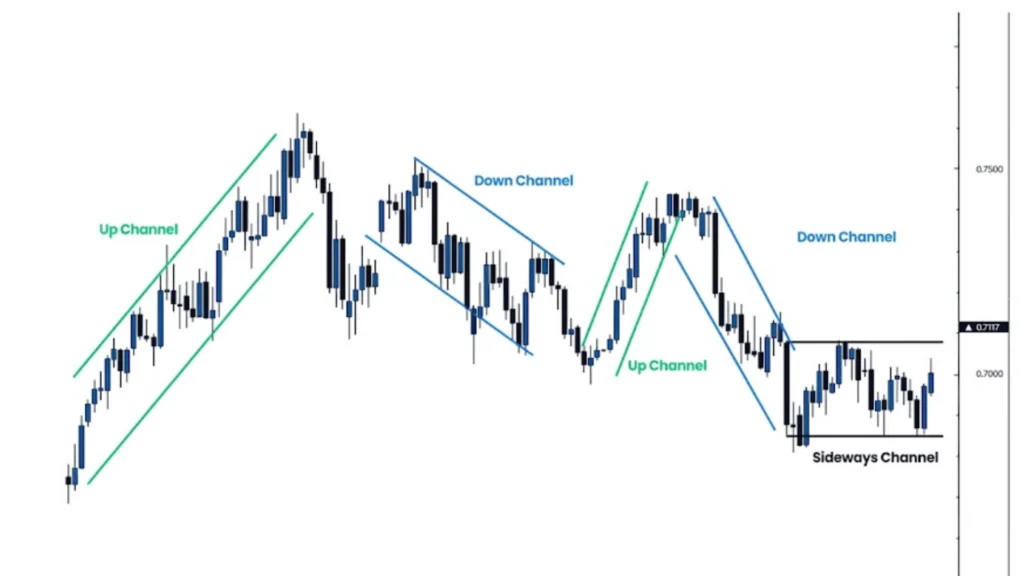
Understanding Support and Resistance with Trendlines
A trendline can act like a floor. Price keeps bouncing off it from above. This is called trendline support. Buyers step in here and push price back up.
A trendline can also act like a roof. Price keeps hitting it from below and falling back. This is called trendline resistance. Sellers take control here.
When you combine support and resistance trendline analysis, you get a clear map of where price might stop or reverse. This is the heart of forex trendline analysis.
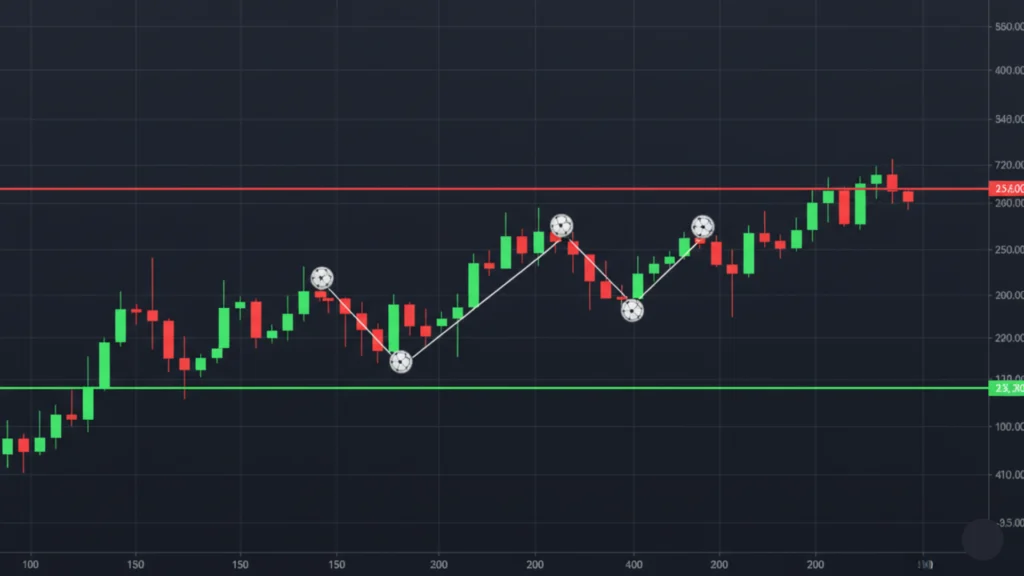
How to Draw Trendlines Step-by-Step
Step 1: Choose the Right Timeframe
Start with a clear timeframe. Beginners should use the daily or 4-hour chart. These are slower and easier to read. Short timeframes have too much noise.
Step 2: Find Highs and Lows
Look for the clear peaks (highs) and valleys (lows) on the chart. These are your anchor points. Mark them clearly.
Step 3: Draw the Trendline
Connect at least two clear lows for an uptrend. Connect at least two clear highs for a downtrend. Use your charting tool and draw the line through these points.
Step 4: Extend the Line
Extend the line forward into the future. This helps you see where price might react next.
Step 5: Check if It Fits Properly
A valid trendline should not cut through too many candles. It should sit neatly along the price. If it looks forced, start over.
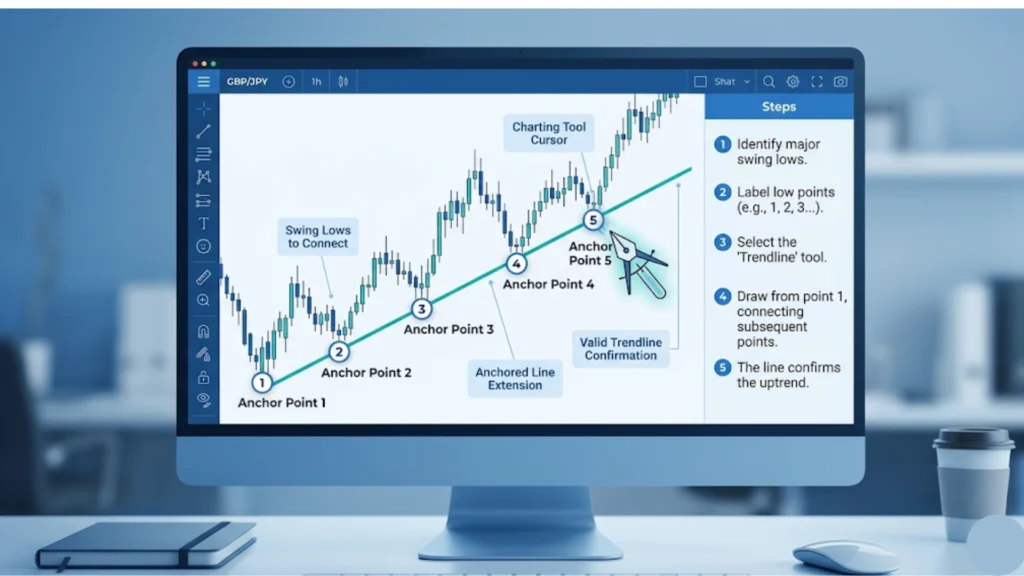
How to Identify a Strong Trendline
Not all trendlines are equal. A strong trendline has these qualities:
Multiple Touches: The best trendlines are touched three or more times. More touches mean the line is stronger and more reliable.
Clean Price Reaction: Each time price touches the line, it bounces clearly. This shows traders respect the level.
Proper Angle: A trendline that is too steep or too flat is weak. A medium angle is the healthiest sign of trendline strength in forex.
Not Forced: A good trendline fits naturally. You should not have to twist it to make it fit.
Good vs Bad Trendlines (Common Drawing Mistakes)
Many beginners make mistakes when drawing trendlines. Here are the most common ones:
Forcing Lines: Drawing a line that does not fit the price naturally. If you have to bend the rules to make it work, it probably does not work.
Ignoring Key Points: Skipping important highs or lows. Every anchor point matters when drawing trendlines correctly.
Drawing Too Many Lines: Having fifteen lines on one chart is confusing. Keep it simple. Two or three clean trendlines are better than a messy chart full of lines.
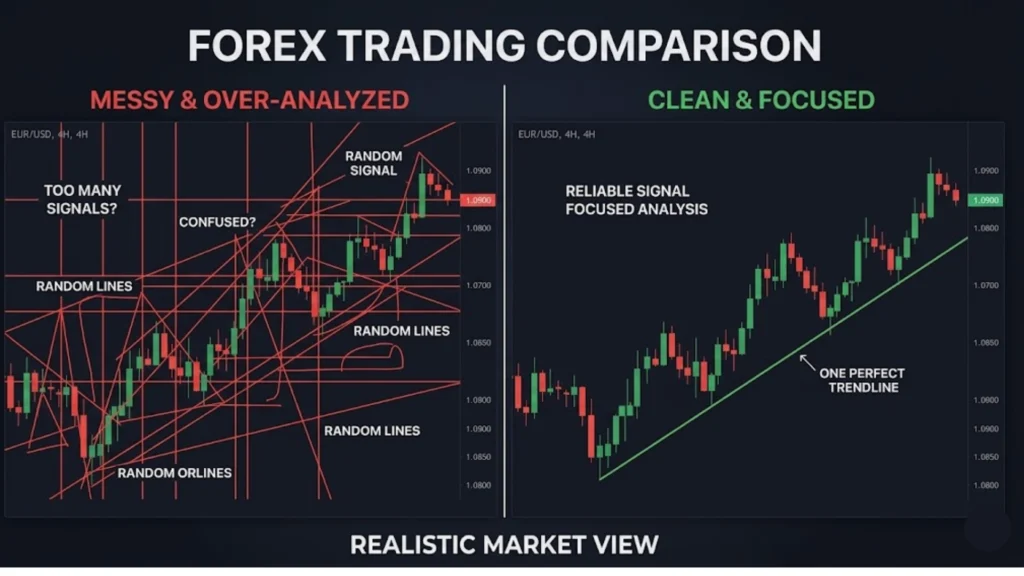
Best Timeframes for Trendline Trading
Short Timeframe (Fast Trades): The 15-minute or 1-hour charts are for day traders. Price moves fast, but signals can be noisy.
Long Timeframe (Safer Trades): The daily or weekly charts are slower. The signals are fewer but much stronger. Great for beginners.
Multi-Timeframe Approach: The smartest traders use multi timeframe trendline analysis. They check the big picture on the daily chart, then zoom in to the 1-hour chart for a precise entry. This gives both safety and accuracy.
Trendline Trading Strategies
Trendline Bounce Strategy
This is the most popular forex trendline strategy. When price comes back to the trendline and bounces off it, you trade in that direction.
Buy when price bounces off an uptrend line (support). Sell when price bounces off a downtrend line (resistance). This is the core of the trendline bounce strategy.
Trendline Breakout Strategy
Sometimes price breaks through the trendline instead of bouncing. This is called a trendline breakout forex signal.
Do not rush in right away. Wait for trendline breakout confirmation — the price closes clearly beyond the line and retests it. Only then enter the trade.
Trading with the Trend
Always try to trade in the direction of the main trend. If the big trend is up, only look for buying setups. This simple rule saves many trades from going wrong.
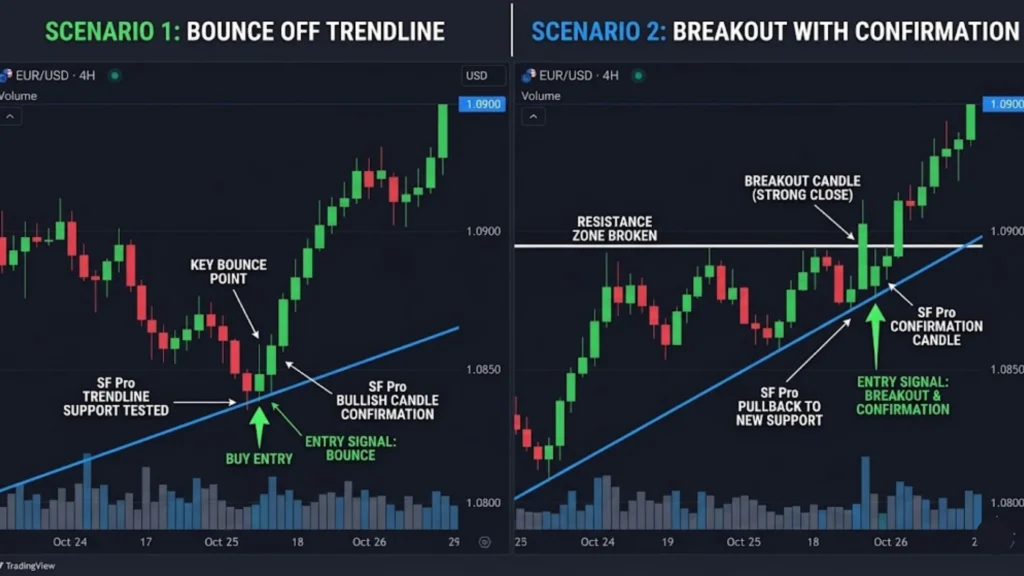
What Happens When a Trendline Breaks?
A trendline breakout means price has moved through the line with force. This often signals a trend change or a strong new move.
But be careful. Fake breakouts happen often. Price pokes through the line, tricks traders into entering, then snaps back. Always wait for trendline confirmation signals before trading a breakout.
The best confirmation is a candle that closes beyond the trendline and then retests it as a new support or resistance.
Using Indicators with Trendlines
Moving Average (MA)
A moving average shows the average price over time. When price is above the MA and on a trendline bounce, it confirms a buy setup strongly.
Relative Strength Index (RSI)
RSI tells you if the market is overbought or oversold. When price is at the trendline and RSI shows oversold, it is a strong buy signal.
MACD
MACD shows momentum. A bullish MACD cross near a trendline support is a powerful combined signal.
Bollinger Bands
Bollinger Bands show price volatility. When price touches the trendline and the lower Bollinger Band together, it often signals a sharp reversal.
These indicators support trendlines and help filter weak signals from strong ones.
Risk Management in Trendline Trading
What is Stop Loss: A stop loss is an order that closes your trade automatically if price moves against you. It protects your money.
Where to Place Stop Loss: For a bounce trade, place the stop loss just below the trendline. For a breakout trade, place it just above the old trendline. Trendline stop loss placement should always be logical — not random.
Risk vs Reward: Never risk more than you can afford to lose. A good trade setup should offer at least a 1:2 risk to reward ratio. This means if you risk $50, you should aim to gain $100.
Simple Checklist Before Taking a Trade
Before you click buy or sell, go through this quick checklist:
- Is the trend clear on a higher timeframe?
- Is the trendline valid with at least two to three touches?
- Is price reacting to the trendline right now?
- Is my stop loss placed correctly?
- Is my risk managed properly?
If you answer yes to all five, the trade is worth taking.
Why Trendlines Sometimes Fail
Trendlines are great, but they are not perfect. Here is why they sometimes fail:
Market News: Big news events — like interest rate decisions — can blow through any trendline in seconds.
Fake Signals: Sometimes price touches the trendline but does not bounce. Weak trendlines give false signals more often.
Weak Trendlines: A trendline with only two touches is fragile. Respect it less than one with five touches.
Common Mistakes Beginners Make
- Entering Too Early: Waiting for a confirmed candle close is important. Jumping in too fast leads to losses.
- Ignoring Higher Timeframe: Always check the big picture first.
- No Stop Loss: Trading without a stop loss is like driving without a seatbelt. Always protect yourself.
- Overtrading: Taking too many trades is a classic mistake. Quality over quantity always wins.
Trading Psychology in Trendline Trading
Patience: The best setups take time to form. Wait for price to come to your trendline, not the other way around.
Avoiding Fear and Greed: Fear makes you exit too early. Greed makes you stay too long. Stick to your plan and let the trade play out.
Following Rules: Have a trendline trading system and follow it every single time. Consistency is what separates winning traders from losing ones.
Tools and Platforms for Drawing Trendlines
TradingView: The most popular online charting tool. Clean, easy, and free. Perfect for drawing trendlines in forex.
MT4 / MT5: The most widely used forex trading platforms. Both have built-in trendline tools that are simple to use.
Charting Tools: Most broker platforms also offer basic charting. Always practice on one platform and get comfortable with its tools.
How to Practice Trendline Trading Safely
Demo Accounts: Open a demo account with any broker. Trade with fake money first. This is the safest way to learn.
Backtesting: Look at old charts and practice drawing trendlines on past data. See how price reacted. This builds your eye for good setups.
Practice Before Real Trading: Never risk real money until you are consistently profitable on demo. This step saves beginners from painful losses.
Advantages and Disadvantages of Trendline Trading
Advantages
- Simple to Use: No complex formulas. Just draw a line and follow it.
- Works in All Markets: Forex, stocks, crypto — trendlines work everywhere.
- Great for Beginners: It is one of the best simple forex trading strategies for those just starting out.
Disadvantages
- Can Give False Signals: Not every trendline bounce leads to a big move.
- Needs Practice: Drawing trendlines correctly takes time. Everyone makes mistakes at first.
Trendlines vs Channels (Simple Comparison)
A channel is two parallel trendlines — one above and one below price. The upper line is resistance and the lower line is support.
A single trendline shows direction. A channel shows the full range of price movement. Channels are like trendlines with boundaries. They are more advanced but built on the same idea.
Trendlines in Forex vs Stocks
Similarities: In both markets, trendlines work the same way. You connect highs and lows, watch for bounces or breakouts, and manage your risk.
Key Differences: Forex markets run 24 hours. Stock markets have fixed hours. This means forex charts can have gaps less often. Also, forex price action trendline trading is more influenced by global economic events compared to individual company news in stocks.
Frequently Asked Questions (FAQs)
Question: Can Beginners Use Trendlines?
Answer: Yes, absolutely. Trendlines are one of the best tools for forex trading for beginners. They are visual, simple, and effective.
Question: How Many Touches Make a Valid Trendline?
Answer: At least two touches are needed to draw a trendline. But three or more touches make it much stronger and more reliable.
Question: Are Trendlines Always Accurate?
Answer: No. No tool is 100% accurate in trading. Trendlines are helpful guides, not guarantees. Always use risk management alongside them.
Question: Which Timeframe is Best?
Answer: The daily and 4-hour charts are the most reliable for trendline trading. Beginners should start there.
Can I Trade Only with Trendlines?
Answer: Yes, many traders do. A clean forex trendline strategy with good risk management can be a complete trading system on its own.
Final Summary: How to Use Trendlines Successfully
Trendline in forex trading is a powerful and simple tool. It helps you see the market direction, find the best entry and exit points, and manage your trades with confidence.
Here is a quick recap of the key lessons:
Draw trendlines on clear highs and lows. Look for at least three touches. Trade the bounce or the breakout — but always wait for confirmation. Use a stop loss on every trade. Practice on a demo account first.
The biggest secret? Keep it simple. The best trendline trading tips always come back to one idea — follow the trend, respect the line, and protect your money.
Start small, be patient, and trust the process. Trendlines have helped millions of traders succeed — and they can help you too.
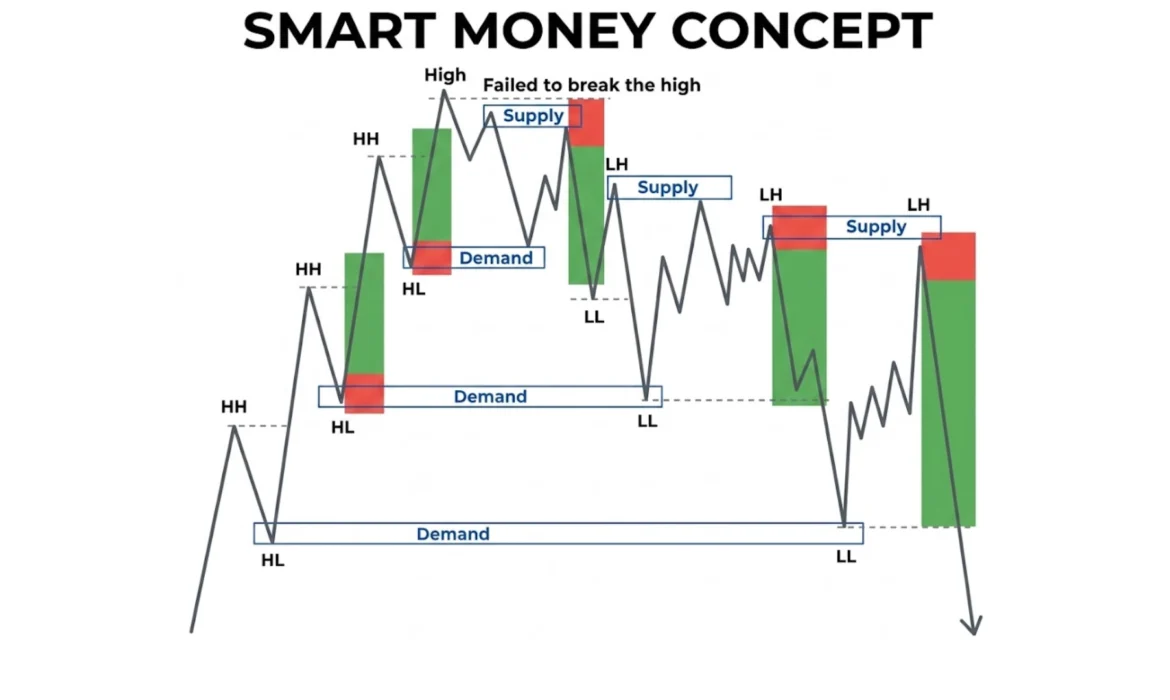
Smart Money Concepts: How to Trade Like Smart Money
Introduction to Smart Money Concepts
What Are Smart Money Concepts?
Smart money concepts are a way of reading the market the same way big banks and institutions do. Instead of using fancy indicators, you learn to read price movement directly. You follow the footprints of the big players. This method helps you understand why the market moves, not just how it moves.
What Does “Smart Money” Mean?
Smart money refers to large financial institutions, hedge funds, central banks, and professional traders. These players have billions of dollars. They move markets with their trades. Retail traders like you and me are the “dumb money” — not because we’re silly, but because we don’t have the same tools or information. Smart money trading means learning to think like these big players.
Why Smart Money Concepts Are Popular
Smart money concepts are popular because they actually explain market manipulation. They show why price does fake moves before going in the real direction. More and more traders are ditching old indicators and learning SMC. It works in forex, crypto, and stocks — making it one of the most flexible trading strategies today.
Smart Money Concepts Explained for Beginners
SMC in Simple Words (Easy Explanation)
Think of the market like a big game. Big banks need lots of buyers and sellers before they can fill their huge orders. So they push the price to areas where retail traders have placed stops. Then they go in the opposite direction. Smart money concepts teach you to spot these traps and trade with the big players instead of against them.
How Big Traders Move the Market
Big institutions can’t just buy or sell all at once. They need to spread out their orders. So they create fake breakouts to collect liquidity. They push price up to grab stop losses from short sellers. Then they sell. This is called a liquidity grab, and it’s a key part of institutional trading strategy.
Why Most Retail Traders Lose Money
Most retail traders follow indicators like RSI or MACD. These tools lag behind price. When a retail trader sees a signal, smart money has already moved. Smart money vs retail traders is an unfair game — unless you know the rules. Smart Money Concepts teaches you those rules.

How the Market Works (Simple Basics)
Market Structure (Uptrend and Downtrend)
The market moves in waves. In an uptrend, price makes higher highs and higher lows. In a downtrend, it makes lower lows and lower highs. This is called smart money market structure. Understanding this helps you know which direction the big money is pushing price.
Who Controls the Market?
Banks and institutions control the market. They decide where price goes. They have access to huge amounts of data and capital. Retail traders react to price. Smart money creates price. This is the key difference.
What Is Liquidity in Trading?
Liquidity in trading means areas where lots of buy or sell orders are sitting. These are usually above recent highs or below recent lows. Smart money goes to these areas to fill their orders. Once they collect that liquidity, price reverses sharply.
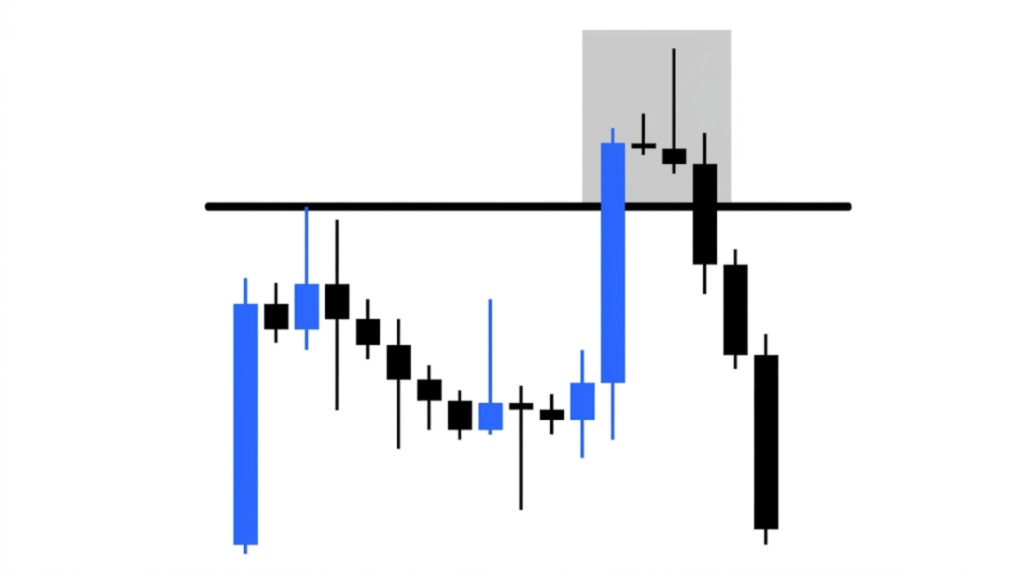
Core Smart Money Concepts (Easy Guide)
Market Structure Basics
Higher Highs and Lower Lows
In an uptrend, each new high is above the last. Each new low is also above the previous low. This pattern tells you buyers are in control. In a downtrend, the opposite happens. Spotting this helps you trade in the right direction.
Break of Structure (BOS)
A break of structure trading signal happens when price breaks beyond a previous high or low. This confirms the trend is continuing. For example, if price is going up and breaks above the last high, that’s a BOS to the upside. It tells you the trend is still strong.
Change of Character (CHoCH)
Change of character trading is when the market shifts direction. If price was making higher highs but then breaks below a recent low, that’s a CHoCH. It signals that smart money may be switching direction. This is one of the most powerful signals in Smart Money Concepts.

Liquidity Concepts
Equal Highs and Equal Lows
When price touches the same high or low level two or more times, it creates equal highs or equal lows. These are liquidity pools. Smart money often targets these zones because many retail traders place stops just above or below them.
Liquidity Sweeps
A liquidity grab trading strategy involves spotting when price briefly breaks above equal highs or below equal lows, then reverses fast. This sweep collects the stops. After the sweep, you look for a reversal entry. This is one of the cleanest setups in smart money trading.
Key Trading Zones
Order Blocks
An order block trading strategy focuses on the last candle before a big move. This candle marks where institutions placed their orders. When price comes back to test that area, it often reverses. Order blocks are like hidden support and resistance levels.
Supply and Demand Zones
Supply zones are areas where price dropped hard from. Demand zones are where price shot up from. These are similar to order blocks but slightly different in how they’re drawn. Both mark areas where institutional order flow trading happened.
Premium and Discount Zones
Premium and discount zones trading is based on a simple idea. The middle of any price range is the equilibrium. Above the middle is the premium zone — price is expensive. Below the middle is the discount zone — price is cheap. Smart money buys in discount and sells in premium.
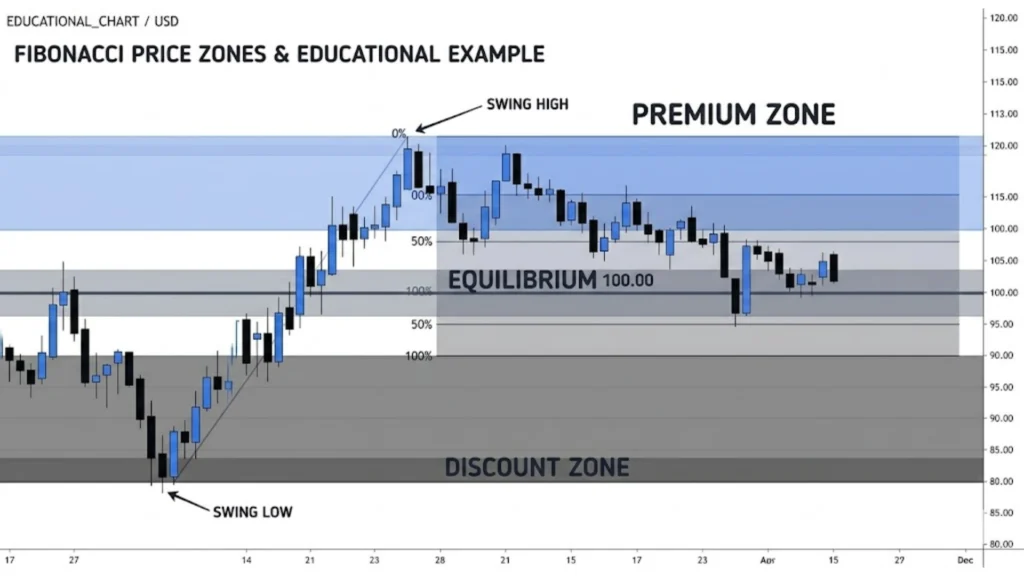
Imbalances in the Market
Fair Value Gaps (FVG)
A fair value gap trading setup appears when price moves so fast that it leaves a gap between candles. This gap is called an imbalance. Price often comes back to fill this gap before continuing. Fair value gaps are great entry areas for smart money traders.
Price Rebalancing
Price rebalancing means price returning to fill an imbalance trading strategy area. Think of it like a rubber band. Price stretches far, then snaps back. After rebalancing, price continues in its original direction. This is a very reliable pattern.
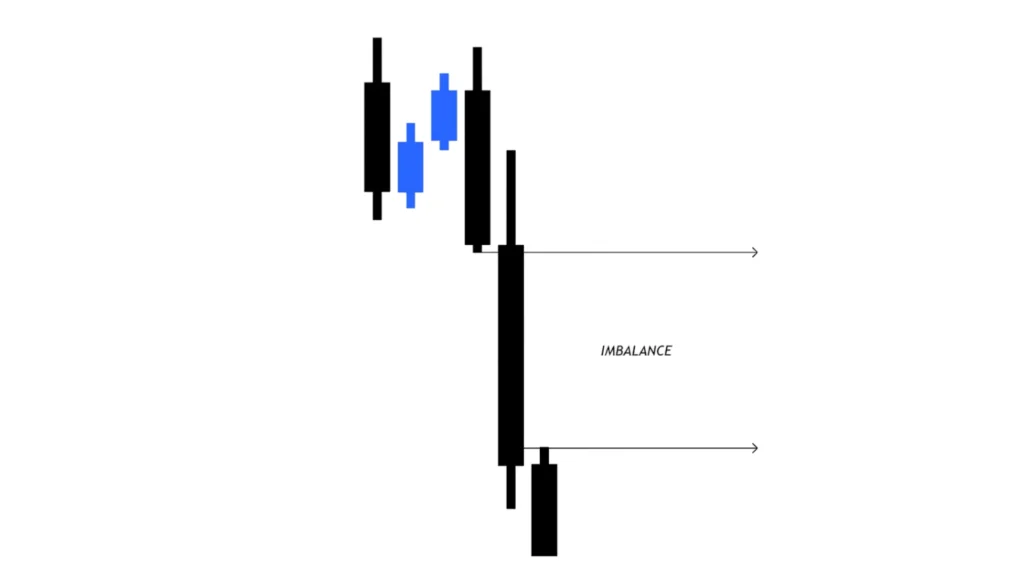
What Smart Money Concepts Look Like on a Chart
How to Spot Market Structure
Look at the chart from left to right. Mark every swing high and swing low. Connect the dots. See if price is making higher or lower points. This gives you the overall trend and helps with smart money price action reading.
How to Identify Liquidity Areas
Look for equal highs or equal lows on the chart. Look for areas with many stop orders. These are usually just above resistance or below support levels. Mark these with a simple horizontal line. These are your liquidity targets.
How to Mark Order Blocks Correctly
Find the last bearish candle before a strong bullish move, or the last bullish candle before a strong bearish move. That candle is your order block. Draw a box around it. When price returns to that box, watch for a reaction.
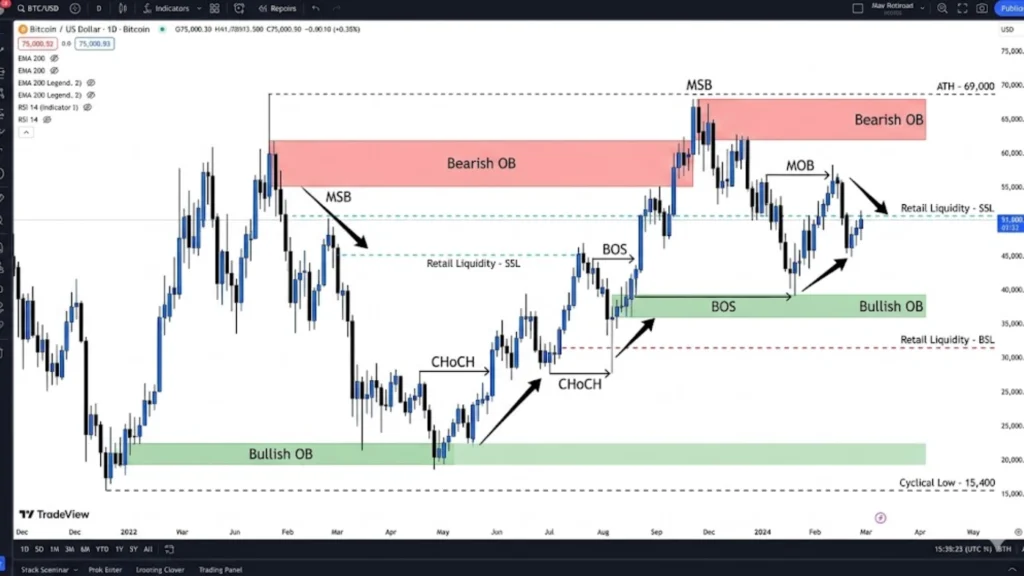
Step-by-Step Smart Money Trading Strategy
Step 1: Identify the Trend
Start on a higher timeframe like the daily or 4-hour chart. Determine if price is going up or down using market structure. Only trade in the direction of the trend. This is the foundation of any smart money trading strategy explained properly.
Step 2: Mark Liquidity Zones
Look for areas where price has made equal highs or equal lows. Also mark any previous major highs and lows. These are the targets smart money will likely move toward.
Step 3: Find Key Entry Areas
Drop down to a lower timeframe. Look for order blocks, fair value gaps, or demand zones in the direction of the trend. These are your potential entry areas.
Step 4: Wait for Confirmation
Don’t enter right away. Wait for price to sweep a liquidity level, then show a CHoCH or BOS on the lower timeframe. This confirmation tells you smart money has entered. Now it’s time to join them.
Step 5: Execute the Trade
Enter after the confirmation. Place your stop loss below the order block or above the liquidity sweep. Set your take profit at the next liquidity area. This is the how to trade smart money concepts method in action.
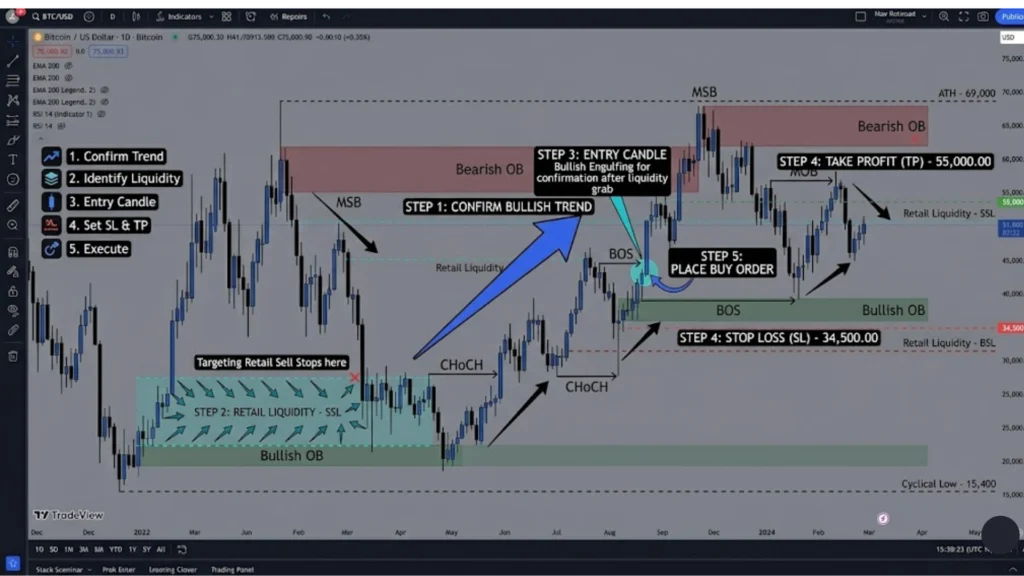
Simple Entry Models for Beginners
Confirmation Entry vs Anticipation Entry
A confirmation entry waits for price to sweep liquidity and then show a CHoCH before entering. It’s safer. An anticipation entry gets in earlier, before the confirmation happens. Beginners should always use confirmation entries. It reduces risk and improves accuracy.
One Easy Smart Money Concepts Setup for Beginners
Here is a simple smart money concepts for beginners setup. Wait for price to sweep a previous high or low. Then look for a fair value gap or order block on the 15-minute chart. Wait for a bullish or bearish engulfing candle. Enter on the close of that candle. Simple and clean.
Stop Loss and Take Profit (Easy Method)
Where to Place Stop Loss
Always place your stop loss below the order block or beyond the liquidity sweep candle. This protects you if the setup fails. Smart money risk management starts with a logical stop loss placement, not a random number.
How to Set Take Profit Using Liquidity
Set your take profit at the next liquidity level. Look for equal highs above if you’re in a long trade, or equal lows below if you’re in a short trade. This is where smart money will be selling or buying, which could reverse price.
Understanding Risk-to-Reward Ratio
Aim for at least 1:2 risk-to-reward. This means for every $1 you risk, you aim to make $2. This way, even if you lose more trades than you win, you can still be profitable. Good risk-to-reward is the backbone of smart money trading.
Multi-Timeframe Analysis (Made Simple)
Why Multi-Timeframe Analysis Matters
Multi-timeframe analysis trading helps you see the full picture. The higher timeframe shows the big trend. The lower timeframe shows your entry point. Using only one timeframe is like looking at a map with only one zoom level — you miss important details.
The Top-Down Approach (Easy Steps)
Start from the daily chart. Identify the trend. Move to the 4-hour chart. Mark key zones. Drop to the 1-hour or 15-minute chart. Find your entry. This top-down approach is used by most smart money traders around the world.
Best Timeframes for Beginners
For smart money concepts forex, use the daily, 4-hour, and 15-minute charts. For smart money concepts crypto, the same works well. For smart money concepts stocks, use the weekly, daily, and 1-hour charts. Keep it simple — three timeframes are enough.
Best Trading Sessions for SMC
London Session Behavior
The London session starts at 8 AM GMT. It’s one of the most active sessions. Price often sweeps Asian session highs or lows in the first hour. This is called a London liquidity sweep. It creates great SMC setups.
New York Session Behavior
The New York session starts at 1 PM GMT. It often reverses the London session move or creates a second wave in the same direction. Volatility is high. Smart money is very active during this time.
Best Time to Trade
The best times to trade using Smart Money Concepts are during the London open (8–10 AM GMT) and the New York open (1–3 PM GMT). Avoid trading during low volume conditions or just before major news events.
Advanced Smart Money Concepts (Simple Explanation)
Breaker Blocks
A breaker block is a failed order block. When price breaks through an order block instead of respecting it, that old order block becomes a breaker. Price often comes back to test it from the other side. These are advanced smart money concepts but very powerful.
Mitigation Blocks
A mitigation block is where smart money comes back to fix a loss. When institutions get stuck in bad trades, they return to the area to “mitigate” their position. Price often reacts strongly at these levels.
Inducement
Inducement is a fake setup designed to lure retail traders in early. Smart money creates a move that looks like a breakout. Retail traders enter. Then price reverses and takes their stops. Knowing about inducement helps you avoid being trapped.
SMT Divergence
SMT divergence happens when two correlated markets (like EUR/USD and GBP/USD) move differently. One makes a new high, the other doesn’t. This shows weakness and signals a possible reversal. It’s one of the best advanced SMC confirmation tools.
Real Trade Example (Step-by-Step)
Finding the Setup
On the 4-hour EUR/USD chart, price is in an uptrend. You spot equal highs that haven’t been swept. You wait for price to pull back and form an order block in the discount zone. A fair value gap also forms nearby.
Entry and Stop Loss
Price sweeps the equal highs, then quickly drops back. On the 15-minute chart, a CHoCH forms. You enter at the order block. Your stop loss goes below the liquidity sweep candle. Risk is 20 pips.
Taking Profit
Your take profit targets the next liquidity area — a previous high. That’s 60 pips away. Your risk-to-reward is 1:3. The trade hits target. Clean, simple, and effective. This is how smart money trading examples look in real life.
Common Beginner Mistakes in SMC
Marking Too Many Zones
Beginners often mark 20 order blocks on one chart. This creates confusion. Mark only the freshest, most relevant zones. Less is more in Smart Money Concepts.
Ignoring Higher Timeframes
Entering trades based only on the 5-minute chart is a common mistake. Always check higher timeframes first. Ignoring them leads to trading against the trend.
Entering Too Early
Entering before confirmation is a fast way to lose money. Wait for the CHoCH. Wait for the candle to close. Patience is a key part of smart money trading psychology.
Overtrading
Not every day has a perfect setup. Smart money traders wait. They might trade only two or three times per week. Quality over quantity always wins.
Risk Management (Simple Rules)
Risk Small, Win Big
Never risk more than you can afford to lose. A small loss doesn’t hurt much. A big loss can wipe out your whole account. Keep risks small and let winners run.
How Much to Risk Per Trade
The golden rule is to risk only 1–2% of your account per trade. If you have $1,000, risk no more than $10–$20 per trade. This keeps you in the game for the long run.
Protecting Your Trading Account
Use stop losses on every trade. Never move your stop loss to make it wider. Follow your plan. Protecting capital is more important than making profits.
Trading Psychology (Stay in Control)
Fear and Greed in Trading
Fear makes you exit trades too early. Greed makes you hold too long. Both hurt your results. Smart money trading psychology is about staying calm and trusting your plan.
Handling Losing Trades
Losses are normal. Even the best traders lose. What matters is how you respond. Don’t chase losses. Take a break if needed. Come back with a clear head.
Staying Patient and Disciplined
Discipline means only taking A+ setups. Patience means waiting for them. Most days, the best trade is no trade at all. These two qualities separate successful traders from struggling ones.
Best Tools and Platforms for SMC
Charting Platforms
TradingView is the best platform for SMC traders. It’s free, clean, and powerful. You can mark zones, draw order blocks, and analyze all timeframes easily. MetaTrader 4 or 5 also works for forex.
Basic Setup for Beginners
Keep your chart clean. Use just candlestick charts. Add horizontal lines for liquidity. Use boxes for order blocks. No cluttered indicators needed. A clean chart helps you think clearly.
Do You Need Indicators?
No. Smart money concepts indicators are optional. Some traders use volume tools or session indicators. But core SMC is based on pure price action. You don’t need anything fancy to start.
Smart Money Concepts vs Other Trading Methods
SMC vs Price Action
Price action trading reads candles and patterns. Smart Money Concepts goes deeper — it explains why those patterns form. SMC is basically an evolved version of price action. They work great together.
SMC vs Indicator Trading
Indicator trading uses tools like MACD, RSI, or Bollinger Bands. These lag behind price. SMC uses raw price data. It’s forward-thinking, not reactive. Most professional traders prefer price-based methods.
Which One Is Better?
SMC is better for understanding market manipulation. But the best strategy is one you understand and trust. Some traders blend SMC with indicators for extra confirmation. Choose what makes sense to you.
When NOT to Use Smart Money Concepts
Sideways Markets
When price is ranging with no clear structure, SMC setups are unreliable. Wait for a clear trend to form before trading.
News Events
Big news like central bank decisions can cause wild price movements. Avoid entering trades just before or during major news events. Price can spike both ways with no logical structure.
Low Volume Conditions
During holidays or off-peak hours, volume is low. Price can be choppy and unpredictable. SMC works best when institutions are actively trading.
How to Practice Smart Money Concepts
Using a Demo Account
Start on a demo account. Apply everything you learn with zero real money at risk. Practice marking zones, identifying structure, and executing trades. Spend at least one to two months here.
Backtesting Strategies
Go back in chart history and test your setup. See how many times it worked. This builds confidence. Backtesting is one of the best free education tools available.
Replay Practice
TradingView has a bar replay feature. Use it to simulate live trading on past data. It builds your decision-making skills under realistic conditions. This is like a flight simulator for traders.
Smart Money Concepts Glossary (Simple Terms)
BOS, CHoCH, FVG Explained
- BOS (Break of Structure): Price breaks beyond a previous high or low, confirming the trend continues.
- CHoCH (Change of Character): Price reverses structure, signaling a possible trend change.
- FVG (Fair Value Gap): A price gap or imbalance left behind by fast price movement.
Order Blocks and Liquidity
- Order Block: The last candle before a major move; where institutions placed big orders.
- Liquidity: Areas with lots of buy/sell orders, usually above highs or below lows.
Other Important Terms
- Premium Zone: Price is expensive; smart money sells here.
- Discount Zone: Price is cheap; smart money buys here.
- Inducement: A fake move designed to trap retail traders.
- Breaker Block: A failed order block that flips to the opposite side.
Frequently Asked Questions (FAQs)
Does Smart Money Concepts Really Work?
Yes, SMC works — but only with proper practice and discipline. It won’t make you rich overnight. It’s a framework for understanding market behavior. Thousands of traders around the world use it successfully in forex, crypto, and stocks.
Is SMC Good for Beginners?
SMC can feel overwhelming at first. But if you start with the basics — market structure, liquidity, and order blocks — it becomes manageable. This smart money concepts tutorial-style guide is a great starting point for any beginner.
Which Market Is Best for SMC?
SMC works in all markets. Smart money concepts forex is the most popular. Smart money concepts crypto is growing fast. Smart money concepts stocks also work well, especially with major indices. Start with one market and master it.
How Long Does It Take to Learn SMC?
Most traders start understanding the basics in one to three months. Getting consistently profitable takes six months to a year or more. There are no shortcuts. Be patient and keep learning every day.
Final Summary
Key Takeaways
Smart money concepts teach you to trade like the big players. You learn to read market structure, identify liquidity, use order blocks, and find high-probability entries. SMC works in forex, crypto, and stocks. It’s based on price action and institutional trading strategy, not lagging indicators.
The most important ideas are: follow the trend, wait for liquidity sweeps, enter at order blocks or fair value gaps, use proper risk management, and control your emotions.
Simple Action Plan for Beginners
- Learn market structure first.
- Understand what liquidity is and where it sits.
- Practice marking order blocks on a clean chart.
- Use a demo account for three months.
- Backtest your setups on past data.
- Only trade during London and New York sessions.
- Risk 1–2% per trade.
- Be patient. Wait for A+ setups only.
Smart money concepts are not magic. They are a clear, logical way to understand how markets really work. Start simple, stay consistent, and always keep learning.

Why Is Gold So Valuable? 10 Reasons Explained Simply
Why Is Gold So Valuable?
Gold is one of the most talked-about things in the world. From ancient kings to modern investors, everyone wants gold. But why is gold so valuable? What makes it so special compared to other things?
The answer is not just one thing. It is a mix of history, science, culture, and trust. Gold has been important for thousands of years. And even today, in a world of digital money and smartphones, people still buy and store gold. That tells you something very powerful.
In this article, we will explain everything about gold’s value in simple, easy words. Whether you are a student, a first-time investor, or just curious — this guide is for you.

What Is Gold?
Gold as a Natural Metal
Gold is a natural metal found deep inside the Earth. It comes from rocks and riverbeds. Miners dig it out or find it in streams. Gold has been on Earth for billions of years.
Basic Features — Yellow, Shiny, Does Not Rust
Gold is bright yellow and very shiny. It does not rust, break, or fade. These physical properties of gold value are a big reason people trust it. It looks the same after 1,000 years. No other common metal does that.

A Short Story: How Gold Became Valuable
Early Humans Discovering Gold
Thousands of years ago, early humans found shiny yellow rocks in rivers. They were attracted to its color and beauty. They started collecting it and using it as decorations.
Use by Kings and Empires
As civilizations grew, kings and rulers used gold to show power. The Egyptians, Romans, and Chinese all valued gold deeply. Gold crowns, gold coins, and gold temples became symbols of strength.
Gold Becoming Money — The Gold Standard
Later, countries started using gold as the base of their money systems. This was called the “gold standard.” Every paper note was backed by real gold. This is why gold was used as currency for so long. Even though we left the gold standard, the history of gold value still shapes how we see it today.

Why Has Gold Always Been Valuable?
Trust Built Over Thousands of Years
One huge reason why gold has value is trust. People have trusted gold for thousands of years. No government created that trust. People decided on their own that gold is worth something. That trust has never broken.
Used in Trade, Wealth, and Power
From ancient trade routes to modern banks, gold has always been at the center of wealth and power. The importance of gold in trade made it a universal language — everyone accepted it, no matter the country or language.
Ten Simple Reasons Why Gold Is Valuable
Gold Is Rare
Why is gold rare? Because there is only a limited amount of it on Earth. All the gold ever mined would fill only about 3.5 Olympic swimming pools. This limited supply increases its value. When something is hard to find, people want it more.
Gold Is Beautiful
Gold’s shiny, warm yellow color is naturally attractive. That beauty is one reason gold is used in jewelry worldwide. People have always loved how it looks.
Gold Does Not Rust or Break
Why is gold non-reactive? Because of its chemical structure. Gold does not react with air, water, or most chemicals. It never rusts, never fades, and never breaks down. This durability is a core part of why gold holds its value.
Gold Is Easy to Shape (Jewelry)
Gold is soft and easy to mold into rings, necklaces, and coins. This is why gold is used in jewelry across the world. Craftsmen can shape it into anything without breaking it.
Gold Is Accepted Worldwide
You can sell gold in Japan, India, USA, or Africa. Everyone accepts it. No other asset has this kind of global acceptance. This worldwide demand is a key gold value reason.
Gold Stores Value Over Time
Gold as a store of value means it keeps its buying power. One gold coin in ancient Rome could buy a nice toga. Today, that same amount of gold can buy a nice suit. Cash loses value. Gold does not.
Gold Protects Against Inflation
When prices go up, your cash buys less. But gold vs inflation shows that gold usually rises when inflation rises. This makes gold a hedge against inflation for smart investors.
Gold Is Used in Technology
Did you know your smartphone has gold in it? Gold is used in circuit boards, connectors, and medical devices. The uses of gold in technology are growing every year. This creates real industrial demand.
Gold Is Trusted by Governments
Why do central banks buy gold? Because it is safe and reliable. Central banks around the world store gold as part of their reserves. This shows that even powerful governments trust gold more than paper money.
Gold Has Cultural Importance
In India, China, and the Middle East, gold is deeply tied to weddings, festivals, and religious ceremonies. The cultural importance of gold keeps demand very high in these regions.

What Makes Gold Special? (Physical and Chemical Properties)
Gold is one of the most unique elements in nature. It is non-reactive, which means it does not combine with other chemicals easily. It is also extremely durable and can last for millions of years without changing. You can beat it into very thin sheets or stretch it into long wires. These physical properties of gold value make it useful in both art and science.
Gold’s “Double Role” (The Dichotomy)
Gold as Jewelry (Beauty)
One side of gold is purely aesthetic. It is gorgeous. People wear it at weddings and pass it down through generations. It carries emotional value.
Gold as Investment (Money)
The other side is financial. Investors buy gold bars, coins, and ETFs. They treat it like money. This dual role — beauty and investment — is what makes gold truly unique among all assets.
How Much Gold Exists in the World?
Total Gold Mined — Around 212,000 Tons
How much gold exists in the world? All the gold ever mined is roughly 212,000 metric tons. That sounds like a lot, but it is actually very little. If you melted it all together, it would form a cube of only about 22 meters on each side.
Why Limited Supply Increases Value
Gold supply and mining are both very slow and expensive. It takes tons of rock to produce a small ounce of gold. Because gold is limited supply, it stays valuable. You cannot print more gold like you print paper money
How Is Gold Price Decided Today?
Demand vs Supply
The most basic rule: when more people want gold and there is less of it available, the price goes up. Gold demand and supply directly drive the gold market.
Role of Central Banks
When central banks buy or sell gold, it moves the market. Their buying signals confidence in gold, which pushes prices up.
Investor Demand — ETFs and Funds
Gold ETFs allow people to invest in gold without holding it physically. When ETF demand rises, gold prices often rise too.
Currency Value — US Dollar Impact
Gold is priced in US dollars. When the dollar is weak, gold gets more expensive. This is a key part of how gold price is determined,
Key Factors That Influence Gold Prices
Gold price factors include inflation, wars, economic crises, and mining output. When the economy is unstable, people rush to buy gold. That rush drives prices higher. Low mining production also reduces supply and increases value. Consumer demand from jewelry and technology industries also plays a big role.
Why Gold Is a Safe Haven Asset
What “Safe Haven” Means
A safe haven is something people trust when everything else is falling apart. Gold is the ultimate safe haven asset because it has held its value through wars, crashes, and disasters.
Why People Buy Gold During Crises
Gold during economic crisis has always performed well. In 2008, when banks collapsed, gold prices rose. During COVID-19, gold hit record highs. People trust gold when they do not trust anything else.
Gold vs Other Assets (Simple Comparison)
Gold vs Cash
Cash loses value due to inflation. Gold vs currency value shows that gold maintains purchasing power over decades while currencies weaken.
Gold vs Stocks
Stocks can crash overnight. Gold is slower and steadier. It is not for fast profits — it is for protection.
Gold vs Real Estate
Real estate needs maintenance and cannot be quickly sold. Gold is easy to sell anywhere in the world within hours.
Gold vs Cryptocurrency
Crypto is new, volatile, and unproven over long history. Gold has 5,000 years of trust behind it. For safety, gold wins.
Gold’s Role in the Global Economy
Gold in the global economy is massive. Central banks hold gold as reserves to back their financial systems. Before 1971, money was directly backed by gold (the gold standard). Even today, gold shapes how investors and governments think about economic stability. The economic importance of gold is not going away anytime soon.
Cultural and Religious Importance of Gold
Use in Weddings and Traditions
In India alone, families buy hundreds of tons of gold every year for weddings. Gold is given as gifts, worn at ceremonies, and seen as a blessing.
Symbol of Wealth and Status
Across cultures, gold is a symbol of success, royalty, and respect. From Olympic medals to royal crowns, gold represents the best of the best.

Real-Life Uses of Gold Today
Jewelry
Over 50% of gold demand comes from jewelry. It is the most visible use of gold in everyday life.
Technology — Phones and Electronics
Gold conducts electricity perfectly and does not rust. It is used in phone connectors, computer chips, and aerospace equipment. Why gold is used in technology is simple — it is the best conductor that lasts forever.
Medicine and Dentistry
Gold is used in dental crowns, cancer treatments, and surgical instruments. It is safe inside the human body because it is non-reactive.
Benefits of Owning Gold
The benefits of investing in gold are clear. It protects your wealth from inflation. You can sell it anywhere in the world. It diversifies your investment portfolio. And it gives peace of mind during uncertain times. Why people trust gold comes down to one thing — it has never let them down.
Downsides of Gold (Important!)
Gold is not perfect. It gives no regular income like stocks or rent. Storing physical gold safely can be expensive. And gold price fluctuations mean you might buy high and sell low if you are not careful. Always invest wisely.
How to Invest in Gold
Physical Gold — Coins and Bars
Buy gold coins or bars from trusted dealers. Store them safely. This is the most direct way.
Gold ETFs and Mutual Funds
Gold ETFs let you own gold without storing it. They are easy to buy and sell through stock markets.
Gold Trading
Experienced investors trade gold on commodity markets. This is riskier but can give faster returns.
Gold Loans: Using Gold for Money
Many people use their gold jewelry or coins to get loans from banks. The gold acts as security. The higher the gold value, the bigger the loan you can get. It is a smart way to use idle gold during financial emergencies.
Gold Price Trends — Past and Present
Gold was around $35 per ounce in 1970. By 2020, it crossed $2,000 per ounce. Why gold price increases over time is linked to inflation, global demand, and economic fear. Prices have ups and downs, but the long-term trend has always been upward.
Why Gold Is Rising — Modern Trends
Today, rising inflation, economic uncertainty, and political tensions are pushing gold prices higher. Even young investors are buying gold ETFs and digital gold. The gold investment guide for modern times includes all these new tools. The reasons gold is expensive today are more powerful than ever.
Gold vs Silver and Other Metals
Why is gold more valuable than silver? Gold is rarer, more trusted, and has more historical value. Silver is also useful and valuable, but gold wins in global acceptance, investment trust, and cultural status. Other precious metals like platinum are also rare, but gold remains king because of its unique history and worldwide recognition.
Common Questions About Gold (FAQs)
Question: Why is gold so expensive?
Answer: Because it is rare, durable, trusted worldwide, and has thousands of years of value behind it.
Question: Can gold lose its value?
Answer: In the very short term, yes. But over long periods, gold has always held or increased its value.
Question: Why do countries store gold?
Answer: Because it is a safe, universally accepted asset that protects national wealth.
Question: Is gold a good investment?
Answer: Yes, especially for long-term security and protection against inflation. It is not for quick profits but for safe wealth preservation.
Fun Facts About Gold
Gold never rusts — ever. A single ounce of gold can be stretched into a wire 80 kilometers long. Most of the gold ever mined in history still exists today in some form. Gold has been found on every continent on Earth. And the human body contains a tiny amount of gold naturally!
The Future of Gold
Will gold stay valuable? Almost certainly yes. Gold’s role in modern finance is growing, not shrinking. New uses in green technology, medicine, and space exploration are being discovered. As long as humans trust gold — and they have for 5,000 years — it will stay precious.
Final Thoughts
So, why is gold so valuable? Because it is rare, beautiful, durable, globally accepted, and deeply trusted. It protects wealth, fights inflation, and holds its value through every storm.
Gold is not just a metal. It is a symbol of trust that humanity has shared across generations, cultures, and continents.
Whether you want to invest, protect your savings, or simply understand the world better — knowing the value of gold explained in simple terms is a great start. Gold was valuable yesterday, it is valuable today, and it will be valuable tomorrow.
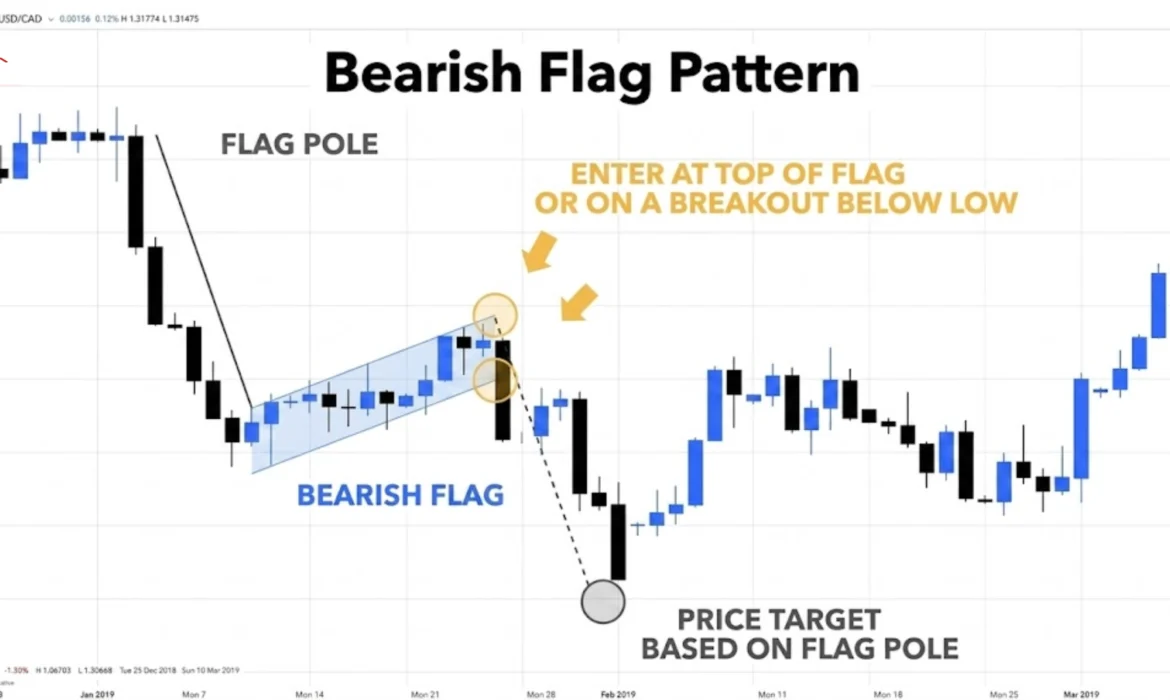
Bearish Flag Pattern: Easy Guide to Understand and Trade
What is a Bearish Flag Pattern?
The bearish flag pattern is a chart pattern in trading where the price first drops sharply, then pauses for a little while, and then drops again. It’s like a ball rolling down a hill, taking a small rest, and then rolling down even more.
It’s called a “flag” because when you look at it on a chart, it really looks like a flag on a pole. The sharp drop is the pole. The small pause or slight rise is the flag itself.
This pattern usually appears in a strong downtrend. That means the market is already moving down, and this pattern is a signal that it will keep going down. Traders use it to find good selling opportunities.
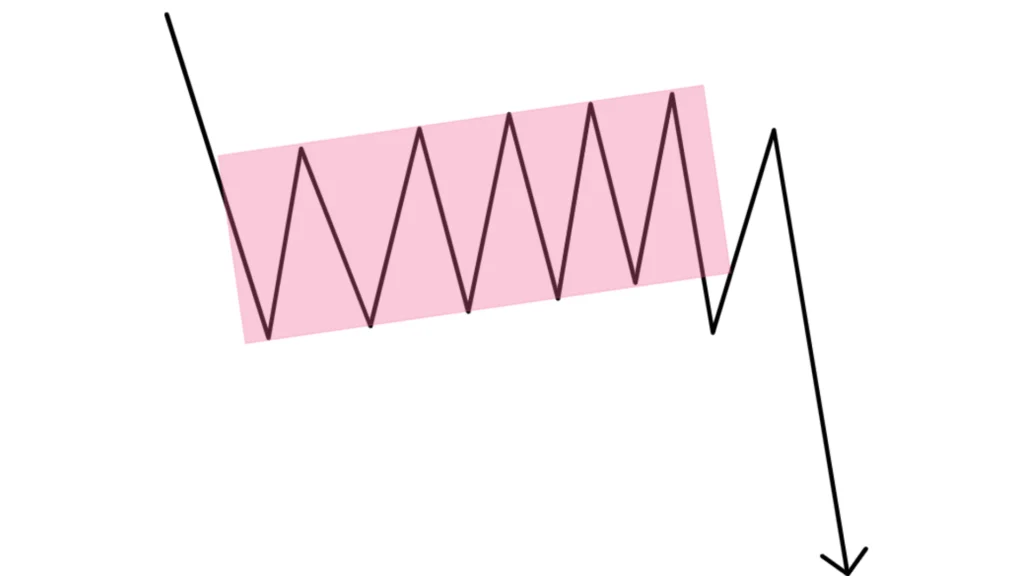
How a Bearish Flag Looks
Let’s paint a picture in your mind. Think of a flag flying outside a building.
The Flagpole is the long stick going down. In trading, this is the sharp, fast price drop. It happens quickly and strongly. Sellers are in full control here.
The Flag is the small cloth part. In trading, this is when the price moves slightly upward or sideways. It’s a small rest. The price doesn’t go up much — just enough to look like a flag.
The Breakout is when the flag lets go. The price suddenly drops below the flag’s lower edge and continues the downtrend. This is where traders like to sell.
Think of it simply: drop, rest, drop again. That’s the whole bear flag pattern in three words.
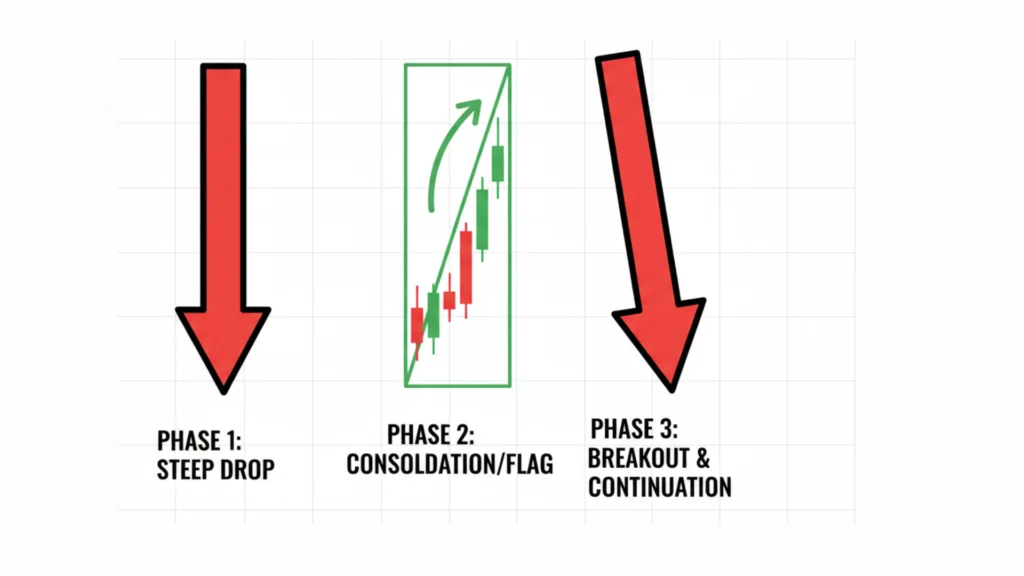
Why the Bearish Flag Pattern Works
Behind every chart pattern, there are real people making decisions. Here’s what’s happening in people’s minds during a bearish continuation pattern:
First, sellers are very strong. They push the price down hard and fast. This creates the flagpole. Everyone is scared or wants to sell.
Then, some buyers think, “The price dropped too fast, let me buy now.” So they start buying a little. The price rises slightly. This creates the flag.
But the big sellers haven’t gone away. They were just waiting. When the price goes up a little, they see it as a chance to sell again — at a better price. So they come back stronger.
The sellers take over again. The price breaks down. This is the breakout. For traders, this moment is the opportunity to enter a short (sell) trade.
Understanding this psychology helps you trust the pattern more.
Key Parts of a Bear Flag Pattern
The Flagpole (Strong Down Move)
The flagpole is the first part. It’s a fast, strong drop in price. This move should be big and clear. If the drop is weak or slow, it’s probably not a real bear flag setup. A strong flagpole shows that sellers are very serious.
The Flag (Consolidation Phase)
The flag is where the price takes a small break. It either moves slightly upward or sideways. This phase usually has lower trading volume, which is a key sign. The flag should look like a small upward channel — two parallel lines going up slightly.
The Breakout Point
This is the moment the flag ends. The price breaks below the lower line of the flag. This is called the bear flag breakout. A real breakout usually happens with a spike in volume. That’s your trading signal.
Volume Behavior (Very Important)
Volume is like the energy behind price moves. During the flagpole, volume is high. During the flag phase, volume goes down. When the breakout happens, volume should go back up. If volume doesn’t increase at breakout, be careful — it could be a false signal.
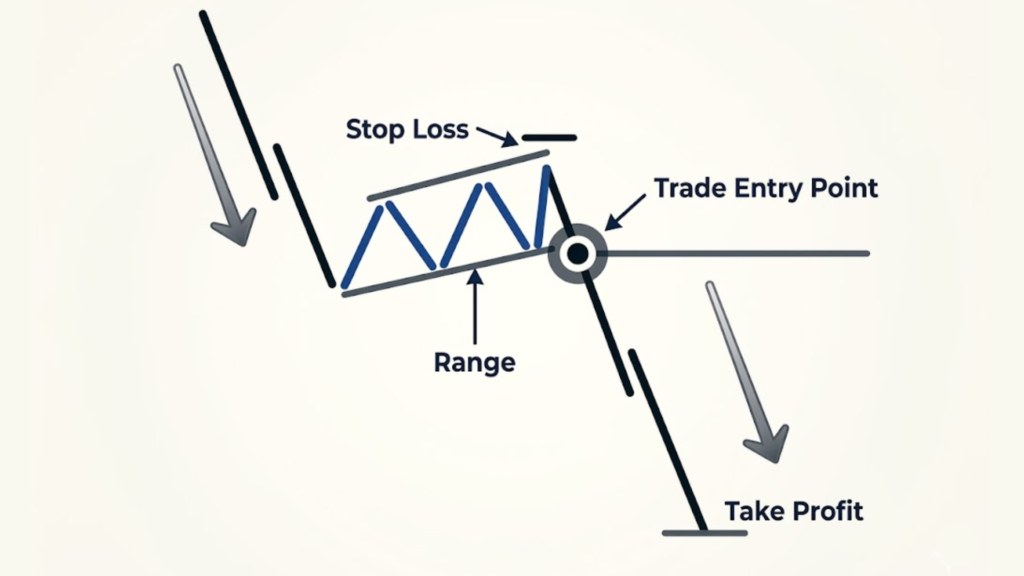
How to Spot a Bearish Flag Pattern (Step-by-Step)
Spotting a bear flag pattern in live markets is a skill. Here’s how to do it step by step:
- Find a strong downtrend. Look at the chart and find where price dropped fast and hard. This is your flagpole.
- Look for a small upward channel. After the drop, the price should start moving up slightly inside two parallel lines. This is your flag.
- Check decreasing volume. Volume should be getting smaller during the flag. This shows buyers are weak.
- Wait for breakout below support. The price must break below the lower line of the flag. Don’t enter before this happens.
Patience is the key here. Don’t rush.
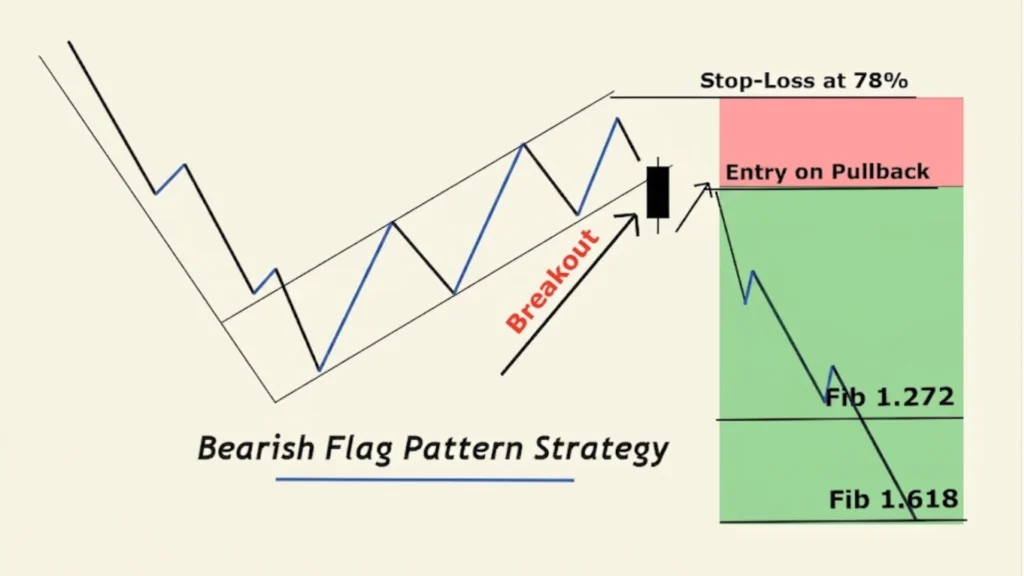
When Does a Bearish Flag Pattern Form?
The bearish flag doesn’t form at random. It usually shows up in very specific situations:
It forms after strong selling pressure. When sellers have pushed price down hard, the market needs a short rest before continuing.
It forms during market pullbacks. A pullback is when price goes slightly against the trend. In a downtrend, this means a small rise. That small rise often becomes the flag.
It forms in trending markets. This is very important. The bear flag pattern works best in markets that are clearly going down. It does not work well in sideways or choppy markets where there’s no clear direction.
How to Trade a Bearish Flag Pattern (Step-by-Step Guide)
Step 1: Identify the Pattern
Look for the flagpole, flag, and get ready for the breakout. Make sure all three elements are clearly visible on your chart.
Step 2: Wait for Confirmation
Do not enter early. Wait for the price to actually break below the flag’s lower support line. Confirmation is everything in bear flag technical analysis.
Step 3: Entry Point (Sell Position)
Enter your sell trade right after the breakout candle closes below the lower flag line. Some traders wait for a small retest of the broken level before entering.
Step 4: Stop-Loss Placement (Stay Safe)
Place your bear flag stop loss above the highest point of the flag. If price goes back above that point, the pattern has failed and you should exit safely.
Step 5: Profit Target (Measured Move)
The bear flag profit target is calculated using the measured move. Measure the length of the flagpole. Then subtract that length from the breakout point. That gives you your target.
Step 6: Manage the Trade
Once in the trade, watch it carefully. You can move your stop-loss to breakeven once price moves in your favor. This protects your profit.
Step 7: Review Your Trade
After the trade closes (win or loss), review it. Ask yourself: Did I follow the rules? Was the pattern valid? This helps you grow as a trader.
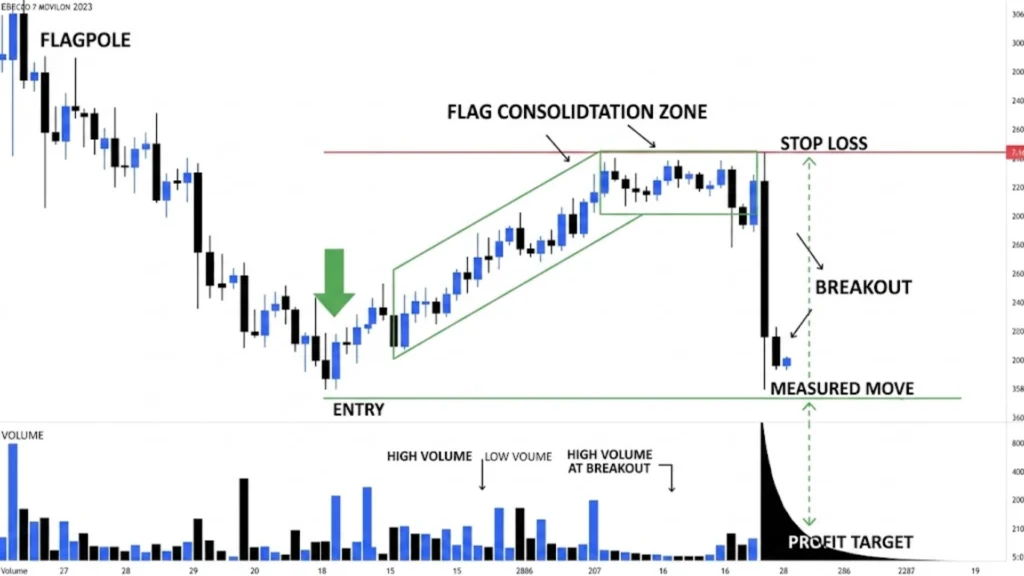
Real Trade Example (Simple Walkthrough)
Let’s say you’re looking at a stock chart. You see the price drop from $100 to $85 quickly. That’s your flagpole — a $15 drop.
Then the price slowly rises back to $88 over a few days inside a small upward channel. Volume is low during this time. That’s your flag.
Then one morning, the price breaks below the flag’s lower line at $86. Volume spikes. You enter a sell trade at $85.50.
You place your stop-loss at $89 (above the flag). Your profit target is $70 ($85.50 minus the $15 flagpole).
The price drops to $71 over the next week. You exit near your target. Result: a successful trade using the bear flag pattern.
Even if it had failed and hit your stop-loss, your loss would have been small because you used proper risk management.
Bearish Flag Trading Strategies
Classic Breakdown Strategy
Enter right when price breaks below the flag’s lower trendline. Use the measured move for your target. This is the most common bear flag trading strategy.
Flag Retest Strategy
Sometimes after the breakout, price comes back up to test the broken support line (now resistance). Wait for this retest and enter there. This gives you a better entry price and tighter stop-loss.
Volume Confirmation Strategy
Only enter when volume increases significantly at the breakout. If volume is weak, skip the trade. Bear flag volume analysis is one of the most reliable filters.
Multiple Timeframe Strategy
Check the pattern on a higher timeframe (like 4H or Daily). Then go to a lower timeframe (like 15 min) to find a precise entry. This gives you both the big picture and a clean entry.
Best Indicators to Use with Bear Flag
Using indicators alongside the bearish flag pattern makes your trades stronger:
RSI (Relative Strength Index): During the flag phase, RSI often rises to the 50–60 range (overbought on smaller timeframes). When RSI starts falling again, it confirms the bearish move.
Moving Averages: If the price is below the 50-day or 200-day moving average, the downtrend is confirmed. This supports your bear flag trade.
Volume Indicators: Tools like OBV (On-Balance Volume) or Volume Bars help you see if volume is declining in the flag and rising at breakout.
These indicators don’t give signals alone. They simply confirm what the bear flag price action is already telling you.
Bearish Flag vs Other Patterns
Bear Flag vs Bull Flag
A bull flag is the opposite. Price rises sharply (flagpole), then rests slightly downward (flag), then breaks upward. The bear flag breaks downward. Same shape — opposite direction.
Bear Flag vs Bearish Pennant
Both are bearish continuation patterns. The difference is the shape of the consolidation. A bear flag has a rectangular channel. A bearish pennant has a triangle shape (converging lines). Both are valid, but slightly different entries.
Bearish Flag vs Descending Channel
A descending channel is a longer pattern with lower highs and lower lows over time. A bear flag is shorter and appears within a downtrend. The bear flag is faster and sharper.
Best Timeframes for Trading Bear Flags
Scalping (1–5 min): Fast trades, quick moves. Works but requires focus and experience.
Day Trading (15 min–1 hour): Great for catching intraday bear flags. Most day traders prefer this.
Swing Trading (4H–Daily): Larger moves, more reliable signals. Best for beginners who want less stress.
Best for beginners: The 1-hour or 4-hour chart. Signals are clearer and you have more time to think before entering.
Where to Trade Bearish Flag Patterns
The bearish flag pattern works across many markets:
Stocks: Common in individual stocks during earnings season or market downturns.
Forex: Works well on major pairs like EUR/USD or GBP/USD. The bear flag forex strategy is popular among currency traders.
Crypto: Bear flags appear often in Bitcoin and altcoins during bear markets. Bear flag crypto trading can be very profitable but also riskier.
Charting Platforms: TradingView is the best free platform to spot and draw bear flag patterns. It’s easy to use and works for all markets.
How to Avoid Fake Bearish Flags (Common Trap)
Not every bear flag is real. Here’s how to avoid false bear flag breakouts:
Weak breakout: If the breakout candle is small or has no momentum, wait. A real breakout is strong and clear.
No volume confirmation: If volume doesn’t increase at breakout, the move may not last. Always check volume.
Sideways market conditions: If the overall market is moving sideways with no clear downtrend, avoid trading bear flags. They need a trending market to work.
Entering too early: Don’t enter inside the flag. Wait for the actual breakout. Patience protects your money.
Common Beginner Mistakes (And How to Fix Them)
Trading without confirmation: Fix this by waiting for the breakout candle to close. Never enter on a guess.
Ignoring stop-loss: Fix this by always setting your stop-loss before entering. No exceptions.
Overtrading: Fix this by only trading 1–2 setups per day. Quality over quantity always wins.
Misidentifying patterns: Fix this by studying real bear flag pattern examples on historical charts before trading live.
Risk Management Rules (Keep It Simple & Safe)
Good bear flag risk management is what keeps you in the game long-term:
- Risk only 1–2% per trade. Never risk more than this on one trade.
- Always use stop-loss. There are no excuses for skipping this step.
- Don’t chase price. If you missed the entry, wait for the next setup. Chasing leads to bad entries.
- Risk vs reward ratio: Aim for at least 1:2 or 1:3. If you risk $50, your target should be $100–$150.
When NOT to Trade a Bear Flag
Avoid trading the bearish flag in these situations:
- During major news events (like interest rate decisions or earnings). News can break patterns instantly.
- In low-volume markets (like holidays or early morning). Moves aren’t reliable.
- In choppy or sideways trends. The pattern only works in clear downtrends.
How Much Profit Can You Expect?
Be realistic. The bear flag pattern is reliable, but it doesn’t win every time. Most experienced traders aim for a 55–65% win rate with this pattern.
The measured move concept means your profit target equals the length of the flagpole. If the flagpole is 10%, your target is a 10% move after breakout.
With a 1:2 risk-reward ratio, even a 50% win rate makes you profitable over time. Focus on consistency, not big wins.
Quick Checklist Before You Enter a Trade
Before entering any bear flag trade, go through this checklist:
✔ Strong downtrend confirmed
✔ Clear flagpole visible
✔ Flag shows parallel upward channel
✔ Volume decreasing during flag
✔ Breakout confirmed with strong candle
✔ Stop-loss placed above the flag
✔ Profit target calculated using measured move
✔ Risk is only 1–2% of account
If even one box is not checked, wait for a better setup.
Advantages and Disadvantages of Bearish Flag Pattern
Advantages
The bearish flag is easy to spot on charts, even for beginners. It works well in trending markets and gives you clear entry and exit points. The rules are simple and consistent.
Disadvantages
False breakouts do happen, especially in choppy markets. It always needs confirmation before entering. It’s not reliable in sideways or low-volume conditions.
Practice Guide: Try It Yourself
The best way to learn is by doing. Here’s a simple practice plan:
- Open a free chart on TradingView.
- Pick any stock, forex pair, or crypto that has been trending down.
- Look back at the chart and find 3 clear bear flag patterns.
- Mark the flagpole, flag, and breakout on each one.
- Write down where your entry, stop-loss, and target would have been.
Do this daily for 2 weeks. You’ll start spotting bearish flag patterns quickly and naturally.
FAQs About Bearish Flag Pattern
Question: Is bearish flag pattern good for beginners?
Answer: Yes! It’s one of the easiest chart patterns to learn. Start on the 1-hour or 4-hour chart.
Question: Does bearish flag work in crypto trading?
Answer: Yes. Bear flag crypto trading is very common. Bitcoin and major altcoins frequently form this pattern during downtrends.
Question: How accurate is it?
Answer: Studies suggest bear flags have a success rate of around 60–70% when traded with proper confirmation and volume. It’s not perfect, but it’s reliable.
Question: Can bearish flag fail?
Answer: Yes. All patterns fail sometimes. That’s why stop-loss and risk management are non-negotiable.
Question: What is the best timeframe?
Answer: For beginners, the 4-hour or daily chart is best. For experienced traders, even the 15-minute chart works well.
Simple Summary (Quick Recap)
The bearish flag pattern is a powerful tool for traders who want to trade in the direction of the downtrend.
What it bearish flag: A sharp price drop (flagpole), a small pause moving up or sideways (flag), and then another drop (breakout).
How to spot bearish flag: Look for a strong downtrend, a small upward channel with decreasing volume, and a breakout below the flag.
How to trade it: Wait for breakout confirmation, enter sell, place stop-loss above the flag, and target the measured move.
Key rules to remember: Always confirm the breakout. Always use stop-loss. Only trade in trending markets. Manage your risk every single time.
Master these simple rules, and the bear flag trading strategy can become one of your most reliable tools in the market.