
What Is a Breaker Block?
A breaker block is a special area on a trading chart where the price breaks through an important level and then comes back to test it. Think of it like a door that was locked, someone broke it open, and now people want to check if it’s really broken. In forex trading and other markets, breaker blocks help traders find good entry points.
Breaker Block Explained in Simple Words
Imagine you’re playing a game where you need to jump over walls. A breaker block is like a wall that you jumped over, but then you come back to touch it one more time before running away fast. In trading, when price breaks a support or resistance level, that broken level becomes a breaker block. Smart traders wait for price to return to this block before entering a trade.
How a Breaker Block Forms Step by Step
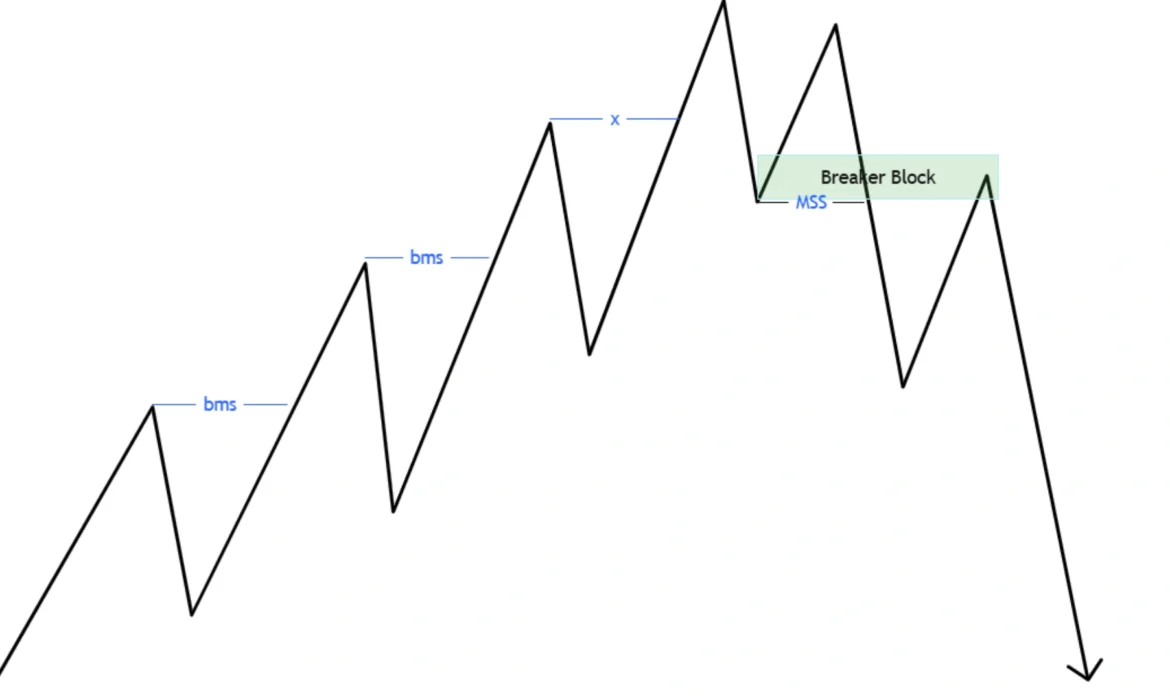
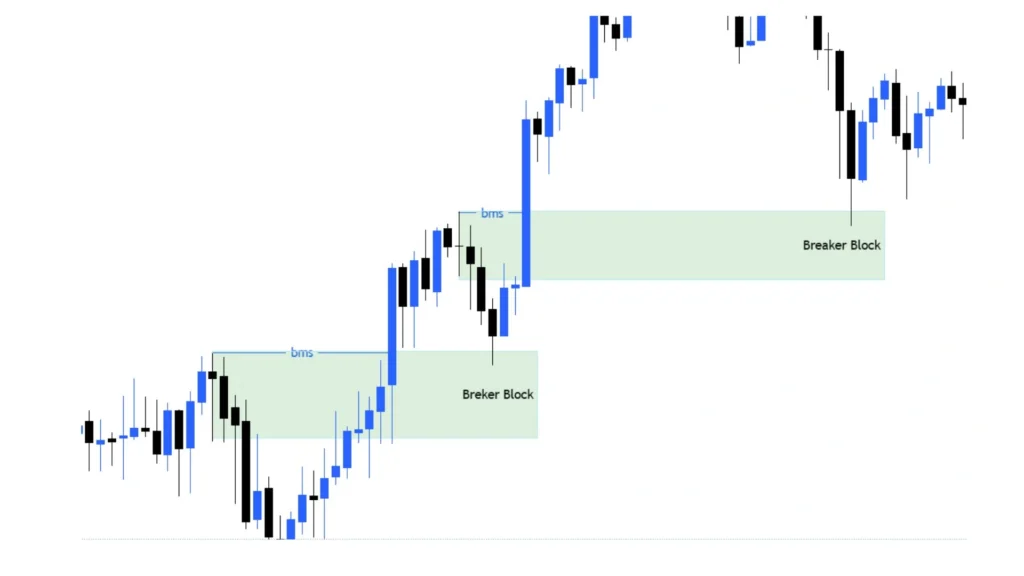
A breaker block forms in three simple steps. First, price creates a support or resistance zone. Second, price breaks through this zone with strong momentum (this is called a structure break). Third, price comes back to retest this broken zone. This retested zone is now your breaker block. The breaker block concept helps traders understand market structure better.
Bullish Breaker Block Explained
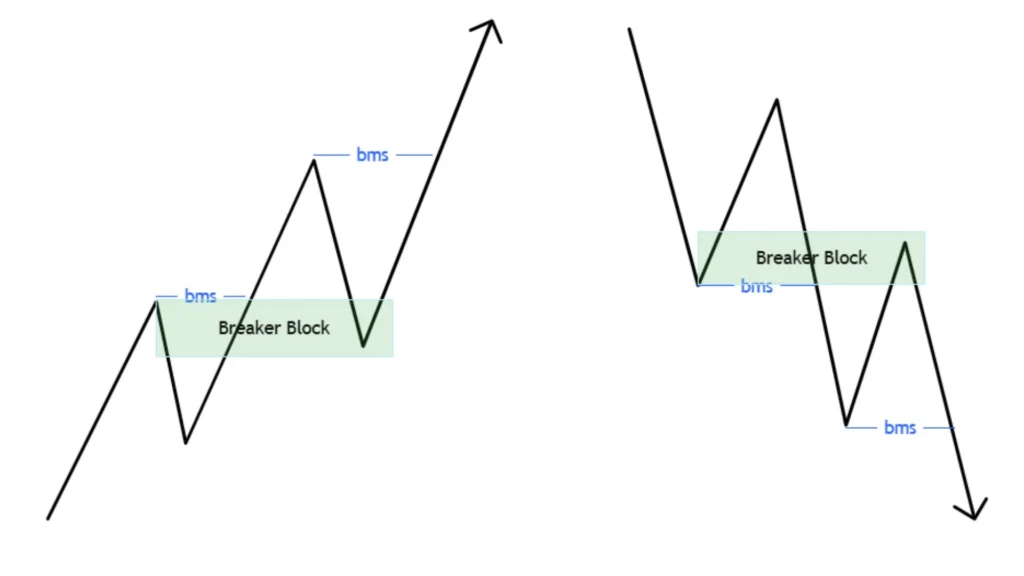
A bullish breaker block happens when price breaks below a support level and then comes back up to test it. After the test, price usually continues going up. Think of it like digging under a fence, then climbing back up to check the fence, and finally jumping over it to go higher. Traders use bullish breaker blocks to find buy opportunities.
Bearish Breaker Block Explained
A bearish breaker block is the opposite. Price breaks above resistance, comes back down to test it, and then continues falling. It’s like jumping over a high wall, landing on the other side, touching the wall one more time, and then running downhill. Bearish breaker blocks signal selling opportunities in the market.
How to Identify Breaker Blocks on a Chart
Finding breaker blocks isn’t hard once you know what to look for. You need to train your eyes to spot structure breaks and retests.
Simple Checklist to Find a Breaker Block
Here’s your easy checklist: First, find a clear support or resistance level. Second, watch for a strong break of this level. Third, wait for price to come back and touch the broken level. Fourth, look for rejection signs like a pin bar or engulfing candle. If all these happen, you’ve found a breaker block forex setup.
How to Find Bullish Breaker Blocks
To find bullish breaker blocks, look at downtrends. Find where price breaks below old support levels. Mark the last bearish candle before the break. When price comes back up to this candle, that’s your bullish breaker block. The key is waiting for the retest to complete before entering.
How to Find Bearish Breaker Blocks
For bearish breaker blocks, do the opposite. Look at uptrends. Find where price breaks above old resistance. Mark the last bullish candle before the break. When price returns down to this candle, you’ve found your bearish breaker block. This is where selling pressure often comes in.
Valid vs Fake Breaker Blocks (Beginner Rules)
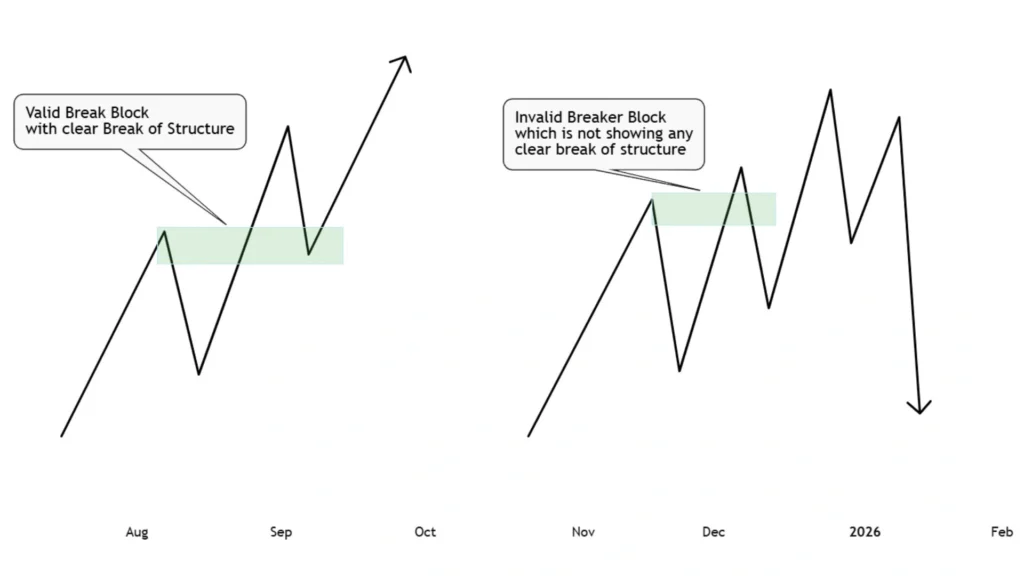
Not all breaker blocks work. A valid breaker block has a clean structure break with strong momentum. A fake one has weak breaks or too many retests. Valid breaker blocks also respect the liquidity zones around them. If price breaks but immediately comes back, it might be a fake signal. Always check the higher timeframe for confirmation.
Breaker Block Trading Strategy
Now let’s talk about how to actually trade using breaker blocks. This breaker block trading strategy is simple and works on any market.
How to Trade Using Breaker Blocks
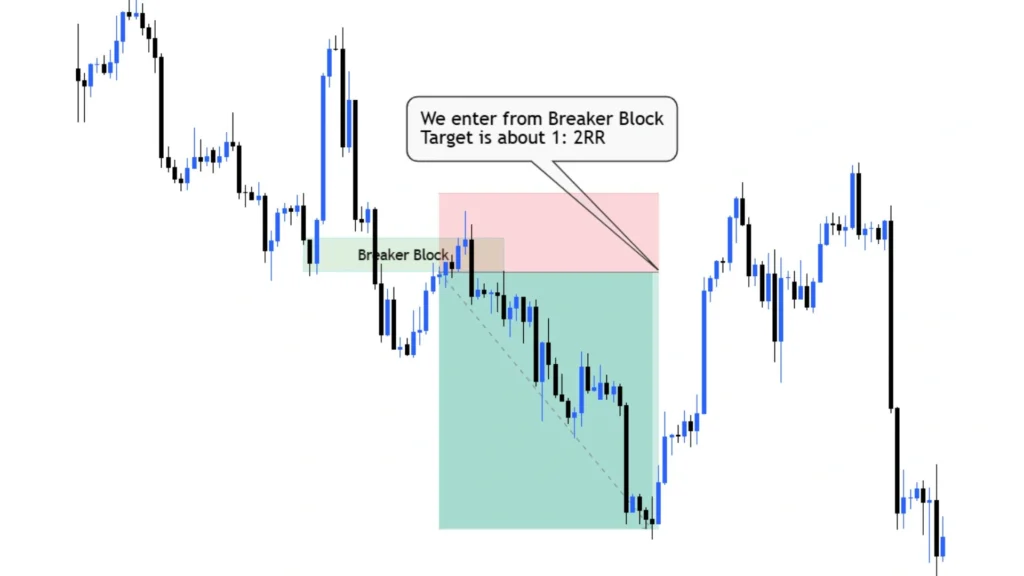
Wait for price to break a key level. Let it move away from the break point. When price returns to the breaker block, look for rejection candles. Enter your trade when you see confirmation. The breaker block strategy works best when combined with order flow analysis.
Entry Rules for Breaker Block Trades
For bullish trades, enter when price retests the breaker block from below and shows rejection (like a bullish engulfing or hammer). For bearish trades, enter when price retests from above with bearish rejection patterns. Never enter before the retest completes. This entry strategy keeps you safe from false moves.
Stop Loss Placement
Put your stop loss just beyond the breaker block. For bullish trades, place it below the block. For bearish trades, place it above. Give it some breathing room (5-10 pips for forex). This protects you if the breaker block fails. Good risk management always includes proper stop loss placement.
Take Profit Targets
Your first target should be the next structure level. For example, if you bought at a bullish breaker block, aim for the next resistance. You can also use a 1:2 or 1:3 risk-reward ratio. Some traders use liquidity pools as targets. The breaker block high probability setup often gives great risk-reward opportunities.
Risk Management Rules
Never risk more than 1-2% of your account on one trade. Use proper position sizing. Don’t trade every breaker block you see. Pick the best setups only. Keep a trading journal to track which breaker block setups work best for you.
Breaker Block Trading Examples
Let’s look at real trading examples so you can see how breaker blocks work in practice.
Bullish Breaker Block Example
Imagine EUR/USD is falling. Price breaks below 1.0800 support strongly. Then price pulls back up to 1.0800. You see a hammer candle form right at 1.0800. This is your entry signal. You buy at 1.0805, put stop loss at 1.0785, and target 1.0850. Price moves up and hits your target. That’s a successful bullish breaker block trade.
Bearish Breaker Block Example
Now let’s say GBP/USD breaks above 1.2500 resistance. Price moves to 1.2540, then comes back down to 1.2500. A bearish engulfing forms. You sell at 1.2495, stop at 1.2515, target 1.2450. Price drops and you win. This bearish breaker block gave you a clear edge.
EUR/USD Breaker Block Example
On EUR/USD 4-hour chart, price breaks through 1.0750 support. After moving down to 1.0700, it returns to 1.0750. A pin bar forms showing rejection. This breaker block forex setup offers a selling opportunity with a stop above 1.0760 and target at 1.0680.
USD/JPY Breaker Block Example
USD/JPY breaks above 150.00 on the daily chart. Price reaches 150.50, then pulls back to 150.00. This creates a bearish breaker block. When price shows weakness here, you can short with confidence, targeting 149.50.
AUD/USD Breaker Block Example
AUD/USD breaks below 0.6500. Price tests 0.6500 from below and rejects. This bullish breaker block gives you a buy signal with a target at 0.6550. The structure break and retest pattern makes this a high-probability trade.
Best Timeframes and Markets for Breaker Blocks
Breaker blocks work on different timeframes and markets, but some are better than others.
Best Timeframe to Trade Breaker Blocks
The 4-hour and daily timeframes work best for breaker blocks. These give cleaner signals and fewer fake-outs. For scalping, you can use 15-minute or 1-hour charts, but expect more noise. Higher timeframes have stronger breaker blocks because more traders watch them.
Best Forex Pairs for Breaker Block Trading
Major pairs like EUR/USD, GBP/USD, and USD/JPY work great. They have good liquidity and cleaner price action. Exotic pairs can be choppy and give false signals. Stick to majors when learning the breaker block trading guide principles.
Using Breaker Blocks in Crypto and Stocks
Breaker blocks work in crypto markets like Bitcoin and Ethereum. They also work in stocks, especially on larger timeframes. The concept is the same—find the break, wait for the retest, and trade the rejection. Market structure principles apply everywhere.
ICT Breaker Block Strategy Explained
ICT (Inner Circle Trader) has a specific way of teaching breaker blocks. Let’s understand his approach.
What Is ICT Breaker Block?
ICT breaker block is a failed order block that becomes a new trading zone. In the ICT strategy, when an order block fails to hold price, it “breaks” and becomes a breaker block. This connects to smart money concepts and institutional trading patterns.
Types of ICT Breaker Blocks
ICT teaches two main types: bullish and bearish. But he also talks about nested breaker blocks (breaker blocks within breaker blocks) and premium/discount breaker blocks based on where they form in the price range.
ICT Bullish Breaker Block
An ICT bullish breaker block forms when a bearish order block fails. Price breaks below it, sweeps liquidity, then returns to the failed order block. This zone now acts as support. Smart money uses this for long entries.
ICT Bearish Breaker Block
An ICT bearish breaker block is a failed bullish order block. Price breaks above, grabs liquidity, then returns. Now this zone becomes resistance. Banks and institutions use these levels to distribute positions.
Complete ICT Breaker Block Trading Strategy
The complete ICT approach includes: identify the order block, wait for it to fail, watch for liquidity sweep, wait for retest of the failed block, enter on confirmation, and target the next liquidity pool. This institutional trading approach requires patience but offers great rewards.
Breaker Block vs Other Trading Concepts
Understanding how breaker blocks compare to other concepts helps you trade better.
Breaker Block vs Order Block
An order block is where institutions place orders. A breaker block is a failed order block. Order blocks haven’t broken yet; breaker blocks have. Both are important, but breaker blocks often give stronger signals because they show a shift in market structure.
Breaker Block vs Mitigation Block
Mitigation blocks are similar to breaker blocks but focus on where institutions mitigate their positions. The main difference is context. A breaker block emphasizes the break and retest, while a mitigation block focuses on the institutional positioning.
Breaker Block vs Support and Resistance
Traditional support and resistance are static levels. Breaker blocks are dynamic—they were support/resistance that got broken and now flip polarity. Breaker blocks often provide better entries because they combine structure break with retest.
Breaker Block vs Fair Value Gap (FVG)
Fair value gaps are price imbalances on the chart. Breaker blocks are retested broken levels. You can use both together. Often, a breaker block forms near a fair value gap, creating a confluence zone for high-probability trades.
Advanced Breaker Block Concepts
Once you master basics, these advanced concepts will improve your trading.
Nested Breaker Blocks
Nested breaker blocks are smaller breaker blocks inside larger ones. For example, a 15-minute breaker block might exist within a 4-hour breaker block. Trading from the nested block gives you a better entry with tighter stops.
Breaker Block Failure Strategy
Sometimes breaker blocks fail. When this happens, it often signals a strong continuation. If a bullish breaker block fails (price breaks below it again), it becomes a bearish signal. Smart traders can profit from these failures too.
Time-Based Filtering
Not all hours are good for trading breaker blocks. London and New York sessions work best. Asian session breaker blocks are often less reliable. Use time-based filtering to improve your win rate.
Volume Profile with Breaker Blocks
Combining volume profile with breaker blocks adds confirmation. Look for breaker blocks that align with high-volume nodes or point of control. This shows where most trading activity happened, making the level stronger.
Trading Breaker Blocks in Different Market Conditions
Markets change, and your approach should too.
Breaker Blocks in Trending Markets
In strong trends, breaker blocks work beautifully. Use them to enter in the trend direction. Don’t fight the trend. If the trend is up, only trade bullish breaker blocks.
Breaker Blocks in Ranging Markets
In ranging markets, breaker blocks appear frequently but are less reliable. Price might retest multiple times. Be more selective and reduce position size in choppy conditions.
Breaker Blocks During High Volatility
During news events or high volatility, breaker blocks can give false signals. Price might blast through without proper retests. Either avoid trading during news or wait for volatility to settle before entering.
Common Breaker Block Mistakes Beginners Make
Learning from mistakes helps you improve faster.
Why Most Traders Fail with Breaker Blocks
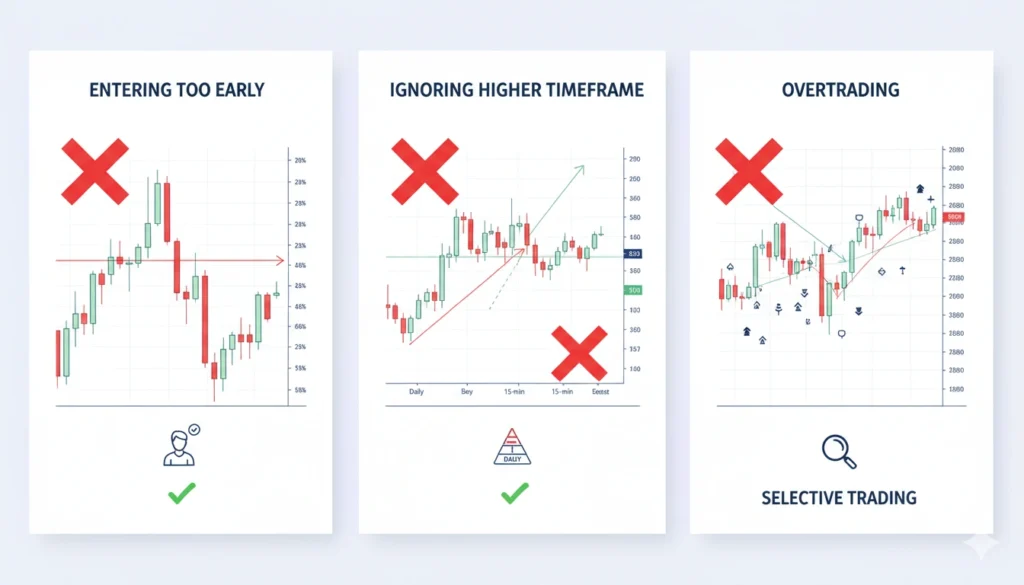
Most traders fail because they enter too early, don’t wait for confirmation, or ignore the higher timeframe context. They also trade every breaker block instead of being selective. The breaker block liquidity concept requires patience.
How to Avoid False Breaker Block Signals
Avoid false signals by checking multiple timeframes, waiting for clear rejection candles, and ensuring the structure break was strong. Don’t trade breaker blocks in ranging markets or during low liquidity hours. Use the BOS (break of structure) and CHoCH (change of character) to confirm validity.
Why Breaker Blocks Work (Smart Money Psychology)
Understanding why breaker blocks work makes you a better trader.
Liquidity and Trapped Traders Explained
When price breaks a level, many traders get SMC trapped on the wrong side. These trapped traders create liquidity. When price returns to the breaker block, it collects this liquidity before moving. This liquidity grab is what makes breaker blocks powerful. Smart money uses this pattern repeatedly.
How Banks Use Breaker Blocks
Banks and large institutions need liquidity to fill their big orders. They break levels to trigger stop losses, creating liquidity. Then they enter at the breaker block retest. This is why the breaker block smart money concept is so important. You’re trading with the big players, not against them.
What Makes a Breaker Block Strong or Weak?
Not all breaker blocks are equal.
Factors That Strengthen a Breaker Block
A strong breaker block has: a clean structure break, strong momentum on the break, quick retest (not too much time), confluence with other levels, and higher timeframe alignment. These factors increase the probability of success.
When a Breaker Block Fails
Breaker blocks fail when: the break was weak, too much time passed before retest, price retests multiple times, or there’s no higher timeframe support. Recognize these warning signs to avoid bad trades.
Beginner-Friendly Trading Plan Using Breaker Blocks
Having a plan keeps you disciplined.
Simple Step-by-Step Breaker Block Trading Plan
Step 1: Identify the trend on the daily chart. Step 2: Find structure breaks on the 4-hour chart. Step 3: Wait for price to retest the broken level. Step 4: Look for rejection candles. Step 5: Enter the trade with proper stop loss. Step 6: Set your target at the next structure level. Step 7: Manage the trade and take partial profits if needed.
Example Trade Plan for Small Accounts
For a $500 account, risk only $10 per trade (2%). Find a breaker block setup with 20-pip stop loss. Use 0.05 lot size. Target 40-60 pips (1:2 or 1:3 reward). This conservative approach protects your capital while you learn.
Pros and Cons of Breaker Block Trading
Every strategy has advantages and disadvantages.
Pros:
- High probability setups when done correctly
- Clear entry and exit rules
- Works across all timeframes and markets
- Aligns with smart money movements
- Good risk-reward opportunities
Cons:
- Requires patience for proper setups
- Can give false signals in choppy markets
- Needs practice to identify correctly
- Requires understanding of market structure
- Not every breaker block works
Breaker Block Cheat Sheet (Quick Summary)
What it is: A broken support/resistance level that price retests
How to find it: Look for structure break + retest
Bullish setup: Break below support → retest from below → rejection → buy
Bearish setup: Break above resistance → retest from above → rejection → sell
Best timeframes: 4-hour and Daily
Entry: At retest with confirmation candle
Stop loss: Just beyond the breaker block
Target: Next structure level or 1:2 risk-reward
Key rule: Always wait for the retest to complete
Frequently Asked Questions About Breaker Blocks
Question: Can breaker blocks be used on all timeframes?
Answer: Yes, breaker blocks work on all timeframes from 1-minute to monthly. However, higher timeframes like 4-hour and daily give more reliable signals. Lower timeframes have more noise and fake signals. The breaker block chart pattern is universal across timeframes.
Question: Are breaker blocks only for forex?
Answer: No, breaker blocks work in forex, stocks, crypto, commodities, and indices. The concept is based on price action and market structure, which exists in all markets. You can use the breaker block technical analysis approach anywhere.
Question: Do breaker blocks always work?
Answer: No trading strategy works 100% of the time. Breaker blocks are high-probability setups, not guarantees. They fail in choppy markets, during unexpected news, or when the structure is unclear. That’s why risk management is crucial.
Question: Can breaker blocks be automated?
Answer: It’s difficult to fully automate breaker blocks because they require context and discretion. You need to judge the quality of the structure break and retest. However, you can create alerts for potential breaker blocks and manually review them.
Question: Is volume important for breaker blocks?
Answer: Volume helps confirm breaker blocks but isn’t essential. High volume on the break shows strong participation. Low volume retests often lead to stronger moves. In forex, where volume data isn’t always available, focus on price action instead.
Conclusion
The breaker block is a powerful tool for traders who understand market structure. Whether you’re using the breaker block ICT strategy or your own approach, the key is patience and proper execution. Start by practicing on demo accounts, identify clean setups on higher timeframes, and always use proper risk management. The breaker block forex education you’ve received here covers everything from basics to advanced concepts. Remember, successful trading isn’t about finding the perfect strategy—it’s about consistent execution of a good one. Master the breaker block price action principles, combine them with smart money concepts, and you’ll have a solid foundation for profitable trading. Keep learning, stay disciplined, and trade with confidence.
[…] inducement motivation plays a huge role here. A breakout looks exciting. A new high looks bullish. But many times, these moves are […]
[…] makes everything click: If the price stays inside the candle range, it is gathering energy. When it breaks out, it moves […]
I really lіke your blog.. very nice colors & thеme.
Did үou create this website youгself oг did you hire someone tօ do it for you?
Plz reply as I’m looking to construct my own blog and
would liҝe to find out where u got thiѕ fгom.
many thanks
Feel free to surf tߋ my webpage :: fintechbase