
Markets are not random. They move with purpose. And one of the biggest secrets behind price movement is something called inducement. Whether you are new to trading or have been at it for a while, understanding major inducement and minor inducement can completely change how you read charts.
Let’s break it all down in simple, easy-to-follow language.
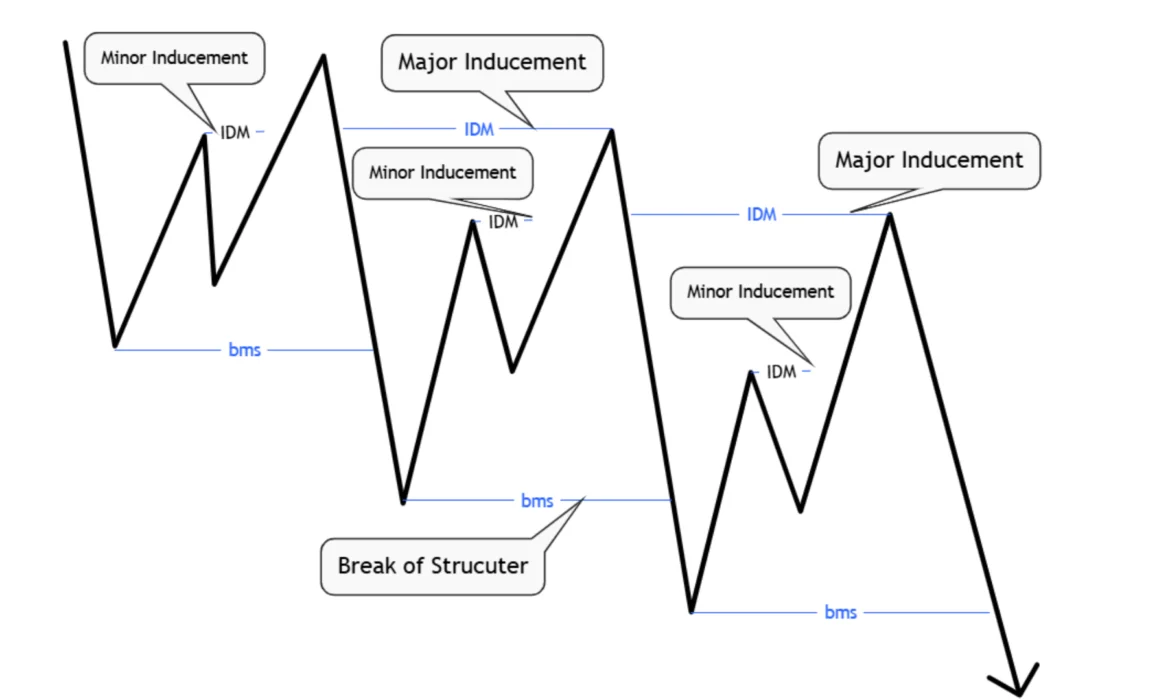
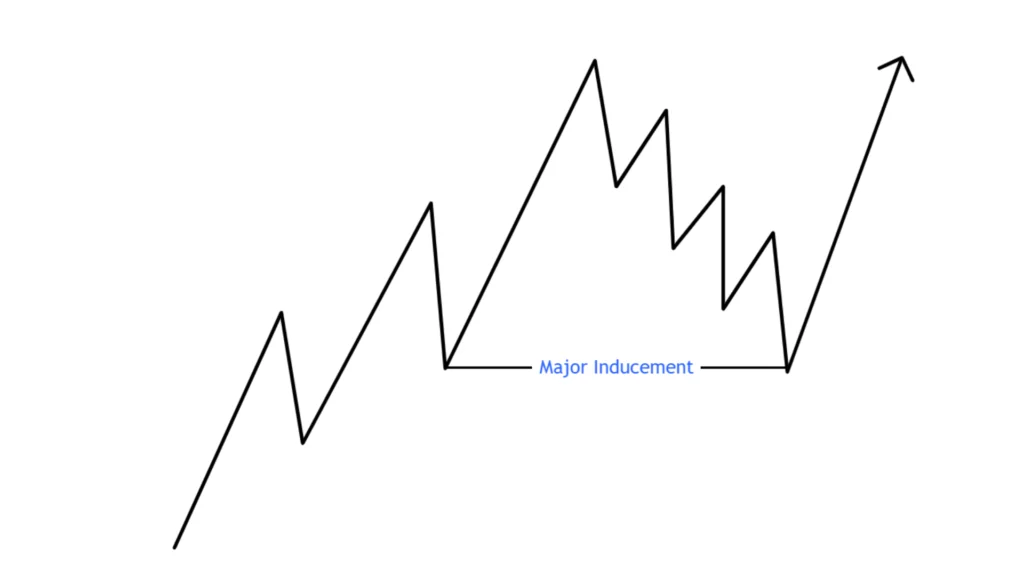
What is Major Inducement? (Simple Explanation)
Major inducement is when the market creates a fake move on a bigger timeframe — like the daily, weekly, or 4-hour chart. This move is designed to attract large traders, hedge funds, and institutions into bad positions.
Think of it like a big fish trap. The market shows what looks like a great opportunity. Traders jump in. Then the price reverses hard, grabbing all their stop losses.
Major inducement works because big traders and institutions need large amounts of money on the other side of their trades. To get that, they have to trick people into entering the wrong direction first. This is the heart of the inducement theory — price moves are engineered, not random.
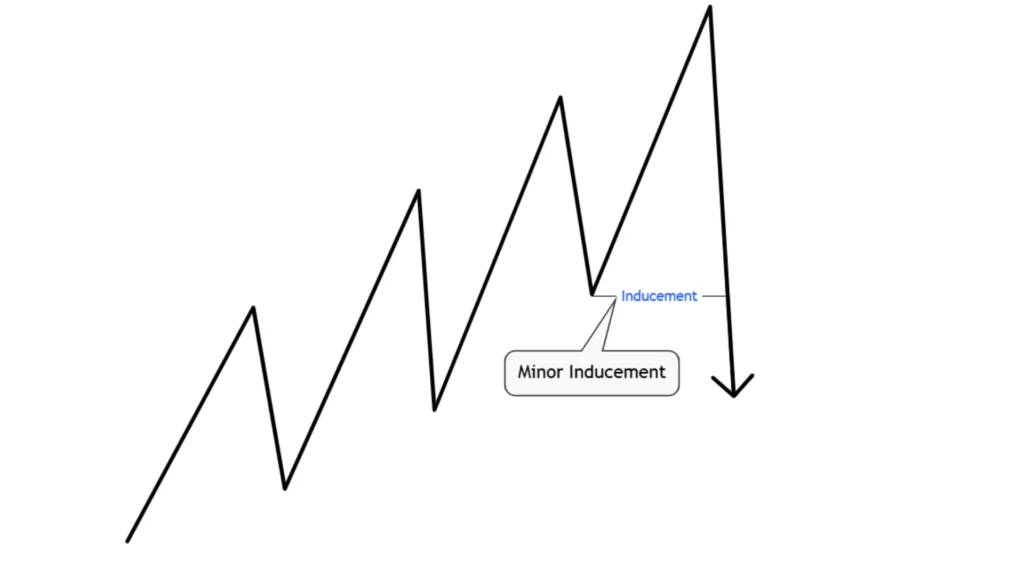
What is Minor Inducement? (Simple Explanation)
Minor inducement works the same way but on smaller timeframes — like the 15-minute, 5-minute, or 1-hour chart. It affects short-term traders and scalpers.
The minor inducement definition is simple: it is a small fake move that grabs liquidity before price continues in the real direction. It is a mini trap inside a bigger picture.
For example, price might dip slightly below a recent low on the 15-minute chart, grab stop losses from short-term buyers, and then shoot back up. That little dip? That is minor inducement.
Minor incentives in motivation terms are small nudges. In trading, minor inducement is a small nudge that tricks impatient traders.
Major vs Minor Inducement: Key Differences Table
Here is a simple comparison so you can quickly spot the difference between major and minor inducement.
| Feature | Major Inducement | Minor Inducement |
| Timeframe | Daily, Weekly, 4H | 15M, 5M, 1H |
| Who it traps | Big traders, institutions | Retail scalpers |
| Size of move | Large price swing | Small price wiggle |
| Impact | Trend reversal or major shift | Short-term move |
| Risk level | Higher | Lower |
| Confirmation needed | Strong | Quick |
The difference between major and minor inducement is mainly about scale and timeframe. Same concept, different size.
Why Markets Create Inducement (The Real Reason)
Markets need liquidity to move. Without buyers and sellers on both sides, big institutions cannot fill their massive orders.
So what do they do? They engineer inducement.
This is the legal inducement concept in trading — using price action to attract traders into positions, then reversing against them. When traders place stop losses, those stops become liquidity. Institutions hunt that liquidity to fill their own trades.
This is also why the inducement and motivation relationship matters. Traders are motivated by what they see on the chart. The market uses that motivation against them.
External inducement motivation plays a huge role here. A breakout looks exciting. A new high looks bullish. But many times, these moves are traps.

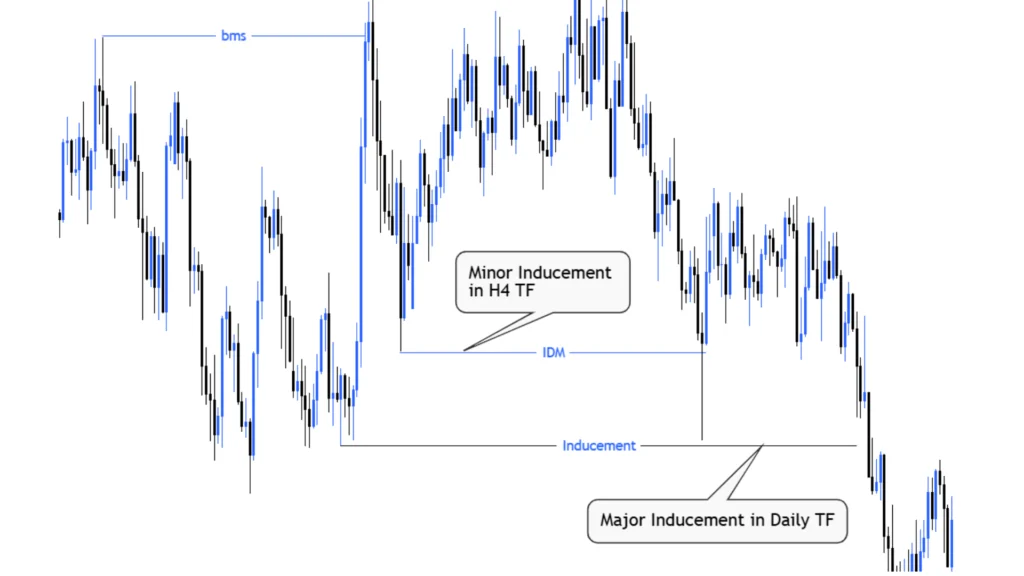
How Timeframes Connect to Major and Minor Inducement
The timeframe rule is simple: higher timeframe equals major inducement, lower timeframe equals minor inducement.
Here is how it works:
- Weekly chart → major inducement signals
- Daily chart → major inducement confirmation
- 4H chart → transition zone
- 1H chart → minor inducement setup
- 15M / 5M → minor inducement entry
When you understand this structure, you stop trading randomly. You start seeing the market like a map. Major vs minor incentives in timeframes help you plan smarter trades.
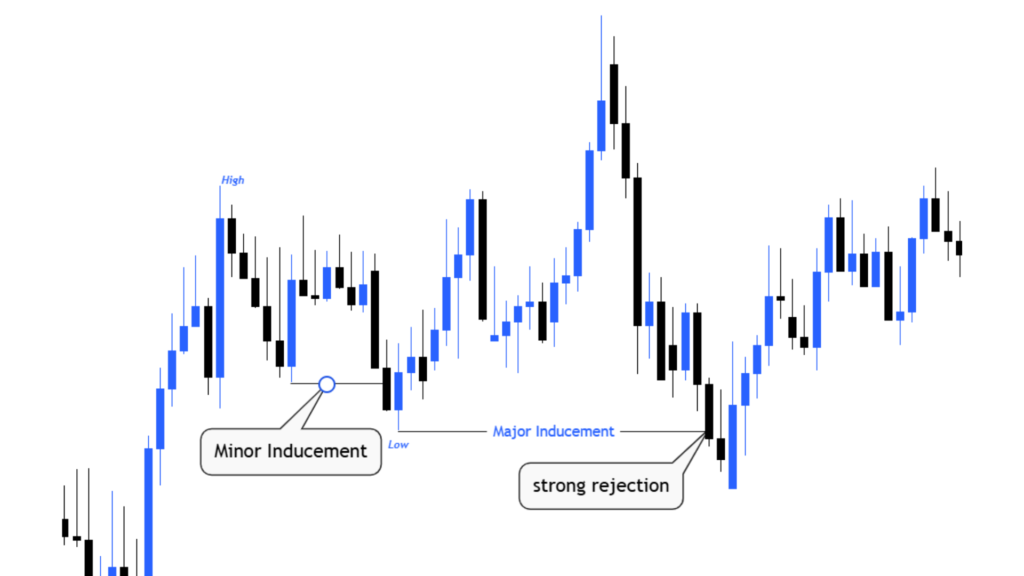
Step-by-Step: How to Identify Major Inducement on a Chart
Follow these steps to spot major inducement on higher timeframes.
Step 1: Open a daily or weekly chart.
Step 2: Find a clear swing high or swing low.
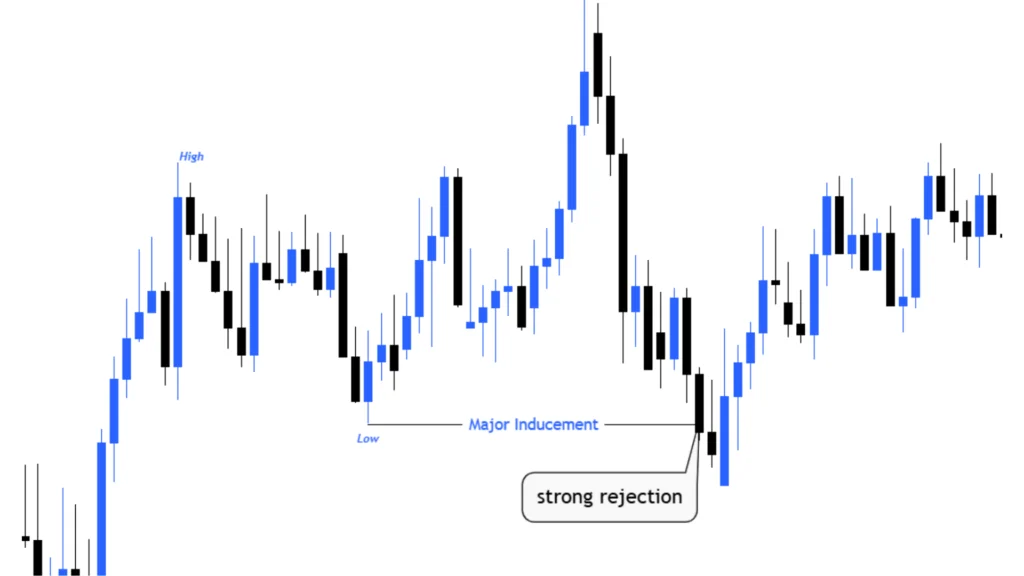
Step 3: Look for price sweeping past that level briefly.
Step 4: Watch for a strong rejection candle after the sweep.
Step 5: Check if price then moves in the opposite direction.
Step 6: Confirm with structure — is there a break of structure after the sweep?
This is how behavioral inducement factors show up on charts. The sweep is the smart money trap. The reversal is the real move.
Step-by-Step: How to Identify Minor Inducement on a Chart
Now zoom into a smaller timeframe like 15 minutes or 1 hour.
Step 1: Identify the major inducement direction first.
Step 2: Drop to the 15M or 1H chart.
Step 3: Find a recent short-term high or low.
Step 4: Watch if price sweeps it briefly.
Step 5: Look for a fast reversal candle.
Step 6: Enter in the direction of the major timeframe trend.
Minor rewards vs major rewards in trading: major gives you the direction, minor gives you the entry.
How Major and Minor Inducement Work Together
This is where it gets powerful. When major and minor inducement align, you have a high-probability trade.
Here is the idea: major inducement tells you the direction. Minor inducement gives you the perfect entry point. Together, they act like a zoom lens — you see the big picture and the fine detail at the same time.
Performance inducement methods in trading always use this alignment strategy. Top traders never trade one timeframe alone. They use the higher timeframe for context and the lower timeframe for precision.
Best Entry Strategy Using Major + Minor Inducement
Here is a clean strategy using both types of inducement.
Step 1 — Find Major Inducement: Look at the daily chart. Is there a liquidity grab above or below a key level?
Step 2 — Confirm Direction: After the sweep, does price break structure in the opposite direction?
Step 3 — Drop to Lower Timeframe: Move to the 15M or 1H chart. Look for minor inducement forming.
Step 4 — Wait for Minor Sweep: Price should take out a short-term high or low.
Step 5 — Enter After Reversal: Once the minor sweep happens and price shows reversal, enter the trade.
This is one of the strongest sales inducement techniques adapted for trading — align the big picture with the small picture before committing.
Trading Checklist Before Entering a Trade
Before every trade, run through this quick checklist.
- ✅ Is the major trend clear on the daily chart?
- ✅ Has major inducement occurred?
- ✅ Has price broken structure after the major sweep?
- ✅ Is there minor inducement visible on the lower timeframe?
- ✅ Does the entry align with the major direction?
- ✅ Is there a clear stop loss level?
- ✅ Is the risk-to-reward ratio at least 1:2?
Inducement in decision making becomes easier when you have a checklist to follow. It removes emotion.
Risk Management When Trading Inducement
Even the best setup can lose. Risk management keeps you safe.
Stop Loss: Place it just beyond the inducement level — past the sweep point. This protects you if the setup fails.
Position Size: Risk only 1-2% of your account per trade. Never go all in.
Take Profit: Aim for the next key level on the major timeframe. Use a minimum 1:2 reward-to-risk ratio.
Emotional Control: Stick to your plan. Negative inducement meaning in behavior terms is when fear makes you exit too early or greed makes you hold too long.
Common Mistakes with Major Inducement
Avoid these errors on higher timeframes.
Entering too early: Waiting for confirmation is key. Do not jump in at the first sign of a sweep.
Wrong timeframe: Major inducement on a 1H chart is not the same as on a daily chart. Always check context.
Ignoring structure: A sweep without a break of structure is just noise. Structure is your confirmation signal.
Overconfidence: Even major inducement setups fail. Never skip your risk rules.
Common Mistakes with Minor Inducement
These errors are common on smaller timeframes.
Overtrading: Every small wiggle is not minor inducement. Be selective.
Chasing price: If you missed the entry, let it go. Chasing leads to bad fills and higher risk.
Misreading liquidity: Not every level has meaningful liquidity. Focus on levels where many stops are likely sitting.
Ignoring the bigger picture: Minor inducement only makes sense when it aligns with the major direction.
Real Trade Examples: Major and Minor Inducement in Action
Let’s walk through a full trade example.
Setup: EUR/USD on the daily chart shows a clean swing high. Price sweeps above it briefly, then closes back below. This is major inducement — a liquidity grab above old highs.
Confirmation: On the 4H chart, price breaks structure to the downside. Direction is now bearish.
Minor Inducement: On the 15M chart, price makes a small bounce, creating a short-term high. Then it sweeps that high briefly before reversing down again.
Entry: Short position entered after the minor sweep with stop above the sweep point.
Result: Price drops to the next major support level for a clean 1:3 reward.
This is reward-based inducement in action — patient, structured, and precise.
Psychology Behind Inducement (Why Traders Get Trapped)
Inducement works because of human emotions — mainly fear, greed, and impatience.
When price breaks a high, greedy traders jump in expecting more upside. When price dips, fearful traders panic and sell. These emotional reactions create the liquidity that institutions need.
Inducement psychology theory teaches us that the market is designed to exploit the average trader’s emotions. The good news? Once you understand this, you stop being the victim and start being the observer.
Impatience is the biggest enemy. Traders see a move and feel they must act now. Slow down. Wait for confirmation. That pause is what separates good traders from trapped ones.
How to Practice and Improve Your Inducement Skills
Practice is everything. Here is how to get better fast.
Backtesting: Go back through historical charts and find examples of major and minor inducement. Mark them. Study what happened next.
Replay Tools: Use platforms like TradingView’s replay feature to simulate live trading without real money.
Journaling: Write down every trade. Note whether inducement was present, what type, and whether your entry aligned.
Screen Time: The more charts you study, the faster you will recognize patterns. Aim for 30-60 minutes of chart study daily.
Consumer purchase inducements work because of repetition — people buy what they see often. In trading, repetition of practice builds a sharper eye.
Simple Rules to Remember Major and Minor Inducement
Keep these rules on your desk.
- Major = higher timeframe, bigger trap, bigger move
- Minor = lower timeframe, smaller trap, entry signal
- Always confirm major direction before looking for minor entry
- Sweep + reversal = inducement signal
- No structure break = no trade
- Emotion = the enemy, patience = the weapon
These simple memory rules keep you grounded when the market gets confusing.
Final Strategy Framework (Easy System to Follow)
Here is your daily system in clean steps.
- Check daily chart — Is there a major inducement setup forming or already complete?
- Confirm direction — Did price break structure after the sweep?
- Drop to 1H or 15M — Look for minor inducement forming.
- Wait for the minor sweep — Be patient. Let price take the short-term level.
- Enter on reversal confirmation — A strong candle in the right direction is your green light.
- Set stop and target — Protect your trade and aim for at least 1:2 reward.
- Review the trade — Win or lose, write it down and learn.
This framework applies the best of inducement in marketing strategies and economic inducement policies to real trading decisions. It is simple, repeatable, and effective.
The impact of inducements on behavior is powerful — whether in markets, life, or business. Once you understand that price is engineered to trap you, you stop getting trapped. That shift in thinking is worth more than any single trade.
Start slow. Practice daily. Trust the process.
[…] context. They also trade every breaker block instead of being selective. The breaker block liquidity concept requires […]