

What Is YoY (Year Over Year)?
YoY stands for Year Over Year. It is a way to compare something from this year to the same thing from last year. Think of it like checking how much you grew taller compared to last birthday.
In finance, Year Over Year helps you see if a company, stock, or market is doing better or worse than before. It is one of the most used tools in trading and investing.
Why YoY Is Important in Trading and Finance
YoY is important because it gives you the big picture. Instead of looking at just one month, you look at a full year. This removes random ups and downs and shows you the real trend.
Traders and investors use year over year growth to decide if a company is worth buying. If a company keeps growing every year, that is a good sign.
How YoY Works in Trading
Comparing Current vs Previous Year
Year Over Year works by taking two numbers — one from this year and one from last year — and comparing them. You find the difference and then turn it into a percentage.
For example, if a stock’s earnings were $100 last year and $120 this year, the YoY growth is 20%. Simple.
Why Traders Use Yearly Comparison
Traders use YoY because monthly numbers can be misleading. One bad month does not mean a company is failing. But if a company is losing money year after year, that is a real problem.
Annual comparison smooths out seasonal changes. A toy company always sells more in December. Year Over Yearhelps you compare December to December — not December to January.
Real-Life Trading Perspective
Imagine you are looking at two companies. Company A grew its sales by 30% year over year. Company B dropped by 10%. Which one would you invest in? Most smart traders would choose Company A.

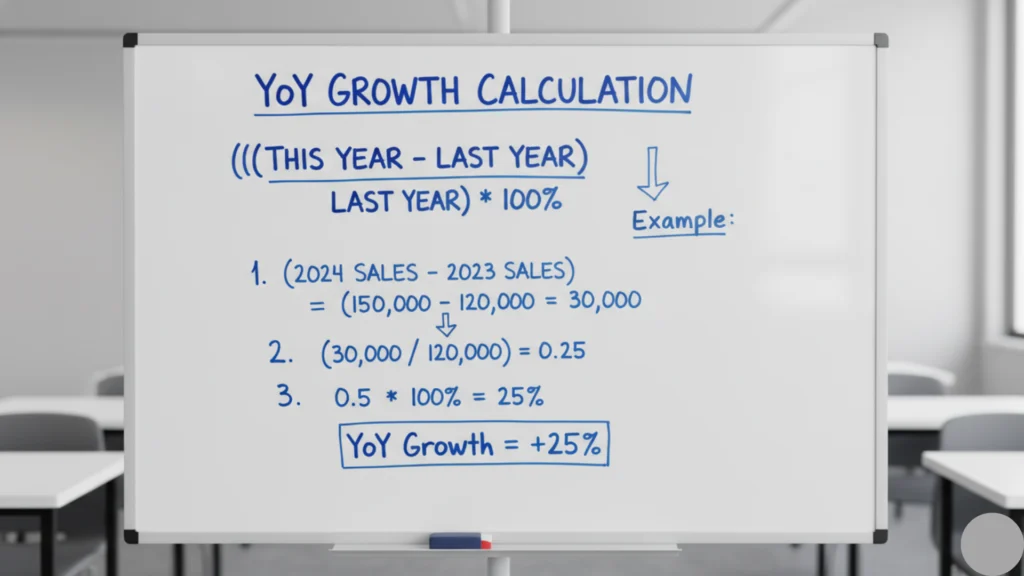
YoY Formula (With Simple Explanation)
YoY Formula Breakdown
The Year Over Year formula is very easy. Here it is:
YoY Growth (%) = ((Current Year Value − Previous Year Value) ÷ Previous Year Value) × 100
That is all. Just three steps.
Step-by-Step Calculation
- Take the current year value
- Subtract the previous year value
- Divide that number by the previous year value
- Multiply by 100 to get the percentage
Easy Example
Last year revenue: $200,000 This year revenue: $250,000
YoY = ((250,000 − 200,000) ÷ 200,000) × 100 YoY = (50,000 ÷ 200,000) × 100 YoY = 25%
The company grew by 25% year over year.
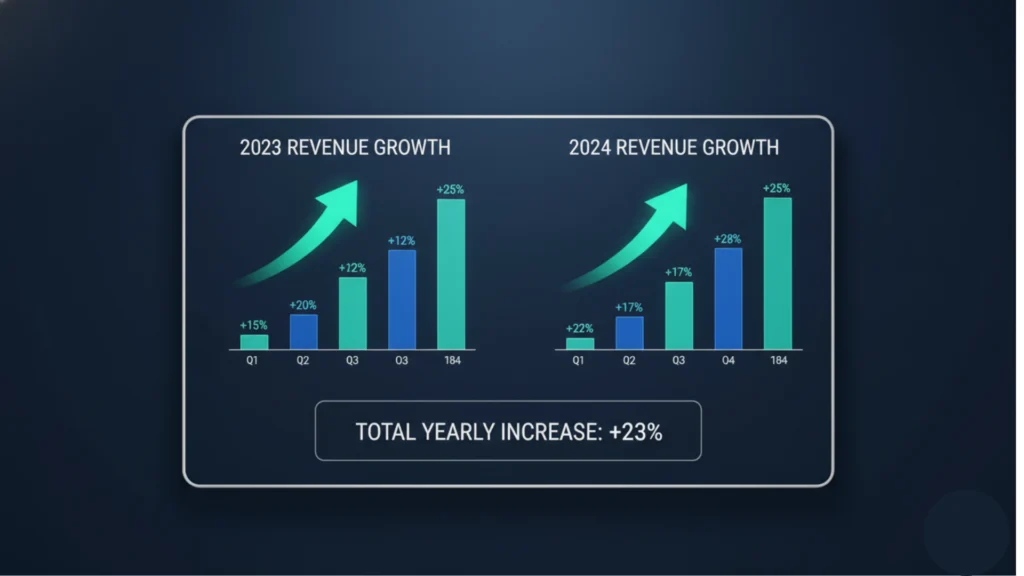
Year Over Year Growth Calculation Example
Example With Numbers
Let us say you are tracking a stock. The company earned $5 per share last year. This year it earned $6 per share.
YoY = ((6 − 5) ÷ 5) × 100 = 20% growth
Positive Growth Case
Positive Year Over Year means the company is growing. A 20% year over year increase is great. It tells you the business is getting stronger. Investors love positive Year Over Year numbers.
Negative Growth Case
Now imagine the company earned $5 last year but only $4 this year.
YoY = ((4 − 5) ÷ 5) × 100 = −20%
This is negative growth. It means the company made less money. This could be a warning sign for traders.
📊 Free YoY Calculator
YoY Growth Calculator
Crypto Price Checker
How to Use YoY in Stock Trading
Finding Strong Companies
When picking stocks, look for companies with consistent year over year revenue growth. If a company grows 15–25% every year, that is a strong signal. It shows stability and business health.
Revenue Growth Analysis
Revenue Year Over Year tells you if the company is selling more. Sales going up year after year means customers love the product. This is one of the first things serious traders check.
Profit Comparison
Revenue growth is good. But profit growth is even better. A company can sell more but still lose money. Always check if profits are also growing year over year. That is the real sign of a healthy business.
YoY in Crypto and Forex Trading
Crypto Yearly Growth Analysis
In crypto, YoY helps you see how much a coin has grown in one year. Bitcoin going from $20,000 to $60,000 in a year is a 200% Year Over Year gain. This kind of data helps long-term crypto holders make smart decisions.
Forex Market Long-Term Trends
In forex, Year Over Year is used to track how a currency has moved over one year. If the US dollar strengthened 8% against the Euro year over year, that tells a lot about economic trends.
Volatility Consideration
Crypto and forex are very volatile. Year Over Year gives a better picture than daily or weekly changes. But always combine it with other tools. One good year does not mean the next will be the same.

YoY in Fundamental Analysis
Revenue (Sales Growth)
Fundamental analysts use Year Over Year to check if a company’s sales are growing. Strong year over year sales growth means the business is expanding. This is a key metric before buying any stock.
Earnings (Profit Growth)
Earnings per share (EPS) growing Year Over Year is one of the best signs of a healthy company. Many top investors only buy stocks with strong and consistent earnings growth year after year.
Company Performance Tracking
By tracking multiple years of data, you can spot trends. Is the company growing faster or slower? Is it consistent? YoY gives you this complete performance picture quickly.
What Is a Good Year Over Year Growth Rate?
Positive vs Negative Growth
Any positive YoY is better than negative. Even 5% growth means the company is moving forward. Negative YoY means things are going backward. Always watch for two or more years of negative Year Over Year — that is a red flag.
Industry-Based Variation
A good YoY rate depends on the industry. Tech companies might grow 30–50% per year. Banks might grow 5–10%. Always compare a company’s YoY to others in the same industry.
Beginner-Friendly Explanation
If you are new to trading, think of it this way. 10–20% Year Over Year growth is solid. Over 25% is excellent. Under 0% means something is wrong. Use this as your starting guide.
YoY vs MoM vs QoQ (Simple Comparison)
Year Over Year (Yearly)
YoY compares year to year. Best for long-term analysis. Removes seasonal effects. Used by investors and fundamental analysts.
MoM (Monthly)
MoM means Month over Month. It compares this month to last month. Good for spotting fast changes. Used in short-term analysis and reporting.
QoQ (Quarterly)
QoQ means Quarter over Quarter. It compares one 3-month period to the previous one. Companies report earnings every quarter, so QoQ is very popular with stock traders.
When to Use Each
Use Year Over Year for big-picture, long-term decisions. Use QoQ for quarterly earnings analysis. Use MoM for short-term trends and fast markets like crypto.
Advantages of YoY Analysis
Removes Short-Term Noise
Markets go up and down every day. Year Over Year removes all that noise. It shows you what really happened over a full year. That is much more reliable.
Shows Real Growth
Year over year numbers show true business performance. Not one lucky month or one bad week. Real, meaningful growth or decline.
Useful for Long-Term Traders
If you invest for months or years, Year Over Year is your best friend. It helps you find companies that grow consistently. That is how long-term wealth is built.
Limitations of YoY in Trading
Not Useful for Short-Term Trading
If you are a day trader or scalper, Year Over Year is useless. You need minute-by-minute data. Year Over Year is too slow for short-term strategies.
Ignores Recent Trends
YoY only looks at two points in time. It does not tell you what happened in between. A company could have crashed mid-year and recovered — YoY would miss that.
Needs Other Indicators
Never use Year Over Year alone. Always combine it with other tools like moving averages, P/E ratio, and cash flow data for a complete picture.
Common Mistakes Traders Make with YoY
Relying Only on YoY
Some beginners look at Year Over Year and make decisions right away. That is risky. Year Over Year is one tool, not the whole toolbox.
Ignoring Market Conditions
A company might show negative Year Over Year during a recession. That does not mean it is a bad company. Always check what was happening in the overall market that year.
Misreading Negative Growth
Negative Year Over Year is not always a disaster. Sometimes a company spends more to grow faster. Short-term losses can lead to long-term profits. Always look deeper.
Pro Tips to Use YoY Like a Smart Trader
Combine With Technical Analysis
Use Year Over Year for the fundamental side. Use charts and technical indicators for the timing side. Together, they make a powerful strategy.
Use With Other Metrics
Pair YoY with P/E ratio, debt levels, and cash flow. This gives you a 360-degree view of a company’s health.
Always Check Multi-Year Data
One year of great YoY could be luck. Look at 3 to 5 years of Year Over Year data. Consistent growth over multiple years is the real gold.
When NOT to Use YoY
Day Trading / Scalping
If you buy and sell within hours or minutes, forget Year Over Year. You need real-time data and short-term indicators.
Highly Volatile Assets
For meme coins or super-volatile stocks, yearly data can be completely misleading. Use shorter timeframes instead.
Short-Term Decisions
Making a trade that lasts a few days? YoY will not help you here. It is built for patience and long-term thinking.
FAQs About Year Over Year
Question: What Does YoY Mean in Simple Words?
Answer: Year Over Year means comparing this year’s number to last year’s number. It shows if things got better or worse over one year.
Question: How Do You Calculate YoY Growth?
Answer: Use this formula: ((Current Year − Previous Year) ÷ Previous Year) × 100. The result is your YoY percentage.
Question: Is Year Over Year Important for Trading?
Answer: Yes, especially for long-term traders and investors. It helps you find strong, growing companies and avoid weak ones.
Question: What Is a Good Year Over Year Percentage?
Answer: It depends on the industry. Generally, 10–20% is good. Above 25% is excellent. Negative Year Over Year is a warning sign that needs investigation.
Conclusion
YoY is one of the most powerful tools in trading and finance. It gives you a clear, clean look at how something has grown or shrunk over one full year. For long-term traders and investors, year over year analysis is essential.
But remember — no single tool is perfect. Always combine Year Over Year with technical analysis, other financial metrics, and market context. Use it as part of your full trading strategy, not as your only decision-maker.
When used smartly, Year Over Year can help you find strong stocks, avoid weak companies, and make smarter, more confident trading decisions. Start using it today and level up your trading game.