
What is Candlestick Range Theory (CRT) in Trading?
Simple Meaning of CRT
CRT stands for Candlestick Range Theory. It is a way to read price movement using candles on a chart. Each candle tells a story. CRT helps you understand that story.
Think of a candle like a battleground. Buyers and sellers fight inside it. CRT shows you who won and what will happen next.
Why Traders Use It
Traders use CRT because it gives them a clear picture of what big players are doing. It helps them stop guessing and start trading with logic. When you understand types of CRT trading, you trade smarter, not harder.
How It Works in the Market
The market moves in a pattern. It collects orders, tricks small traders, and then moves in the real direction. CRT helps you see this pattern before it completes.
Understanding the Candlestick Range
What is a Candlestick Range
A candlestick range is simply the space between the highest and lowest price of a candle. Imagine a rubber band stretched between two points. That stretch is the range.
High, Low, Open, Close
Every candle has four parts. The open is where price started. The close is where it ended. The high is the highest point it reached. The low is the lowest point. These four parts are the heart of candlestick range strategy.
Why Range Is Important
The range tells you how much price moved. A big range means strong movement. A small range means the market is quiet. In CRT trading, small ranges often come before big moves.
Universal Truths Behind CRT Trading
Price Moves in Phases
Price never just goes straight up or down. It always moves in three phases — rest, trick, and move. This is the foundation of smart money trading concepts.
Market Is Controlled by Big Players
Banks and institutions control the market. They have billions of dollars. They push price to collect orders before moving in their planned direction. Small traders often get caught in this trap.
Why Manipulation Happens
Big players need liquidity. They push price into areas where stop losses sit. This triggers small traders and fills the big orders. After that, the real move begins. This is market manipulation trading strategy in action.
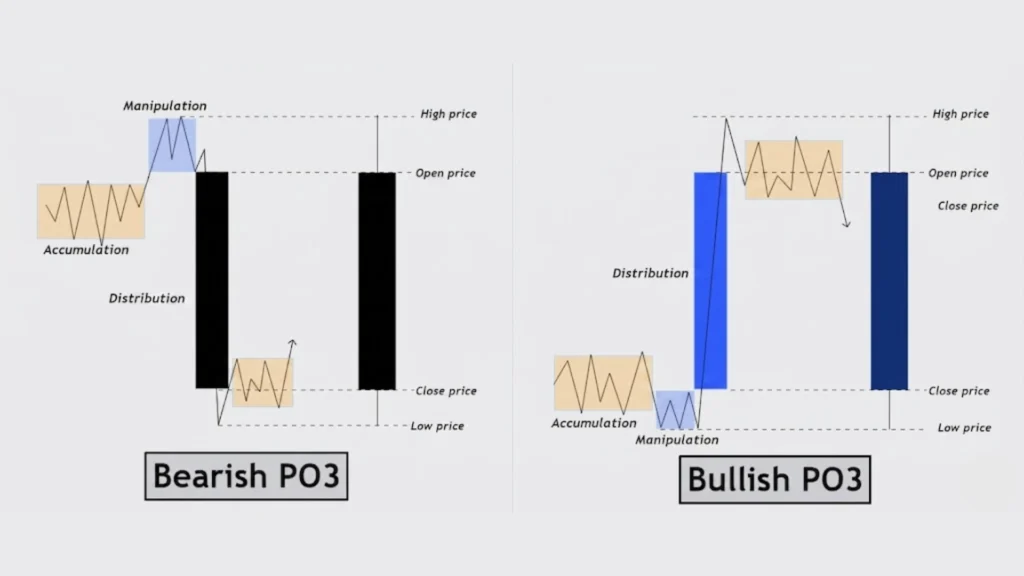
What is PO3 (Power of 3) in Trading?
PO3 means Power of 3. It describes the three phases every candle or price cycle goes through. Understanding PO3 is key to mastering types of CRT trading.
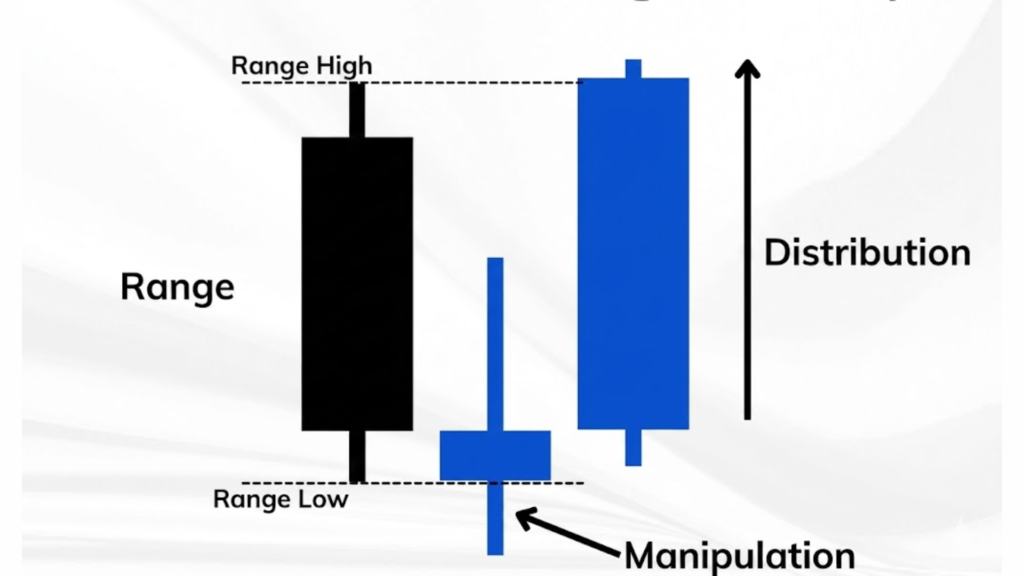
1. Accumulation Phase
This is the quiet phase. Price moves sideways. Big players are collecting their orders silently. Small candles form. Nothing seems to happen. But something big is building. In the forex accumulation phase explained simply — big money is loading up.
2. Manipulation Phase
This is the trick phase. Price suddenly moves in the wrong direction. It hits stop losses. Small traders panic and exit. This is the candlestick manipulation pattern at work. It looks like a breakout but it is fake.
3. Distribution Phase
This is the real move. After manipulation, price shoots in the true direction. Big players have their orders filled. Now they let price run. This is the distribution phase trading traders want to catch.
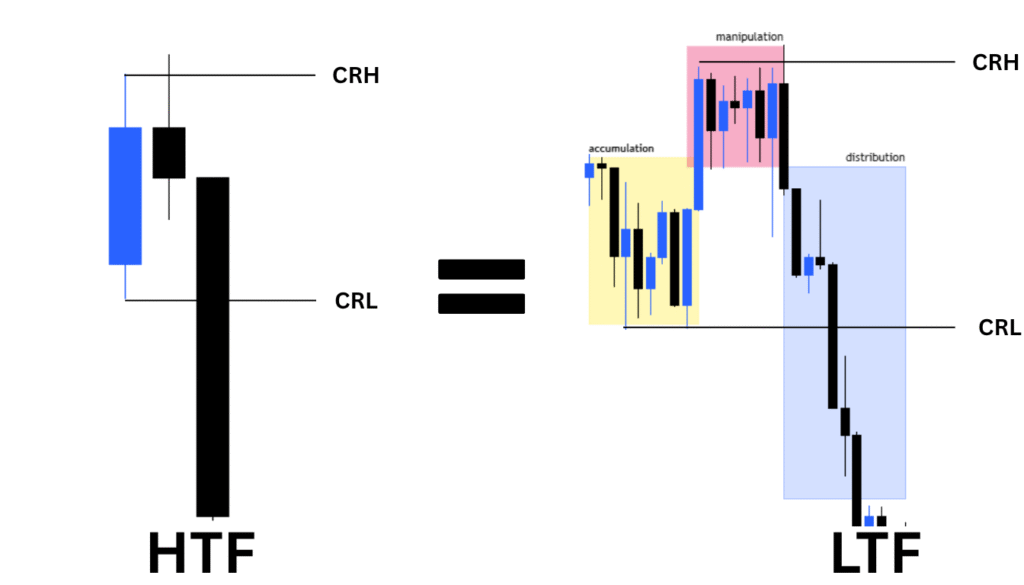
What is Candlestick Range Theory (CRT)?
How CRT Connects with PO3
CRT uses the PO3 idea but applies it to individual candles. Each candle has its own accumulation, manipulation, and distribution. This is how candlestick range theory trading works at the core.
Why CRT Is Powerful
CRT is powerful because it repeats on every timeframe. Whether you look at a 5-minute chart or a daily chart, the same pattern appears. This makes it one of the most reliable price action CRT strategies available.
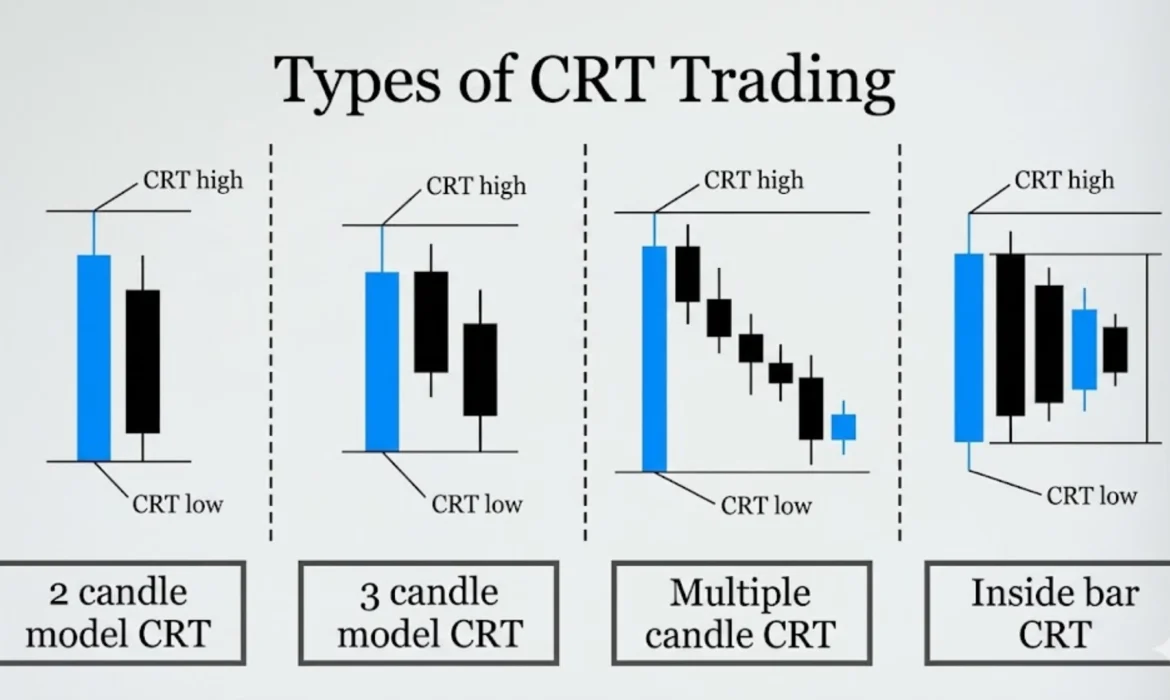
Types of CRT Trading
This is the most important section. Let us break down all the main types of CRT trading clearly.
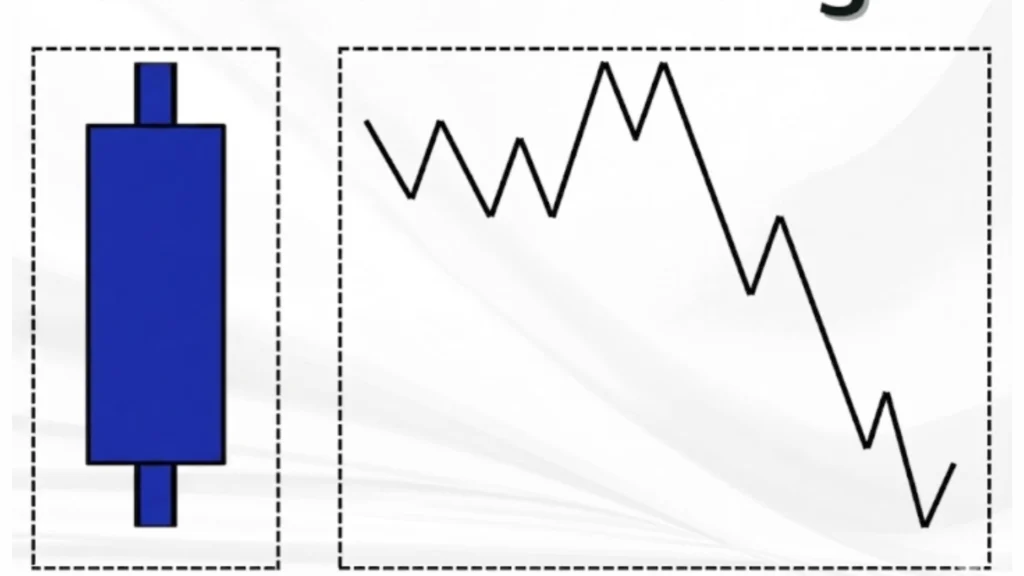
1. Single Candle CRT
In this setup, one candle does everything. It shows accumulation at the open, manipulation at the wick, and distribution at the close. It is the most basic CRT trading pattern. Great for quick decisions. Single candle trading setup is perfect for fast markets.
2. Multi-Candle CRT
Here, multiple candles form the three phases together. For example, five small candles form accumulation. One big wick candle is manipulation. Then a strong move completes distribution. Multi candle trading strategy gives more time to confirm the trade.
3. Intraday CRT Trading
Intraday CRT trading means you open and close trades within the same day. You look at the 15-minute or 1-hour chart. You spot the phases within the daily session. This is great for traders who want quick results. The intraday CRT trading strategy is popular among active forex traders.
4. Swing CRT Trading
Swing CRT trading uses higher timeframes like the 4-hour or daily chart. Trades last for days or even weeks. This type suits traders who cannot watch screens all day. Swing trading CRT method gives bigger profit targets and more breathing room.
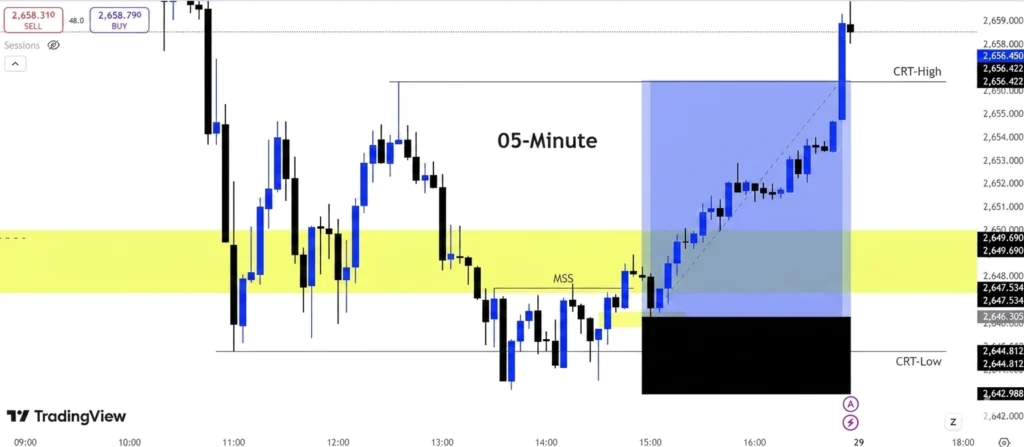
How CRT Looks on a Chart
Reading CRT on a real chart is simple once you know what to look for.
Small candles mean accumulation. Price is resting. Then one candle shoots up or down to grab liquidity. That is manipulation. After that, a strong clean candle forms and moves in the real direction. That is distribution. The whole structure is the power of 3 trading strategy in visual form.
Step-by-Step Example of CRT Trading
Step 1: Identify Accumulation
Look for a zone where price moves sideways with small candles. This means big players are loading orders.
Step 2: Wait for Manipulation
Watch for a sharp spike that breaks a recent high or low. This is the fake move. Do not trade it. Wait.
Step 3: Enter in Distribution
When price reverses from the manipulation spike and starts moving strongly, that is your entry. This is the highest probability zone in CRT trading examples.
Step 4: Exit Strategy
Place your target at the next liquidity zone or swing high/low. Use a clear CRT entry and exit strategy with defined levels before you enter.
How to Trade the Candlestick Range Theory
Entry rules are simple. Wait for manipulation to complete. Look for a strong reversal candle. Enter at the close of that candle.
Exit rules follow market structure. Target the next significant level. Use the previous high or low as a guide.
Confirmation signals include a Fair Value Gap, a strong rejection wick, or a close above the manipulation high in how to trade candlestick range theory correctly.
Best Timeframes for CRT Trading
1H vs 4H vs Daily
The 1-hour chart is great for intraday CRT trading. The 4-hour chart is best for swing CRT trading. The daily chart gives the clearest picture of phases.
Which One Is Best for Beginners
For beginners, the 4-hour chart is recommended. It gives enough time to think. It reduces noise. It makes CRT trading for beginners much easier to apply.
Risk Management in CRT Trading
Always use a stop loss. Place it just beyond the manipulation wick. This keeps your loss small if the trade fails.
Risk only 1% to 2% per trade. Never risk more. Protecting your capital is more important than any single trade. Good risk management is what separates winners from losers in advanced forex trading strategies.
Common Mistakes in CRT Trading
Entering too early is the biggest mistake. Wait for manipulation to fully complete. Jumping in during the manipulation phase leads to stop-outs.
Ignoring market structure is also dangerous. Always check the bigger picture before entering. Overtrading kills accounts. Take only the best setups.
CRT vs Normal Trading (Simple Comparison)
Normal trading reacts to price. CRT trading anticipates price. Normal traders see a breakout and buy. CRT traders see a breakout and wait for the fake-out.
CRT can be more effective because it follows how big players actually operate. It aligns you with smart money concepts forex instead of fighting it.
How CRT Connects with ICT Concepts
CRT and ICT trading strategy basics share the same roots. Both focus on liquidity and manipulation.
Fair Value Gap (FVG) often forms during the distribution phase. It acts as a magnet for price. Order blocks form during accumulation. They are strong support and resistance zones. Liquidity zones are where manipulation targets. Knowing these makes your CRT trading checklist stronger.
CRT Trading Checklist (Before You Enter a Trade)
Before entering, confirm the accumulation phase is clearly visible. Then confirm manipulation has completed with a strong wick. Check if price has returned inside the range. Set your stop loss beyond the wick. Set your target at the next liquidity level. This is your complete CRT trading checklist.
When NOT to Use CRT Trading
Do not trade CRT during high-impact news events. Price becomes unpredictable. Avoid sideways markets where no clear phases form. If market structure is unclear, skip the trade. Patience is a strategy too.
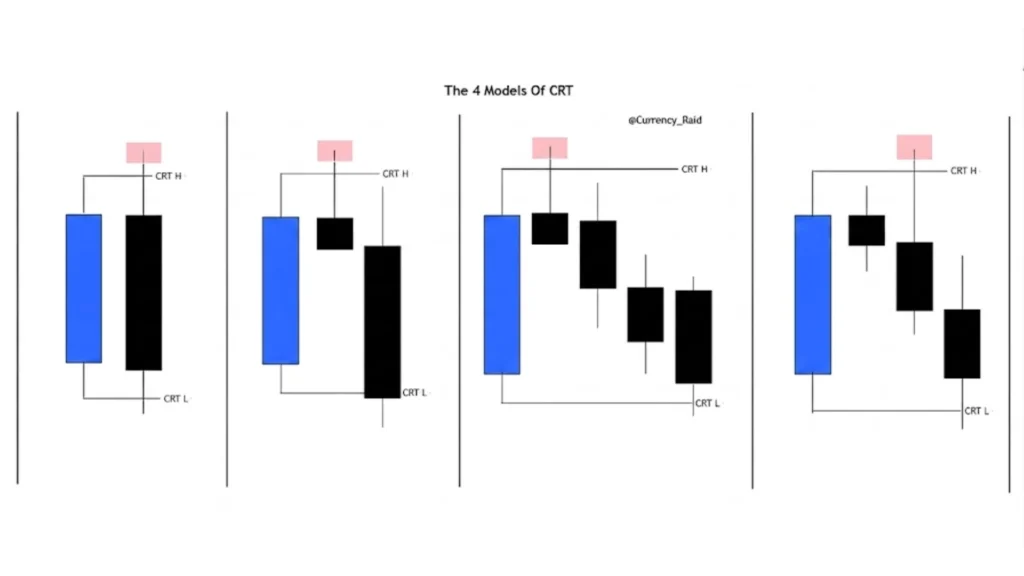
Types of CRT Candlestick Models
There are several CRT models used by traders. The basic single-candle model is the most common. The nested model uses a candle inside a larger candle’s range. The session model applies CRT to entire trading sessions like London or New York. Each model follows the same PO3 logic. Learning these forex CRT models adds depth to your trading.
Related ICT Concepts You Should Learn
ICT Hidden Order Block
A hidden order block is a small candle inside a larger move. It often acts as a strong reentry zone. It connects closely with accumulation in CRT.
ICT Fair Value Gap
A Fair Value Gap is a price imbalance on the chart. Price tends to return to fill it. In CRT, the FVG often forms during the distribution move.
ICT Reversal Patterns
These are specific candle formations that signal a change in direction. They often appear at the end of the manipulation phase in CRT.
ICT Suspension Block
A suspension block is a zone where price pauses before continuing. It is often found at the start of accumulation. Understanding ICT and CRT trading connection makes both concepts more powerful.
Frequently Asked Questions (FAQs)
Question: Is CRT trading good for beginners?
Answer: Yes. CRT trading for beginners is simple to learn. Start with the 4-hour chart and focus on spotting the three phases.
Question: Can I use CRT in crypto or gold?
Answer: Absolutely. CRT works on any liquid market including crypto, gold, indices, and CRT forex trading.
Question: How long does each phase last?
Answer: There is no fixed time. Accumulation can last hours or days. Manipulation is usually fast. Distribution depends on momentum.
The Bottom Line
CRT is one of the most logical trading strategies out there. It teaches you to think like big players. You stop reacting and start anticipating. The types of CRT trading — single candle, multi-candle, intraday, and swing — all follow the same three phases. Learn them well and your trading will transform.
Do You Want to Succeed in Trading?
Success in trading is not about luck. It is about learning, practicing, and being patient. CRT gives you a framework. But you must put in the screen time to master it.
Start with demo trading. Watch the phases form. Journal your trades. Learn from your mistakes. Forex market structure trading rewards those who study and stay consistent. The market will always be there. Your job is to keep improving every single day.