
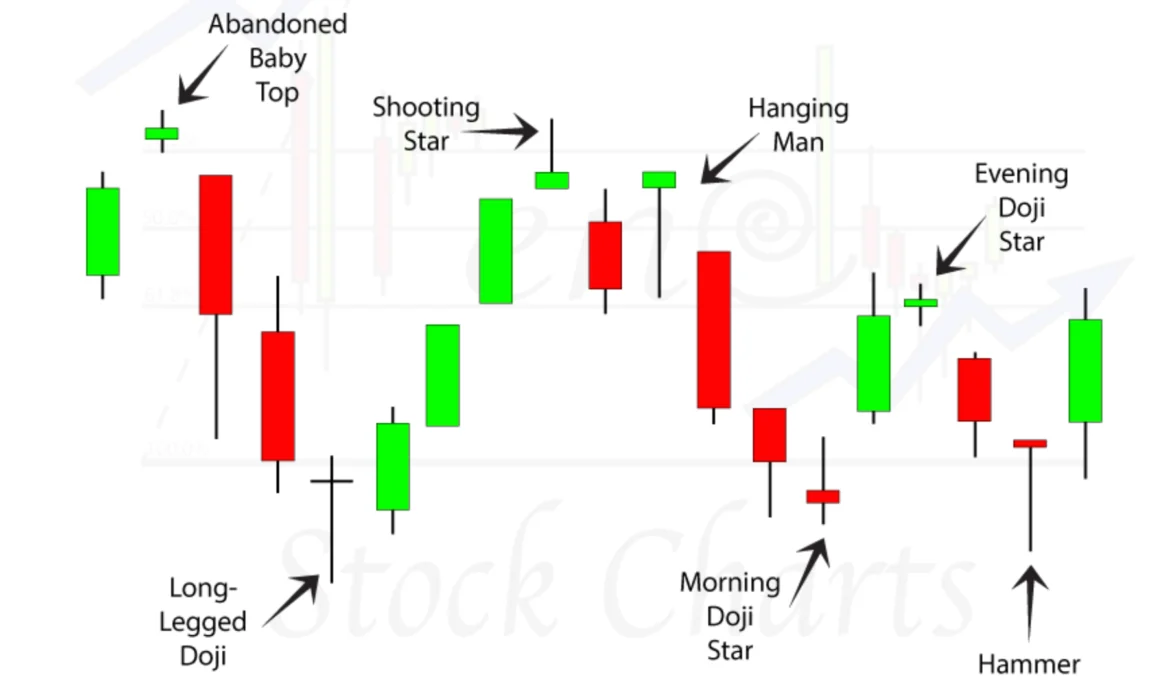
Shooting Star Candlestick: How Smart Traders Catch the Top
What is a Shooting Star Candlestick?
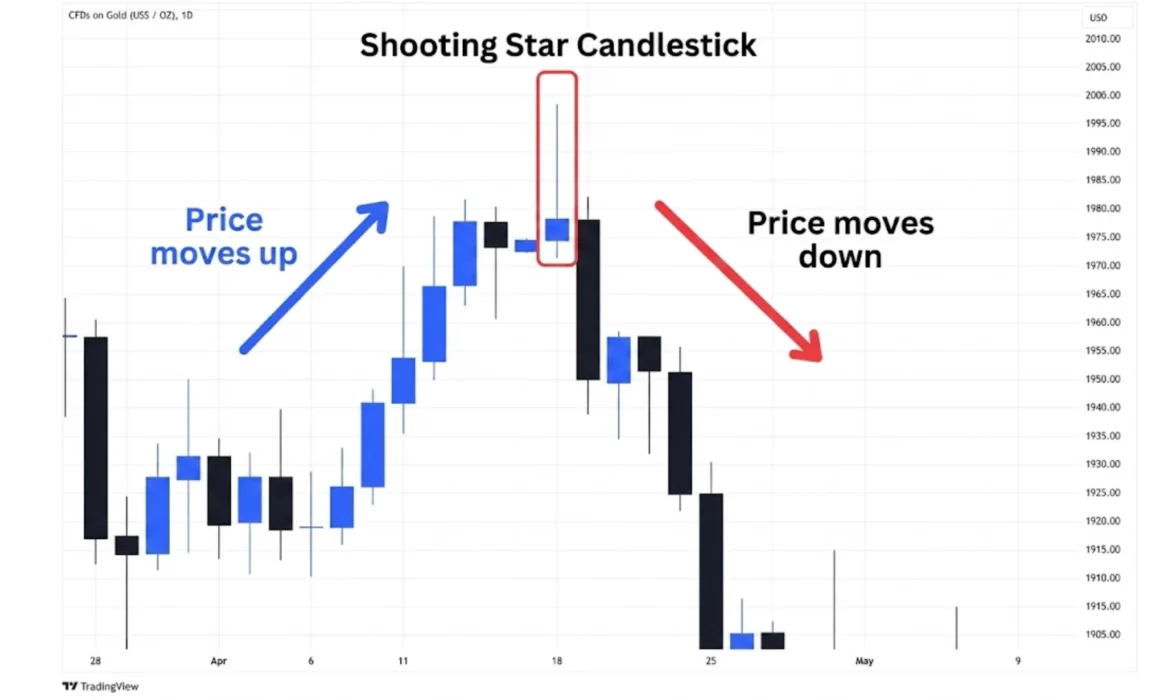
Have you ever seen a star fall from the sky? In trading, a shooting star candlestick works almost the same way. It shows that prices tried to go up really high — but then fell right back down.
It is a single candle that forms on a price chart. Traders use it to spot when a market might stop going up and start falling. It is one of the most popular bearish reversal candlestick patterns in technical analysis.
Think of it like this: buyers pushed the price way up during the session. But then sellers came in strong and pushed it back down. The market rejected the higher price. That rejection is what the shooting star candle shows.
Shooting Star Candlestick Meaning (In One Line)
A shooting star candlestick is a bearish reversal signal that forms after an uptrend, showing that buyers lost control and sellers took over.
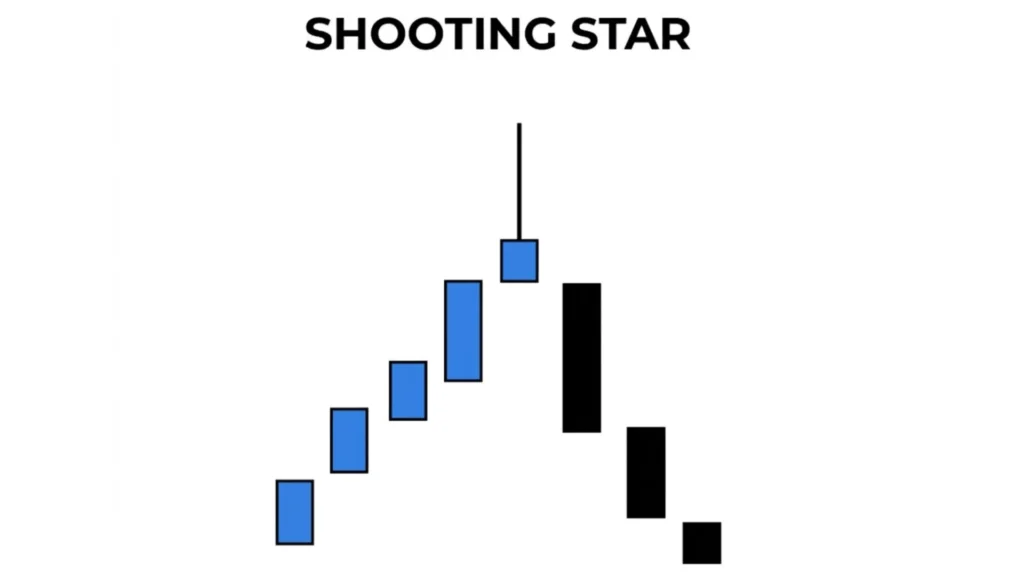
Parts of a Shooting Star Candlestick (Easy Breakdown)
Small Body
The body of the candle is very small. It sits near the bottom of the whole candle. The small body means the price opened and closed at almost the same level. Not much changed between the open and close price.
Long Upper Shadow
This is the most important part. The long upper shadow (or wick) sticks up high. It shows that buyers pushed the price up a lot — but sellers brought it all the way back down. The longer the upper wick, the stronger the bearish price rejection.
Little or No Lower Shadow
A proper shooting star candlestick has little to no lower shadow. If there is a big lower shadow, it may not be a valid shooting star. A clean candle with no lower wick is a stronger signal.
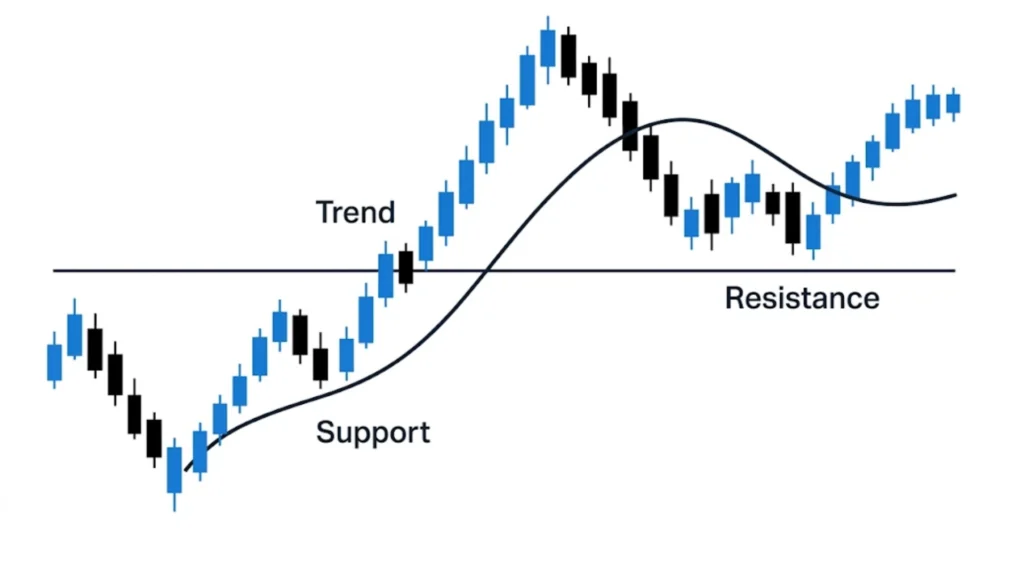
How to Identify a Shooting Star Candlestick on a Chart
Here is a simple checklist you can follow:
- The price must be in an uptrend before the candle forms
- The candle has a small body near the low of the session
- The upper shadow is at least two times longer than the body
- There is little or no lower shadow
- It forms near a resistance level or a recent high
- The candle looks like it tried to go up but got rejected
If your candle matches all these points, you likely found a valid shooting star candlestick pattern.
When Does a Shooting Star Candlestick Form?
After an Uptrend
A shooting star only makes sense after prices have been going up. If you see it in a downtrend or sideways market, it does not carry the same meaning. The uptrend gives context to the reversal signal.
Near Resistance Levels
Most valid shooting stars form near a resistance level. Resistance is a price area where selling pressure is strong. When a shooting star forms there, it adds extra power to the bearish signal. Traders know that the market has rejected that price zone before.
What Does a Shooting Star Tell? (Trader Psychology)
Here is the story behind the candle in plain simple words:
The market was going up. Buyers were excited and kept pushing prices higher. Then, at a high point, buyers tried one last big push. Prices shot up fast during the session.
But then something changed. Sellers saw the high price as a good opportunity to sell. They came in strong. They pushed prices all the way back down to where the session started.
By the end of the session, buyers had nothing to show for their big push. This shift in power — from buyers to sellers — is what the shooting star candle is telling you. It is a sign that the trend may reverse.
Red vs Green Shooting Star Candlestick
Many beginners ask: does the color matter?
Yes, it does — but not as much as the shape.
A red shooting star (bearish candle) means the price closed below the open. This is a stronger signal because sellers clearly won by the end of the session.
A green shooting star (bullish close) means the price closed slightly above the open. It is still valid, but a little weaker. The shape matters more than the color.
Both can work. But always prefer a red shooting star for a stronger bearish shooting star candlestick pattern signal.
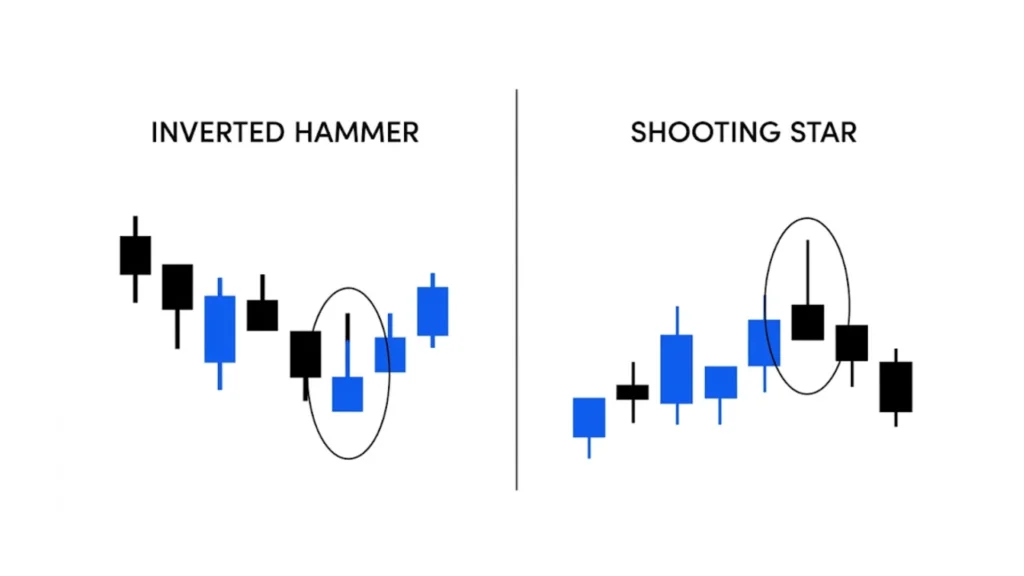
Shooting Star Candlestick vs Inverted Hammer (Key Differences)
These two candles look exactly the same. Same small body, same long upper wick, same little lower shadow. Beginners often confuse them. Here is how to tell them apart:
Shooting Star forms after an uptrend. It signals a bearish reversal. Price may go down.
Inverted Hammer forms after a downtrend. It signals a bullish reversal. Price may go up.
The location on the chart is the key difference. Same shape, opposite meaning. Always check the trend before deciding which one it is.
Shooting Star Candlestick vs Other Bearish Patterns
Bearish Engulfing
The bearish engulfing pattern uses two candles. A big red candle fully covers the previous green candle. It is a stronger and more obvious reversal signal. The shooting star candlestick is subtler but forms faster.
Evening Star
The evening star is a three-candle pattern. It shows a gradual shift from bullish to bearish. It is more reliable but takes longer to form. The shooting star gives the same message in just one candle.
How Accurate is the Shooting Star Pattern?
The shooting star is a solid pattern — but it is not perfect. On its own, studies suggest it has around 50–60% accuracy. That means it does not always work.
Its reliability increases when:
- It forms at a clear resistance level
- Volume is high on the shooting star candle
- The next candle confirms the reversal
- Other indicators support the signal
Never trade any pattern blindly. Always use confirmation.
Confirmation of Shooting Star (Very Important Step)
Next Candle Confirmation
Do not enter a trade the moment you see a shooting star candlestick. Wait for the next candle. If the next candle is a strong red (bearish) candle that closes below the shooting star’s body, that is your confirmation. This shooting star confirmation candle is very important.
Role of Volume
High volume on the shooting star candle shows strong selling pressure. It means more traders were involved in the rejection. A shooting star with volume spike is a much more reliable signal than one with low volume.
Best Timeframes to Use Shooting Star
Intraday vs Daily vs Weekly
Intraday (5-min, 15-min, 1-hour): Works for quick trades. More false signals. Good for experienced traders.
Daily chart: The most popular timeframe for the daily chart shooting star pattern. Signals are more reliable and widely followed.
Weekly chart: Very powerful. Fewer signals but very high accuracy. Great for swing and position traders.
Beginners should start with the daily chart. It gives the best balance of signal quality and trade opportunity.
How to Trade the Shooting Star Candlestick (Step-by-Step)
Entry
Wait for the confirmation candle to close. Once confirmed, enter a short (sell) trade at the open of the candle after confirmation.
Stop Loss
Place your stop loss for shooting star above the high of the shooting star candle. This protects you if the price keeps going up instead of falling.
Take Profit
Target the nearest support level below the entry. You can also use a 1:2 risk-to-reward ratio. For every $1 you risk, aim to make $2.
Simple Trading Example (Real Scenario)
Let’s say a stock has been rising for two weeks. It reaches $150, which is a known resistance level.
On that day, a shooting star forms. The price went up to $158 during the day but closed back at $151. Volume was high. The next day, a red candle closes at $147.
You enter short at $147. Stop loss at $159 (above the shooting star high). Take profit at $135 (support level).
This is a clean shooting star candlestick trading strategy in action. Simple, structured, and disciplined.
Best Indicators to Combine with Shooting Star
RSI
If the RSI shooting star setup shows RSI above 70 (overbought), the signal becomes much stronger. Overbought + shooting star = high-probability sell signal.
Moving Averages
If the price is far above a key moving average (like the 50 or 200 MA), it may be overextended. A shooting star there is a strong reversal warning.
Resistance Levels
Always mark key resistance zones. A resistance level shooting star is the best combination in price action trading.
Fibonacci
If the shooting star forms at a Fibonacci retracement level (like 61.8%), the signal is even stronger. Fibonacci shooting star trading is popular among advanced traders.
Risk Management for Shooting Star Trades
Stop-Loss Placement
Always place stop loss above the shooting star high. No exceptions.
Risk Percentage
Never risk more than 1–2% of your total account on one trade. Even the best patterns fail sometimes.
Trade Discipline
Stick to your plan. Do not move your stop loss out of fear. Exit at your target. Shooting star risk management is what separates profitable traders from losing ones.
When NOT to Trade a Shooting Star
- When the market is moving sideways (no clear trend)
- When there is no confirmation candle the next day
- When the upper wick is very short (weak signal)
- When volume is extremely low
- When major news events are coming soon
False shooting star signals are common in choppy markets. Avoid them.
Common Mistakes Traders Make
- Entering the trade too early, before confirmation
- Ignoring the overall trend direction
- Not placing a stop loss
- Trading it in a sideways market
- Overtrading every shooting star they see
- Ignoring volume data
- Skipping risk management rules
Advantages of the Shooting Star Candlestick Pattern
- Easy to spot even for beginners
- Works in all markets (forex, stocks, crypto)
- Clear entry, stop loss, and target rules
- Very powerful near resistance levels
- Works on all timeframes
Disadvantages of the Shooting Star Pattern
- Can produce false signals in weak trends
- Needs confirmation before trading
- Less reliable on lower timeframes
- Works best only after a clear uptrend
Shooting Star in Different Markets
Forex
Shooting star in forex trading works great on major pairs like EUR/USD or GBP/USD. Daily and 4-hour charts give the best results.
Stocks
The stock market shooting star pattern is widely used by swing traders. It works especially well near earnings highs or all-time highs.
Crypto
Crypto shooting star candlestick signals are very common due to high volatility. Always wait for confirmation in crypto markets since fake moves are frequent.
How Volume Affects Shooting Star Signals
High volume during a shooting star candle shows strong rejection. Many sellers were active. The signal is trustworthy.
Low volume means the move was weak. Not many traders participated. The signal may fail. Always check volume before entering any price action shooting star trade.
Beginner Tips for Using Shooting Star Effectively
- Always check the trend first
- Use the daily chart to start
- Wait for the confirmation candle always
- Combine with RSI or resistance levels
- Keep your stop loss tight and logical
- Do not force trades — wait for clear setups
- Practice on a demo account before going live
Quick Cheat Sheet (1-Minute Summary)
- What it is: A bearish reversal candle with a small body and long upper wick
- Forms after: An uptrend
- Signal: Sellers rejected higher prices
- Confirmation: Next red candle closing below the body
- Entry: After confirmation candle closes
- Stop loss: Above the shooting star high
- Best with: RSI overbought, resistance level, high volume
- Works in: Stocks, forex, crypto
FAQs About Shooting Star Candlestick
Question: Is the shooting star bullish or bearish?
Answer: It is a bearish signal. It means prices may go down after forming.
Question: Can beginners use the shooting star pattern?
Answer: Yes! It is one of the easiest shooting star candlestick patterns for beginners to learn and apply.
Question: Is it profitable?
Answer: Yes, when used correctly with confirmation and good risk management. No pattern wins 100% of the time.
Question: What is the shooting star accuracy rate?
Answer: Around 50–65% on its own. Higher when combined with other tools like RSI and resistance levels.
Question: How is a shooting star different from an inverted hammer?
Answer: Same shape, but shooting star forms at the top of an uptrend. Inverted hammer forms at the bottom of a downtrend.
Final Thoughts
The shooting star candlestick is a simple but powerful tool. It tells a clear story — buyers tried to push prices up, but sellers took control and pushed them back down.
Whether you trade forex, stocks, or crypto, this pattern can be a great addition to your trading toolkit. Just remember: always wait for confirmation, always manage your risk, and never trade blindly.
Start small, practice a lot, and use the shooting star as one part of a bigger trading plan. With time and patience, it can truly help you make smarter trading decisions.
Happy trading! 🌟
Bearish Harami Pattern: Secrets Smart Traders Use
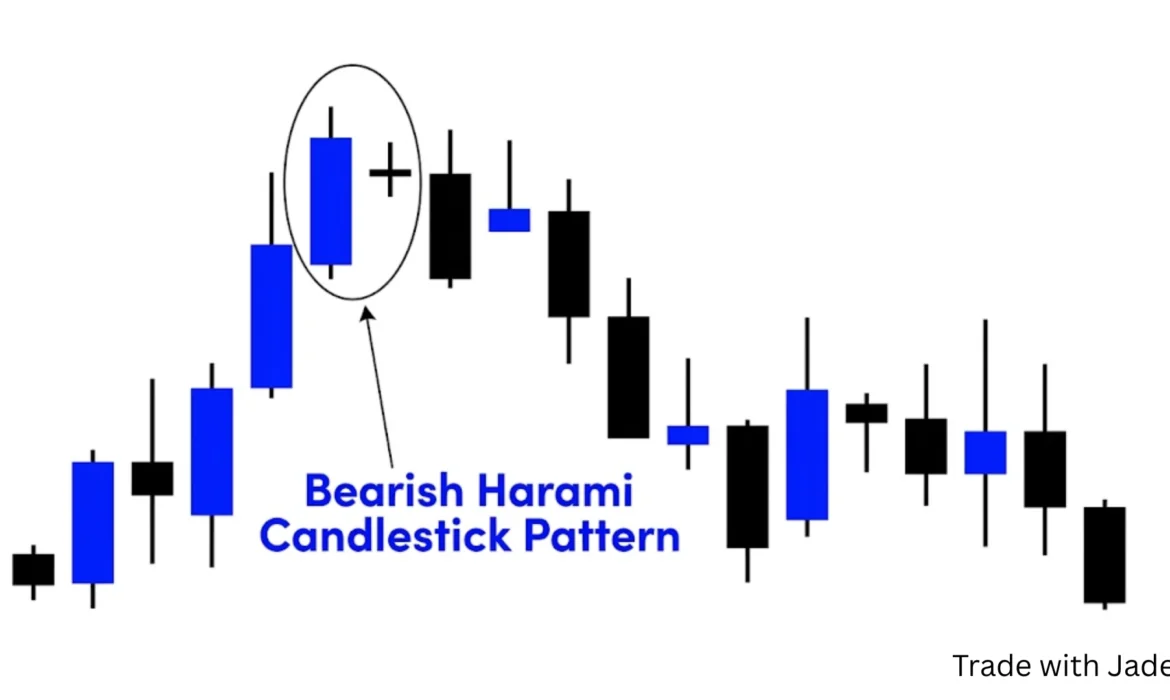
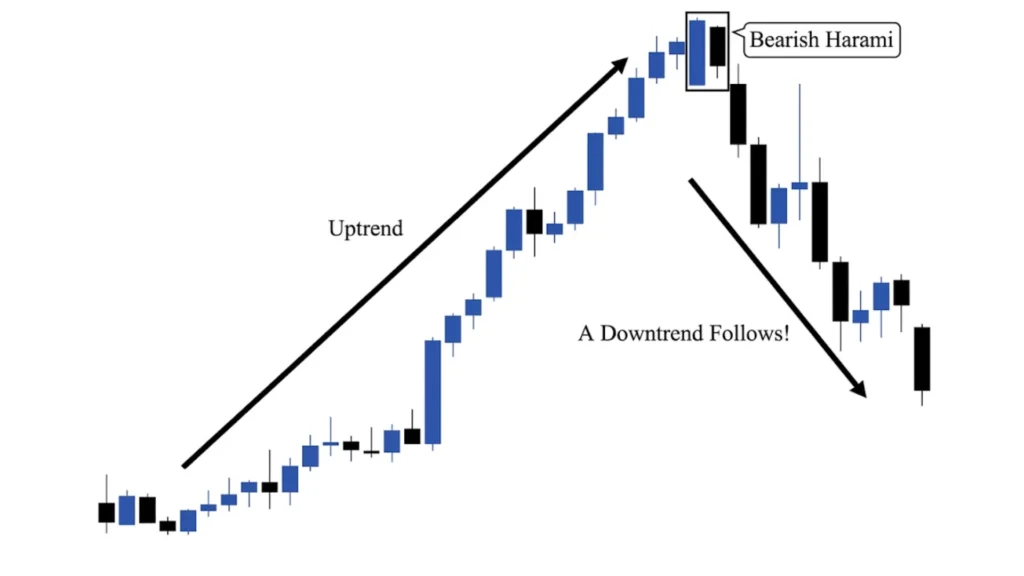
What Is a Bearish Harami?
The bearish harami pattern is a two-candle pattern found on candlestick charts. It shows up during an uptrend and warns traders that the price might stop going up or even reverse down.
The word “harami” comes from Japanese. It means “pregnant.” Why? Because the second small candle sits inside the body of the first big candle — just like a baby inside a mother.
Simple Definition
A bearish harami pattern has two candles:
- The first candle is big and green (bullish)
- The second candle is small and fits inside the first one
That’s it. Simple, right?
Why Traders Care About It
Traders love the bearish harami candlestick because it gives an early warning. It says, “Hey, buyers are getting tired. Sellers might take over soon.” This helps traders plan their next move before the price actually falls.
Bearish Harami Explained
Let’s make this really easy with a story.
“Strong Buyers Getting Weak” Story
Imagine a team of runners. On Day 1, they run super fast. They are full of energy. That’s the big green candle — buyers pushing prices up hard.
On Day 2, the same runners try again. But now they are tired. They slow down. They can barely move. That’s the small candle — buyers losing their strength.
Easy Analogy
Think of it like pushing a heavy box uphill. You push hard at first. But near the top, you slow down. You’re exhausted. The box might just stop — or roll back down.
That’s exactly what the bearish harami shows in price action.

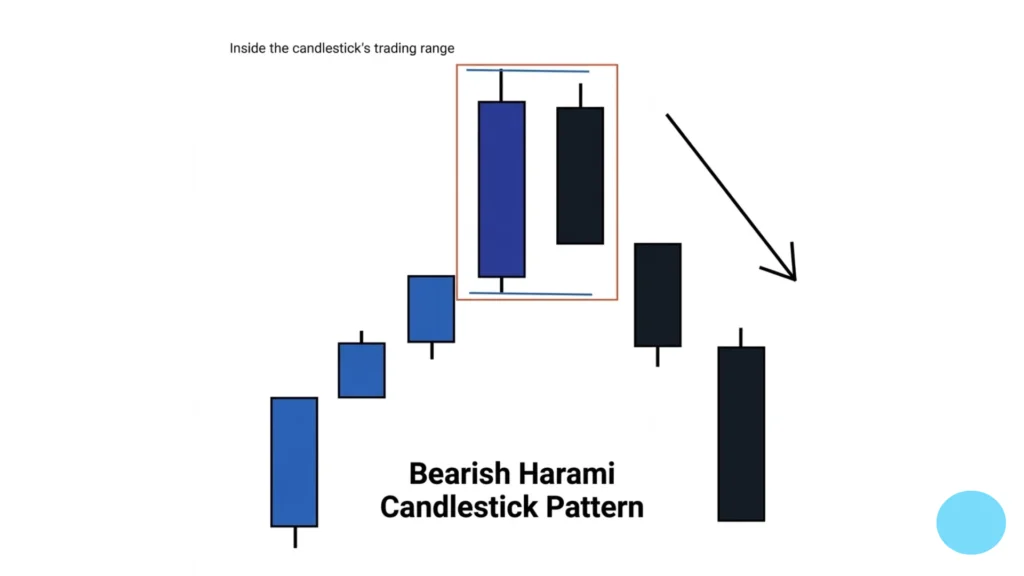
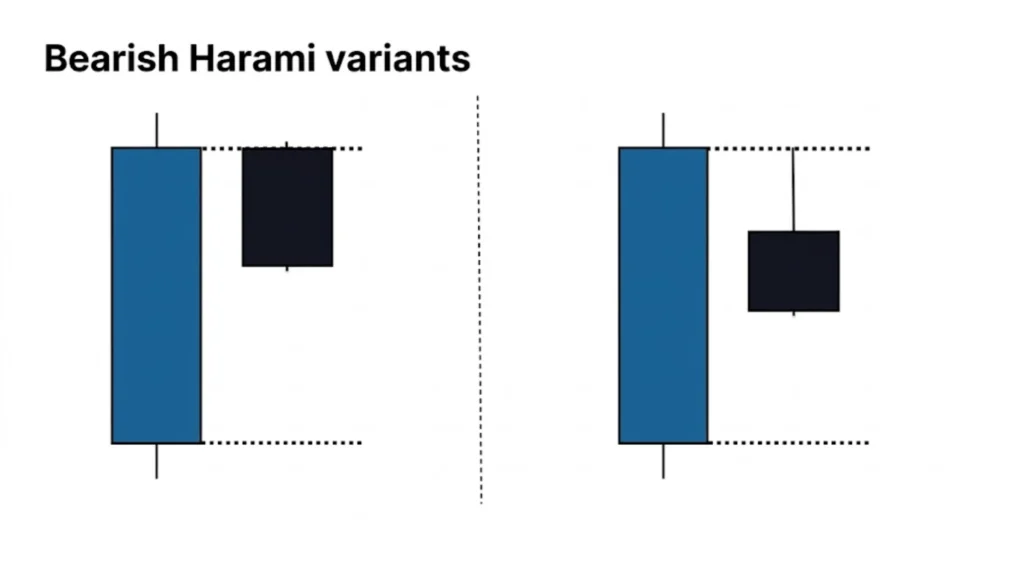
What Does a Bearish Harami Look Like?
First Candle (Big Bullish)
The first candle is tall and green. It means buyers were in full control. Price moved up a lot during this session.
Second Candle (Small Inside)
The second candle is small. It can be red or green. But the key thing? Its body must sit fully inside the body of the first candle. Price didn’t move much at all.
Visual Explanation in Steps
Here’s how to read it step by step:
- Look for an uptrend (price going up)
- Spot a big green candle
- Find a small candle right after it
- Make sure the small candle is inside the big one
- That’s your bearish harami pattern!
Quick Checklist to Identify Bearish Harami
Use this simple checklist every time:
- ✅ Uptrend before the Bearish Harami pattern
- ✅ Big green candle appears
- ✅ Small candle forms right after
- ✅ Small candle body is inside the big candle body
- ✅ Appears near a resistance level (bonus point!)
If you check all these boxes, you likely have a valid bearish harami setup.
What Does a Bearish Harami Indicate?
Buyers Losing Strength
When the second candle is tiny, it means buyers couldn’t push price higher. Their energy is fading.
Sellers Entering
Sellers start to notice this weakness. They begin to enter the market and push prices down a little.
Possible Trend Reversal or Pause
The bearish reversal pattern doesn’t always mean a full crash. Sometimes price just slows down. But it’s a clear warning sign that something is changing.
Psychology Behind Bearish Harami
Day 1: Buyers Strong
Buyers are excited. Everyone is buying. Price shoots up. The big green candle forms.
Day 2: Confusion Starts
The next day, buyers try again. But sellers also show up. Neither side wins big. The candle stays small and stuck inside Day 1’s range.
What This Means for Price
This confusion is a red flag. When buyers can’t push higher after a strong day, sellers often take control next. That’s the bearish trend reversal signal hiding in plain sight.
Real Market Examples
Example in Stocks (e.g., Apple)
Imagine Apple stock climbing up for three days. Then a big green candle appears. The very next day, a small candle forms inside it — right near a major resistance zone. This is a classic bearish harami in stocks. Many traders would watch for a confirmation candle before selling.
Example in Crypto (e.g., Bitcoin)
Bitcoin rallies hard in a bull run. After a massive green candle, a tiny candle appears. Volume drops too. This is a strong crypto bearish harami setup — especially when RSI is above 70 (overbought zone).
Example in Forex (e.g., EUR/USD)
EUR/USD pushes up during the London session. A big bullish candle forms. The next candle is tiny and sits inside. Near a known resistance level, this forex bearish harami pattern gets traders ready to sell.
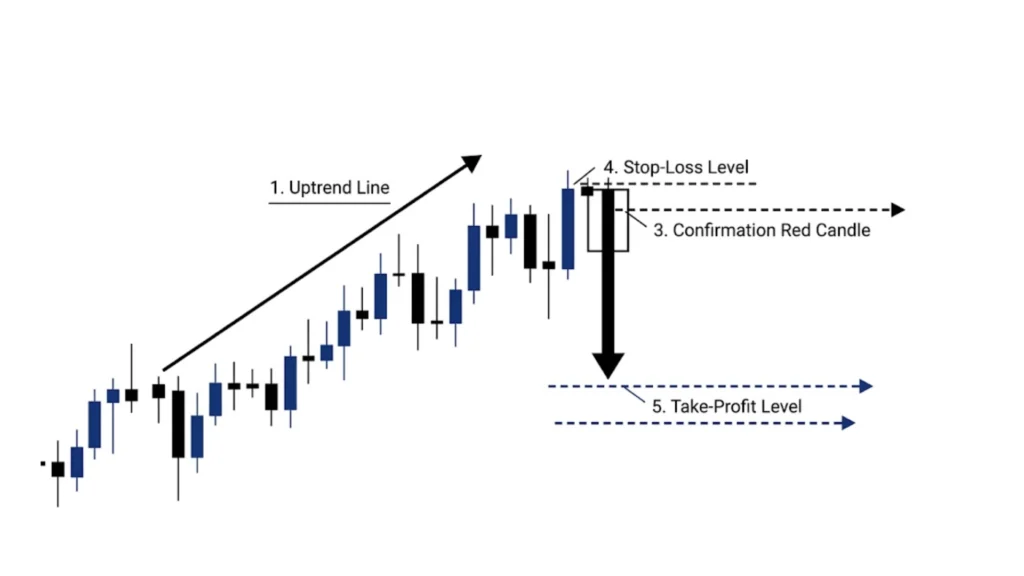
Step-by-Step Bearish Harami Trading Plan
Here’s a simple plan anyone can follow:
- Find an uptrend — price should be going up before thebearish harami pattern
- Spot the pattern — big green candle + small candle inside
- Wait for confirmation — the next candle should be red and close lower
- Enter the trade — sell (short) after confirmation candle closes
- Set stop-loss — place it above the high of the first big candle
- Set take-profit — aim for the nearest support level below
This is a simple but solid bearish harami pattern trading strategy for beginners.
Best Trading Strategies for Bearish Harami Pattern
Trading with Resistance Levels
When the bearish harami forms at a resistance level, the signal becomes much stronger. Resistance is where price has struggled to go higher before. Combine that with the bearish harami pattern, and sellers have two reasons to act.
Using RSI Indicator
If RSI is above 70 when the pattern forms, that means the market is overbought. A bearish harami with RSI in overbought territory is a powerful combo for finding reversals.
Using Moving Averages
If price is far above the 50-day or 200-day moving average and a bearish harami shows up, it could snap back down toward the average. This is called mean reversion.
Using Volume Confirmation
Bearish harami with volume dropping on the second candle confirms buyers are losing interest. Always check volume — it tells you how serious the move is.
Using Fibonacci Levels
If the bearish harami pattern appears near a 61.8% or 78.6% Fibonacci retracement level, it adds even more weight to the signal. Price loves to reverse at Fibonacci zones.
When You Should NOT Trade a Bearish Harami
Not every bearish harami is worth trading. Avoid it when:
- The uptrend is very strong with no signs of slowing
- There’s no resistance level nearby
- No confirmation candle appears after the bearish harami pattern
- Volume is very low — signal may be fake
Patience is everything in candlestick trading for beginners.
Best Timeframes for Bearish Harami
- 1-minute chart — too noisy, too many false signals. Avoid.
- 15-min / 1-hour chart — good for day traders, decent signals
- Daily chart — strongest signals. Bearish harami accuracy is highest here
The daily timeframe filters out all the market noise and gives the cleanest bearish candlestick signals.
Bearish Harami Pattern vs Other Candlestick Patterns
Bearish Harami vs Bearish Engulfing
| Feature | Bearish Harami Pattern | Bearish Engulfing Pattern |
|---|---|---|
| Candle size | Small second candle | Second candle is bigger |
| Strength | Moderate | Stronger signal |
| Confirmation needed | Yes | Sometimes |
The bearish harami vs engulfing comparison shows that engulfing is more aggressive, while harami is more cautious.
Bearish Harami vs Doji
A bearish harami vs doji — a doji has almost no body at all. It shows even more confusion than harami. Both signal hesitation, but doji is more extreme.
Bearish Harami vs Shooting Star
A shooting star has a long upper wick and small body. It’s a one-candle pattern. Bearish harami vs shooting star — shooting star is easier to spot but harami gives more structural context.
What Happens After a Bearish Harami?
Three things can happen:
- Price goes down — successful reversal, sellers win
- Price moves sideways — indecision continues, wait for next signal
- Pattern fails — buyers come back, price keeps going up
Always use a stop-loss because no pattern works 100% of the time.
Volume Made Simple: Why It Matters
- High volume on second candle = strong signal, sellers are serious
- Low volume on second candle = weak signal, may be a fake-out
Volume is like a vote. More votes = more conviction. Always check it before trading any bearish harami pattern.
Bearish Harami for Day Trading vs Swing Trading
- Day trading — use 15-min or 1-hour charts, quick entries and exits, tight stop-loss
- Swing trading — use daily or weekly charts, hold trade for days or weeks, bigger profit targets
Both styles work. Pick based on your time and patience.
Advantages of Bearish Harami Pattern
- Easy to spot on any chart
- Gives early warning before reversal
- Works well with indicators like RSI and volume
- Can be used in stocks, forex, and crypto
Disadvantages of Bearish Harami Pattern
- Needs confirmation before trading
- Can give false signals in strong trends
- Not always a strong reversal — sometimes just a pause
- Beginners may misidentify it
Common Beginner Mistakes
- Selling too early — before confirmation candle closes
- Ignoring the trend — trading it in a downtrend won’t work
- No stop-loss — one wrong trade can erase profits
- No confirmation — jumping in just because the two candles appeared
Mini Case Study: Winning vs Losing Trade
Winning trade: Stock in uptrend, hits resistance, bearish harami forms, RSI at 72, confirmation red candle appears, trader enters short, stop above high, price falls 5% — profit!
Losing trade: Bearish harami forms mid-trend with no resistance, no confirmation waited, trader sells early, price continues up — loss!
What we learn: Context + confirmation = better trades.
Myths About Bearish Harami (Truth vs Reality)
- ❌ Myth: It always means price will fall
- ✅ Truth: It needs confirmation and context
- ❌ Myth: It works alone without any indicators
- ✅ Truth: It works best with RSI, volume, and resistance levels
Is Bearish Harami Good for Beginners?
Yes! With the right rules, it’s one of the friendliest candlestick chart patterns to learn. Start by spotting it on historical charts. Practice without real money first. Then slowly apply it live.
The bearish harami meaning is simple. The rules are clear. That makes it perfect for new traders.
Bearish Harami Checklist (Quick Revision)
- ✅ Uptrend present
- ✅ Big bullish candle
- ✅ Small candle inside
- ✅ Confirmation candle closes red
- ✅ Near resistance
- ✅ RSI overbought (bonus)
- ✅ Stop-loss placed above first candle high
Simple Glossary
- Candle — a bar on a chart showing open, close, high, and low price
- Trend — the direction price is moving (up or down)
- Resistance — a price level where buyers struggle to push higher
- Volume — how many shares or contracts were traded in a session
FAQs About Bearish Harami Pattern
Question: What is a bearish harami pattern?
Answer: It’s a two-candle pattern where a small candle forms inside a big bullish candle during an uptrend, signaling a possible reversal.
Question: How accurate is bearish harami?
Answer: Bearish harami accuracy improves when used with confirmation, resistance levels, and volume. Alone, it’s moderate — around 50-60% reliability.
Question: Is it reliable?
Answer: It’s reliable when all conditions are met. Never trade it in isolation.
Question: What is the best timeframe?
Answer: The daily chart gives the strongest signals. The 1-hour chart works well for day traders.
Question: Can beginners use it?
Answer: Absolutely. It’s one of the simplest two candle reversal patterns to learn and apply.
Final Summary
The bearish harami pattern is a simple, powerful candlestick signal. It shows buyers slowing down during an uptrend. When a big green candle is followed by a small inside candle, the market is sending a warning: something might be changing.
Use it with confirmation, resistance, RSI, and volume. Always use a stop-loss. Avoid trading it blindly without context.
Whether you trade stocks, forex, or crypto — learning the bearish harami pattern is a smart step toward better technical analysis. Keep practicing, stay patient, and let the chart tell its story.
What Is a DMA in Forex Trading? How It Works & How to Use It
What Does DMA Mean in Forex Trading?
If you search “what is a DMA” in forex, you might feel confused. That is because DMA has two different meanings in trading.
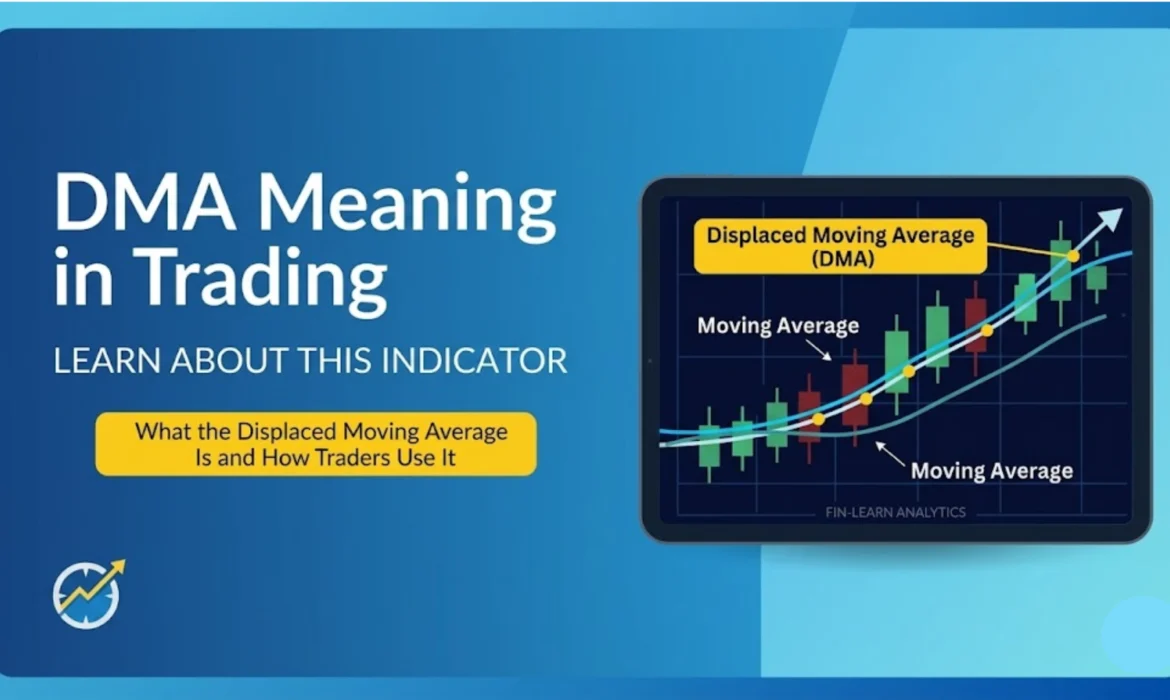
The first meaning is a chart tool called the Displaced Moving Average. It helps you see price trends on a chart. The second meaning is Direct Market Access, which is how your trade gets sent to the market.
Both are very useful. But they work in completely different ways. Let us break them down one by one so everything becomes clear.
DMA in Forex: Two Types Explained Simply
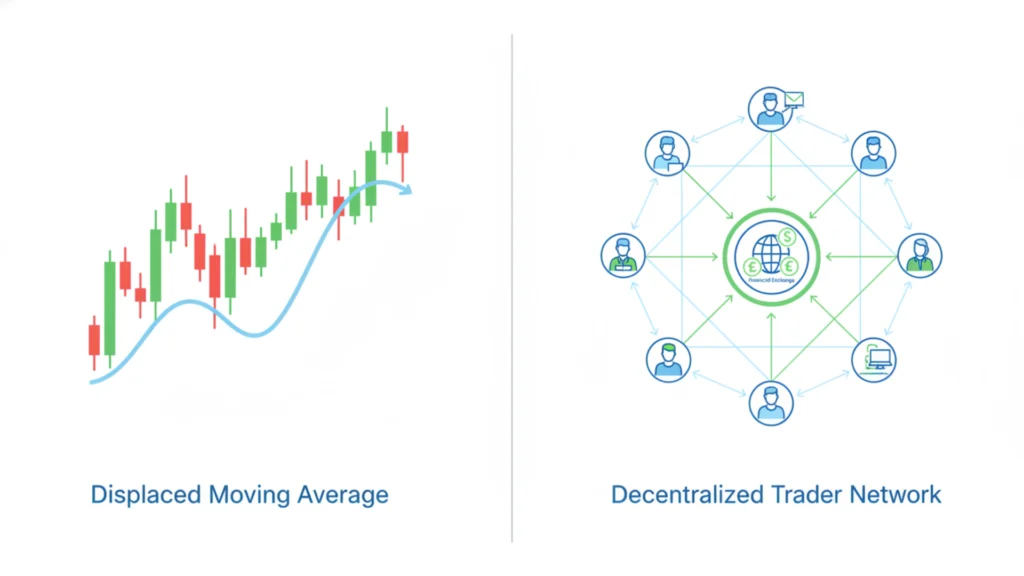
Type 1: Displaced Moving Average (Chart Tool)
This is a line on your chart. It is just like a normal moving average, but it is shifted forward or backward in time. Traders use it to predict where the price might go next.
Type 2: Direct Market Access (Execution Method)
This is about how your trade reaches the market. With dma in forex, your order goes straight to real buyers and sellers. No middleman. No delay.
These two types are totally different things. One is a technical indicator in forex trading. The other is a trading method. Always check which one people mean when they say DMA.
Displaced Moving Average (DMA) Made Easy
A Displaced Moving Average is simply a moving average that has been moved. You take a regular moving average and shift it a few periods ahead or behind.
Think of it like this. Imagine drawing a line through past prices. Now slide that line forward by 5 days. That is your DMA. The displaced moving average explained in the simplest way is: a shifted version of a normal average line.
Why shift it? Because sometimes the regular line reacts too slowly. By shifting it, traders try to get better signals earlier.
Simple Example of DMA in Forex
Let us use EUR/USD as an example. Say you add a 20-period moving average and shift it forward by 5 periods. Now you have your DMA line on the chart.
When the EUR/USD price moves above the DMA line, it is a sign that buyers are in control. When the price drops below the DMA line, sellers might be taking over.
This is a basic DMA trading example that even beginners can understand. You are just watching where the price is compared to the shifted line. Simple as that.
How to Use DMA on a Forex Chart
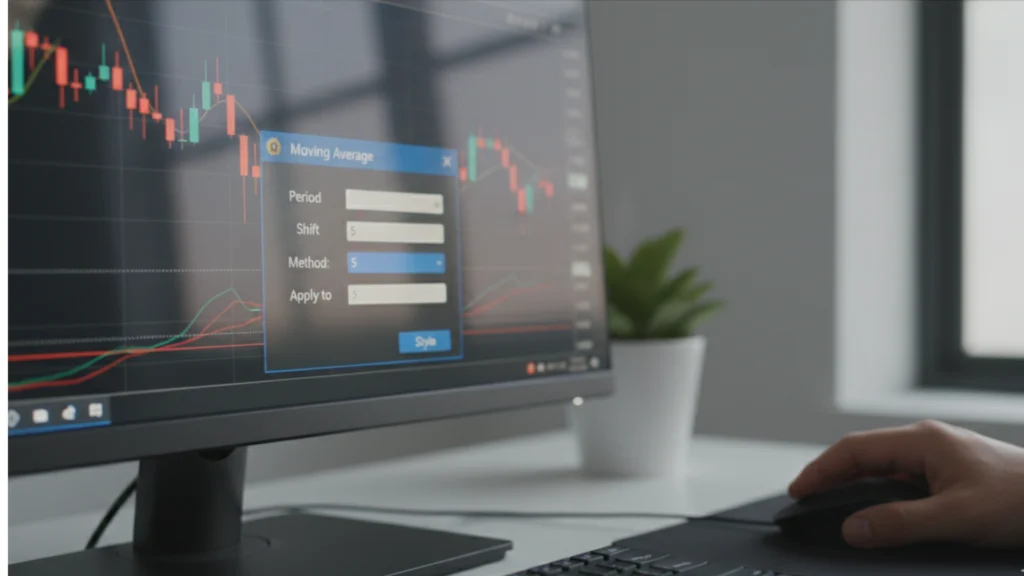
Adding and Setting Up the DMA Indicator
Here is how to read a DMA chart and set it up:
Step 1: Open your forex chart on any platform like MetaTrader 4 or 5.
Step 2: Add a Simple Moving Average (SMA) or Exponential Moving Average (EMA) to your chart.
Step 3: Go to the indicator settings and find the “Shift” box.
Step 4: Enter a number like 5 or 10 to shift the line forward.
Step 5: Watch how price interacts with the shifted line. When price crosses it, that is your signal.
These DMA settings for forex are easy to change. Start with small shifts until you find what works best for your trading style.
How DMA Helps You Find Trends
The DMA indicator in forex is great for spotting trends. Here is the simple rule:
- Price above DMA line = Uptrend (prices are going up)
- Price below DMA line = Downtrend (prices are going down)
This is the core idea behind DMA indicator signals. You do not need to do any complicated math. Just look at where the price is sitting compared to the line.
This is also how moving average displacement meaning works in real trading — the shifted line acts like a dynamic support or resistance level.
Simple DMA Trading Strategy for Beginners
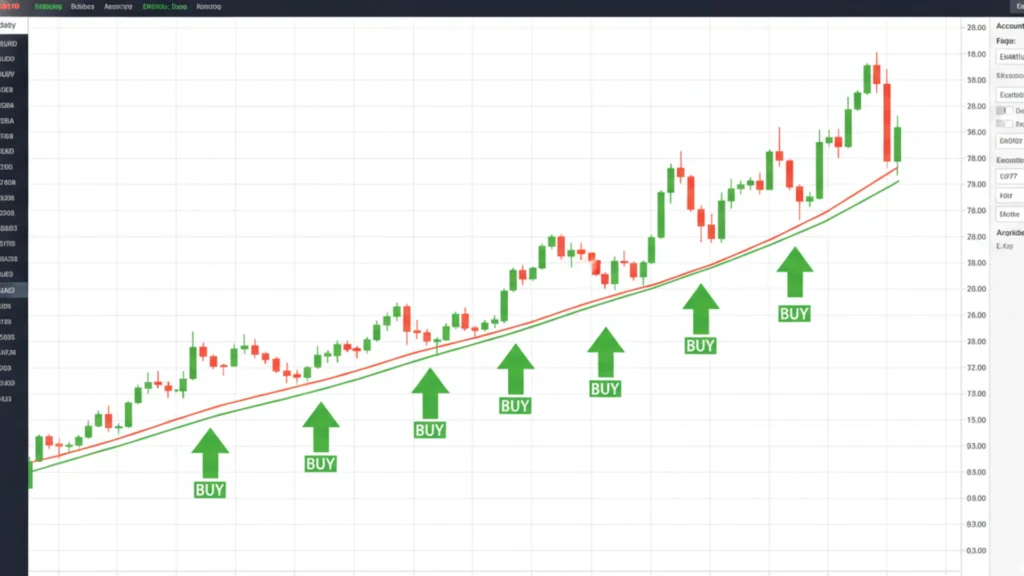
The DMA Crossover Strategy
Here is a best DMA strategy for beginners that is easy to follow:
- Buy Signal: When the price crosses above the DMA line, consider buying.
- Sell Signal: When the price crosses below the DMA line, consider selling.
This is the basic DMA crossover strategy. It works well on 1-hour or 4-hour forex charts. Always use a stop loss. Never risk more than you can afford to lose.
This DMA trading strategy is simple but powerful when used with other signals like support and resistance levels.
DMA vs Other Moving Averages (SMA, EMA)
DMA vs SMA vs EMA Comparison
Here is a simple comparison to understand the DMA vs SMA comparison and DMA vs EMA difference:
| Feature | SMA | EMA | DMA |
|---|---|---|---|
| Speed | Slow | Fast | Adjustable |
| Smoothness | Very smooth | Less smooth | Depends on shift |
| Best for | Long-term trends | Short-term signals | Custom signal timing |
| Complexity | Simple | Moderate | Simple with shift |
The simple moving average vs displaced moving average difference is just the time shift. EMA gives more weight to recent prices. DMA shifts any average to match the market better.
For forex trading with moving averages, DMA gives you more flexibility because you can adjust the shift to match different market conditions.
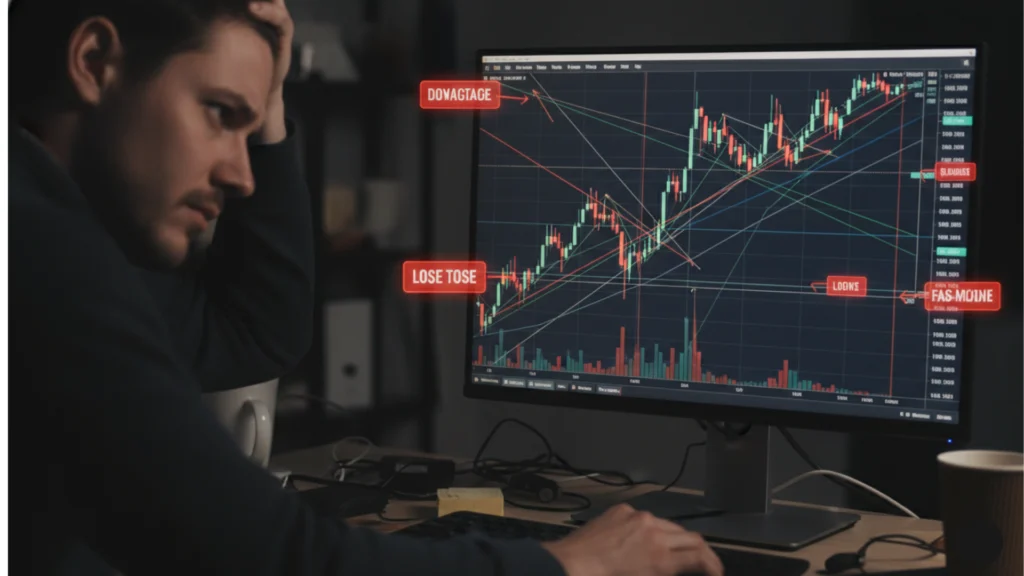
Common Mistakes When Using DMA
Avoid These DMA Errors
Even good tools can cause problems if used wrong. Here are the limitations of displaced moving average use:
Mistake 1 – Using DMA alone. Never rely only on one indicator. Always combine it with other tools like RSI or support levels.
Mistake 2 – Ignoring news events. Big news can break any technical signal. Always check the economic calendar.
Mistake 3 – Wrong shift settings. A shift that is too large or too small can give bad signals. Test your settings first on a demo account.
These are the most common reasons why beginners struggle with the DMA indicator in forex.
What Is Direct Market Access (DMA) in Forex?
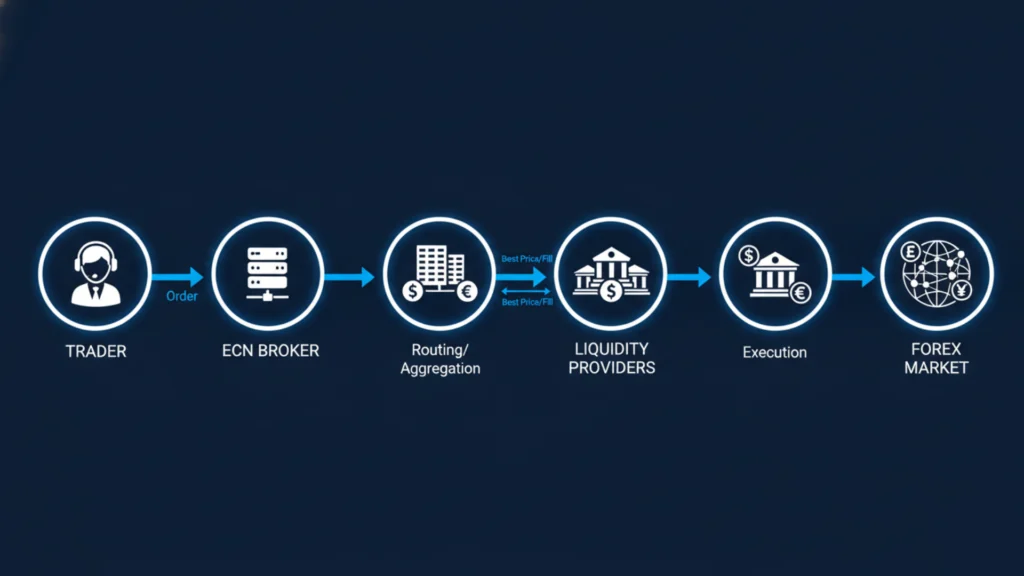
Now let us talk about the second meaning. Direct market access forex means your trade order goes directly to the real market — banks, other traders, and liquidity providers — without a middleman.
What does DMA stand for in trading here? It stands for Direct Market Access. This is a professional-level trading method. You see the real prices from real liquidity providers DMA systems are connected to. No price manipulation. No dealing desk.
This is very different from trading with a regular broker who acts as the middleman. With DMA trading, you get real-time pricing DMA directly from the market.
How DMA Works with Forex Brokers
ECN Brokers and Order Execution
ECN vs DMA trading is closely related. ECN stands for Electronic Communication Network. ECN brokers use DMA execution in trading to connect you directly to the market.
Here is how it works simply:
- You place a trade order.
- Your broker sends it to liquidity providers.
- The order gets filled at the best available price.
This is called what is direct access trading in action. With DMA forex brokers, there is no dealer sitting between you and the market. Your spread and slippage in DMA trading are usually lower too.
DMA vs Market Maker Brokers
This is a very important comparison for all forex traders. Here is the simple truth about DMA vs market maker brokers:
- Market Maker Brokers create their own prices. They are the “middleman.” They take the other side of your trade.
- DMA Brokers connect you directly to real market prices. No conflict of interest.
With market makers, there can be price manipulation or wider spreads. With direct market access brokers, you get fair pricing from real liquidity sources.
Most professional traders prefer DMA forex brokers list options because of the transparency and speed they offer.
Benefits of DMA in Forex Trading
Why Traders Love Direct Market Access
The advantages of DMA in forex trading are very clear:
- Faster execution – Your trade goes through instantly with no dealer delay.
- Better prices – You see real market prices, not broker-adjusted ones.
- More control – You can set your own price using limit orders.
- Transparency – You know exactly where your order is going.
- Algorithmic trading DMA – DMA platforms support automated trading systems easily.
These benefits of direct market access make it a top choice for serious forex traders who want full control over their trades.
Risks of Using DMA
What to Watch Out For
Nothing is perfect. Here are the DMA trading risks you should know:
- Needs experience – DMA is not ideal for complete beginners. The speed can be overwhelming.
- Can be fast and risky – Prices move fast. Mistakes happen quickly.
- Minimum deposit requirements – Many DMA platforms require a larger deposit.
- Technology dependency – If your internet goes down, trades can go wrong.
Always ask yourself: is DMA good for beginners in your situation? If you are just starting, practice on a demo account first.
Which DMA Should You Use?
This section helps you decide. Here is a very simple guide:
- Beginner Trader? → Use the Displaced Moving Average (the chart indicator). It is safe, visual, and easy to learn.
- Experienced Trader? → Use Direct Market Access (the execution method). It gives you speed, better prices, and more control.
How to use DMA indicator as a beginner is much simpler than setting up a DMA broker account. Start small, learn well, then move up.
Best Settings for DMA in Forex
Recommended DMA Settings
Here are some simple and popular DMA settings for forex:
- 20 DMA – Good for short-term trades. Reacts faster to price changes.
- 50 DMA – Good for medium-term trends. More reliable signals.
- 200 DMA – Used by professional traders to spot long-term trends.
Start with the 20 DMA if you are new. It gives clear signals without too much noise. Always test any setting on a demo chart before going live.
When NOT to Use DMA
Avoid DMA in These Situations
The DMA indicator in forex does not work well in all conditions. Avoid using it when:
- The market is sideways – When prices are moving in a flat range, DMA signals are unreliable.
- Big news is coming – Before major economic news like NFP or interest rate decisions, avoid DMA signals.
- Spread is very high – In volatile conditions, DMA execution costs can rise sharply.
Knowing when not to trade is just as important as knowing how to trade.
Quick Summary (Easy Recap)
Here is everything you need to remember about what is a DMA:
- ✅ DMA has two meanings — a chart indicator and a trading access method.
- ✅ Displaced Moving Average is a shifted moving average used to spot trends.
- ✅ Direct Market Access lets you trade directly with the real market.
- ✅ DMA indicator signals help you find buy and sell opportunities.
- ✅ DMA brokers offer faster execution and better prices than market makers.
- ✅ Beginners should start with the DMA indicator, not direct market access.
Beginner-Friendly FAQ
Q: What is a DMA in simple words? A: DMA means either a shifted moving average line on your chart, or a way to trade directly with the market without a middleman.
Q: Is DMA better than EMA? A: It depends. EMA reacts faster to prices. DMA lets you control the timing. Both are useful in the right situation.
Q: What does DMA stand for in trading? A: It stands for either “Displaced Moving Average” (an indicator) or “Direct Market Access” (a trading method).
Q: Can beginners use DMA? A: Yes! Beginners can easily use the Displaced Moving Average on charts. Direct Market Access is better for more experienced traders.
Q: How do I choose a DMA broker? A: Look for ECN brokers with low spreads, fast execution, and good regulation. Check if they offer real-time pricing DMA and connect to strong liquidity providers.
Q: What are the best DMA settings for forex? A: Start with a 20-period DMA for short-term trading or a 50-period DMA for medium-term trends. Shift it by 5 to 10 periods and test on a demo account first.
Bar Chart Patterns Cheat Sheet With All Key Setups
What Are Bar Chart Patterns?
Have you ever watched the price of a stock go up and down? That movement creates shapes on a chart. These shapes are called chart patterns.
Think of it like reading a map. The price tells you a story. When you learn to read that story, you can make smarter trading decisions.
Price moves because people are buying and selling. Sometimes it goes up. Sometimes it goes down. Sometimes it just moves sideways.
When price makes the same shapes again and again, we call them bar chart patterns. Traders use this bar chart patterns cheat sheet to quickly remember what each shape means.
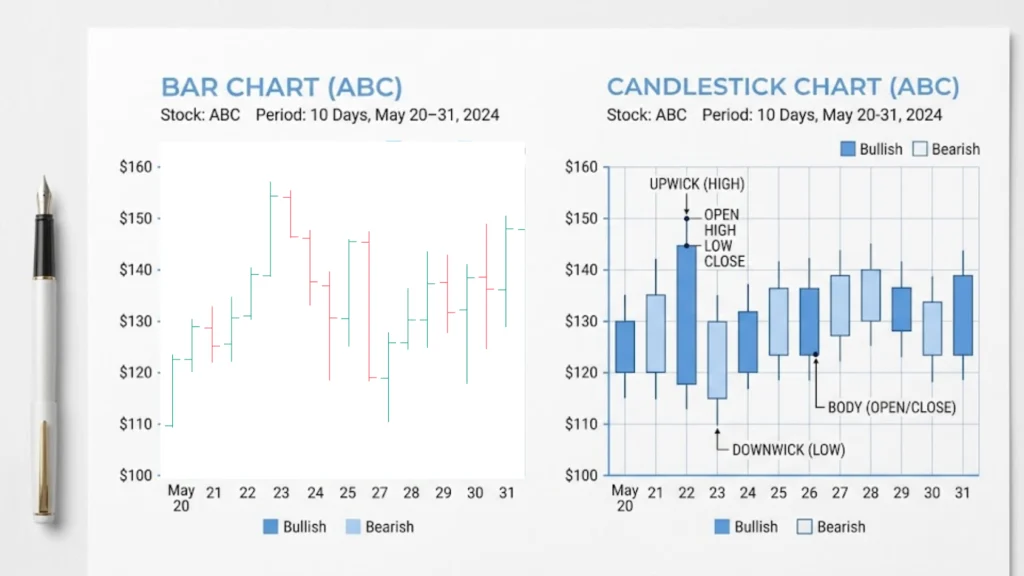
What Is a Bar Chart vs Candlestick Chart?
a)What Does a Bar Chart Look Like?
A bar chart shows price using simple vertical lines. Each bar has:
- A top = highest price
- A bottom = lowest price
- A left tick = opening price
- A right tick = closing price
It looks like a simple stick with two small lines on the sides.
b)How Is It Different from a Candlestick?
A candlestick has a thick body in the middle. That body shows you the open and close price clearly. It also uses colors — green for up, red for down.
A bar chart uses just lines. It is simpler but gives the same information. Many professional traders prefer bar charts because they look clean and are less distracting.
Both show the same price data. The difference is only in how they look. This bar chart trading strategies guide works with both styles.
Why Do Chart Patterns Work?
Chart patterns work because of human emotions. People trade based on fear and greed. These emotions repeat over and over.
When price goes up a lot, people get greedy and buy more. When price drops, people get scared and sell. This cycle creates the same shapes on charts again and again.
That is why technical analysis chart patterns are so powerful. You are not just reading lines. You are reading how people feel about the market.
Patterns work across all markets — stocks, forex, and crypto. They also work on all timeframes. This is why this stock chart patterns cheat sheet is so useful.
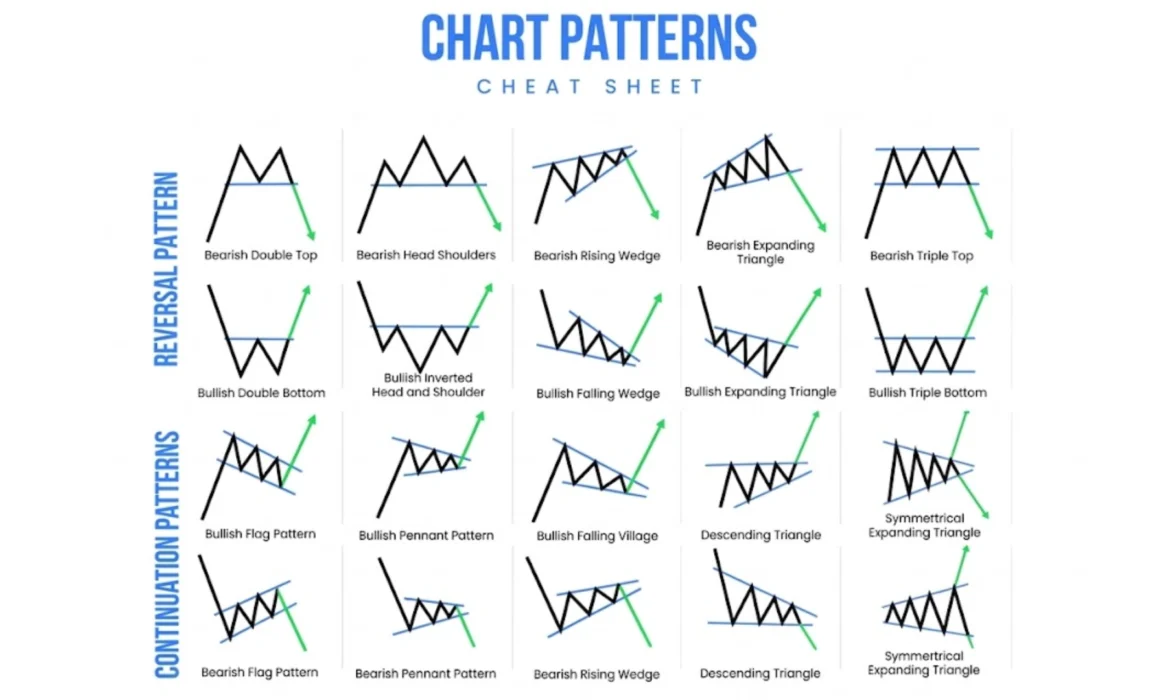
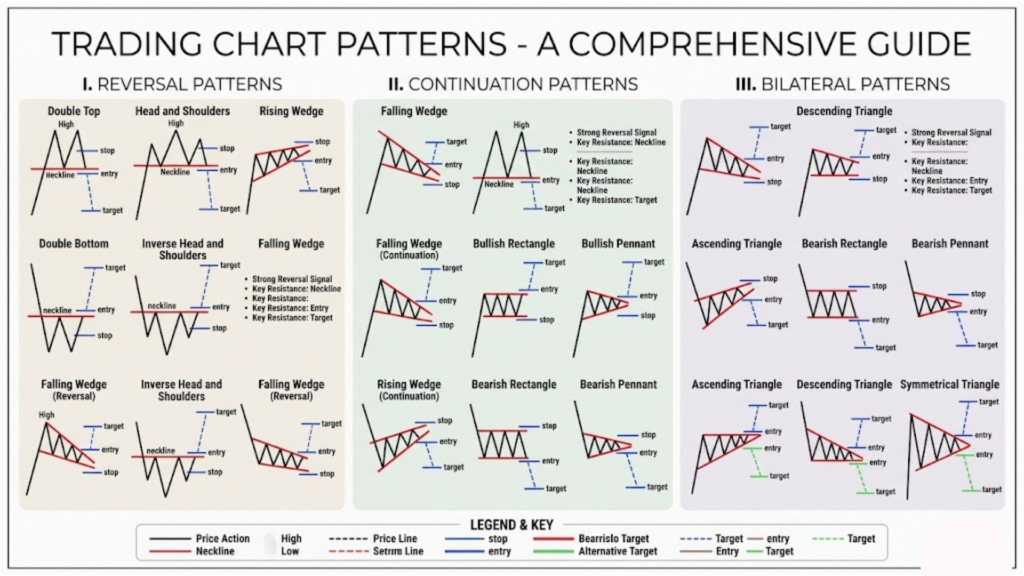
Quick Bar Chart Patterns Cheat Sheet (Easy Table)
This is your trading patterns quick reference table. Save it. Print it. Use it every day.
| Pattern Name | Bullish or Bearish | What Usually Happens |
|---|---|---|
| Head and Shoulders | Bearish | Price reverses and goes down |
| Inverse Head & Shoulders | Bullish | Price reverses and goes up |
| Double Top | Bearish | Price fails twice and drops |
| Double Bottom | Bullish | Price bounces twice and rises |
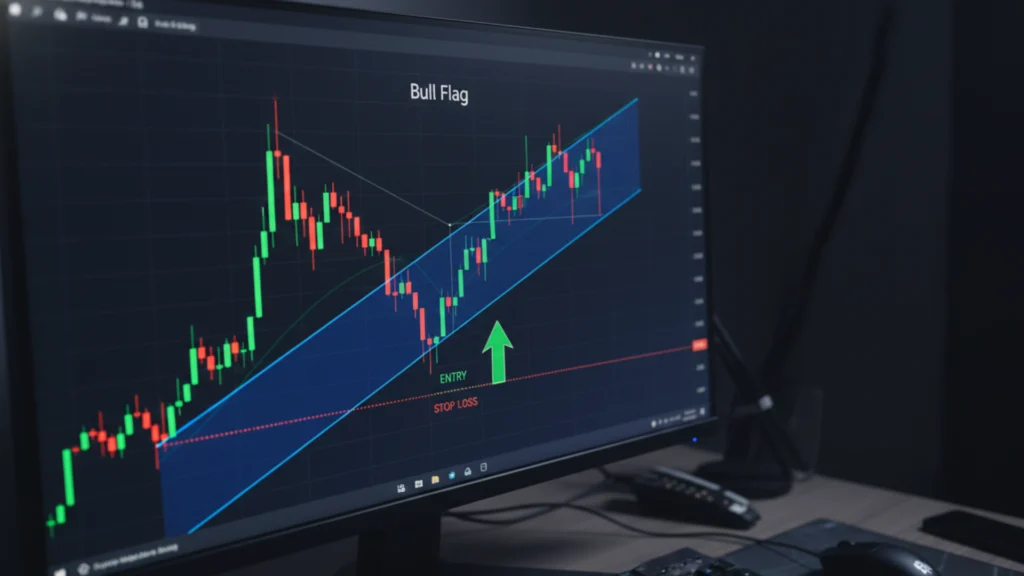
| Bull Flag | Bullish | Price continues moving up |
| Bear Flag | Bearish | Price continues moving down |
| Ascending Triangle | Bullish | Price breaks out upward |
| Descending Triangle | Bearish | Price breaks down lower |
| Cup and Handle | Bullish | Price forms a cup shape then rises |
| Symmetrical Triangle | Neutral | Price can break either way |
| Rising Wedge | Bearish | Price breaks down after rising |
| Falling Wedge | Bullish | Price breaks up after falling |
This visual chart patterns cheat sheet gives you a fast look at all common chart patterns explained in one place.
How to Spot Chart Patterns with Your Eyes
Look for Highs and Lows
Every pattern is made of highs and lows. Look at the peaks (tops) and valleys (bottoms) of the price.
- If highs are getting lower → price is weakening
- If lows are getting higher → price is getting stronger
Look for Trendlines
Connect the highs with a line. Connect the lows with another line. Do they form a triangle? A wedge? A channel?
That shape is your pattern. Chart pattern recognition starts with these two simple steps. Once you practice, your eyes will start seeing patterns naturally.
Most Important Patterns You Should Learn First
Do not try to learn everything at once. Here are the best chart patterns for beginners to start with:
- Double Top — Easy to see, very reliable bearish signal
- Double Bottom — Great bullish reversal to trade
- Head and Shoulders — Classic reversal pattern
- Bull Flag — Simple and fast continuation setup
- Ascending Triangle — Clear breakout pattern
- Falling Wedge — Strong bullish reversal signal
- Cup and Handle — Great for swing trading
These are easy chart patterns to learn and show up often in real markets. Master these seven first before moving on to advanced setups.
Reversal vs Continuation Patterns (Simple Difference)
Reversal Patterns
A reversal chart patterns guide teaches you that reversal means the trend is about to change direction.
If price was going up and a reversal pattern forms, price will likely go down. Examples: Head and Shoulders, Double Top, Rising Wedge.
Continuation Patterns
Continuation patterns in trading mean the trend will keep going in the same direction.
If price was going up and a continuation pattern forms, price will likely keep going up. Examples: Bull Flag, Ascending Triangle, Cup and Handle.
This is one of the most important things in your bar chart patterns cheat sheet.
Similar Patterns Compared (Avoid Confusion)
Triangle vs Wedge
Both look like a triangle. The difference is the angle.
- Triangle — One side is flat (horizontal)
- Wedge — Both sides slope in the same direction
Flag vs Pennant
Both come after a strong price move.
- Flag — Looks like a rectangle, price moves sideways
- Pennant — Looks like a small triangle, price compresses
Knowing the difference helps you avoid mistakes in your forex chart patterns cheat sheet or crypto chart patterns guide.
Step-by-Step: How to Trade Any Chart Pattern
Follow this simple process every time:
Step 1: Find the Pattern Look at the chart and identify the shape.
Step 2: Wait for the Breakout Do not enter early. Wait for price to break above or below the pattern boundary.
Step 3: Enter the Trade Enter after the candle closes outside the pattern with strong momentum.
Step 4: Set Your Stop Loss Place your stop loss just inside the pattern. This protects your money.
Step 5: Take Your Profit Use the size of the pattern to set your target. If the pattern was 50 points tall, aim for 50 points of profit.
This is the core of any pattern trading strategy guide and works for all markets.
Common Mistakes Beginners Make
Entering Too Early
Many beginners jump in before the breakout happens. Wait for confirmation. Patience is your best tool.
Ignoring Volume
Volume tells you how strong a breakout is. A breakout with high volume is much stronger than one with low volume.
Forcing Patterns
Not every chart has a clear pattern. Sometimes price is messy. Do not try to force a shape that is not really there. Only trade when the pattern is clear and clean.
These mistakes come up in every beginner chart patterns tutorial, so pay close attention.
Risk Management Made Easy
Even the best high probability chart patterns can fail. That is why risk management is so important.
- Never risk more than 1-2% of your money on one trade
- Always use a stop loss — no exceptions
- Do not revenge trade if you lose
Think of trading like a business. Every business has expenses. Losses are just the cost of trading. Keep them small and controlled.
Do Chart Patterns Always Work? (Honest Truth)
No. Chart patterns do not always work. Nothing in trading works 100% of the time.
Patterns give you probability, not certainty. A good pattern might work 60-70% of the time. That means it fails 30-40% of the time.
The goal is not to be right every time. The goal is to make more money when you win than you lose when you fail. That is what price action patterns list strategies teach.
Best Timeframes for Chart Patterns
Short Timeframes (5 min, 15 min)
These are used by day trading chart patterns traders. Patterns form fast but are less reliable.
Medium Timeframes (1 hour, 4 hour)
These are popular with swing trading patterns guide users. Good balance of speed and reliability.
Long Timeframes (Daily, Weekly)
Patterns on the daily and weekly chart are the most reliable. They take longer to form but give stronger signals.
Start with the daily chart. It is the easiest for beginners.
Best Market Conditions for Patterns
Trending Markets
Patterns work best when the market is trending. Continuation patterns like flags and triangles appear during strong trends.
Sideways Markets
In sideways markets, look for reversal patterns like Double Tops and Double Bottoms. Support and resistance patterns are very clear in these conditions.
Avoid trading patterns during very choppy or news-driven markets. The signals are unreliable.
Real-Life Example of a Chart Pattern Trade
Here is a simple story to make it real:
“Apple stock was moving up strongly for 3 weeks. Then price slowed down and formed a small Bull Flag. Price compressed inside the flag for 5 days. Then one morning, price broke above the flag with strong volume. A trader entered the trade. They put their stop loss below the flag. Price moved up another 8% in two weeks. They took profit and closed the trade.”
This is exactly how chart patterns with entry and exit work in real life. The process is simple. Find → Wait → Enter → Protect → Profit.
How to Combine Chart Patterns with Indicators
Patterns alone are strong. But combining them with indicators makes them even better.
Moving Averages — If price breaks out above a pattern AND above the 50-day moving average, the signal is stronger.
RSI (Relative Strength Index) — If RSI is rising when a bullish pattern forms, it confirms the move. If RSI is overbought when a bearish pattern forms, the reversal is more likely.
This is an advanced chart pattern setup that even intermediate traders use. It is one of the smartest ways to use your bar chart patterns cheat sheet in real trading.
How Candlestick Patterns Help Chart Patterns
Candlestick patterns are like a second opinion. Use them to confirm your bar chart signal.
For example:
- You see a Double Bottom on the bar chart
- The second bottom forms with a Bullish Engulfing candlestick
- Now you have two confirmations → stronger signal
Candlestick patterns do not replace your price action cheat sheet — they add to it. The two work together beautifully.
Printable Bar Chart Patterns Cheat Sheet (Summary)
Here is your quick summary — your trading cheat sheet PDF patterns reference:
- ✅ Bar charts show Open, High, Low, Close with vertical bars
- ✅ Patterns form because emotions repeat in markets
- ✅ Reversal patterns = trend changes
- ✅ Continuation patterns = trend continues
- ✅ Always wait for breakout before entering
- ✅ Use stop loss on every trade
- ✅ Combine patterns with RSI and Moving Averages
- ✅ Daily charts give most reliable signals
- ✅ Never risk more than 2% per trade
- ✅ Volume confirms breakouts
This bar chart patterns cheat sheet covers everything a trader needs to get started.
FAQs
Question: Are chart patterns reliable?
Answer: Yes, but not perfect. Good patterns work 60-70% of the time when traded correctly with proper risk management.
Question: Which pattern is best for beginners?
Answer: The Double Bottom and Bull Flag are the easy chart patterns to learn first. They are simple, clear, and appear often.
Question: Can beginners use chart patterns?
Answer: Absolutely. This beginner chart patterns tutorial was designed for new traders. Start with the top 5 patterns and practice on a demo account first.
Question: Do patterns work in forex and crypto?
Answer: Yes! This forex chart patterns cheat sheet and crypto chart patterns guide apply the same patterns across all markets.
Question: How long does it take to learn chart patterns?
Answer: With daily practice, most beginners feel comfortable within 4-8 weeks.
Final Tips for Beginners
You now have a complete bar chart patterns cheat sheet in your hands. Here is how to use it well:
Keep it simple. Do not learn 50 patterns at once. Learn 5. Master them. Then add more.
Practice on paper first. Use a demo account or just draw patterns by hand before risking real money.
Look at old charts. Go back in time and find patterns. See what happened after each one. This is the fastest way to learn.
Be patient. The best traders wait for perfect setups. Not every day has a great pattern.
Stay consistent. Trading is a skill. Skills take time. Keep going, keep learning, and the results will come.
You now have everything you need to start your journey with technical analysis for beginners. Use this guide. Come back to it often. And trade smart!
What Is a Doji Candle? Spot Reversals Like a Pro
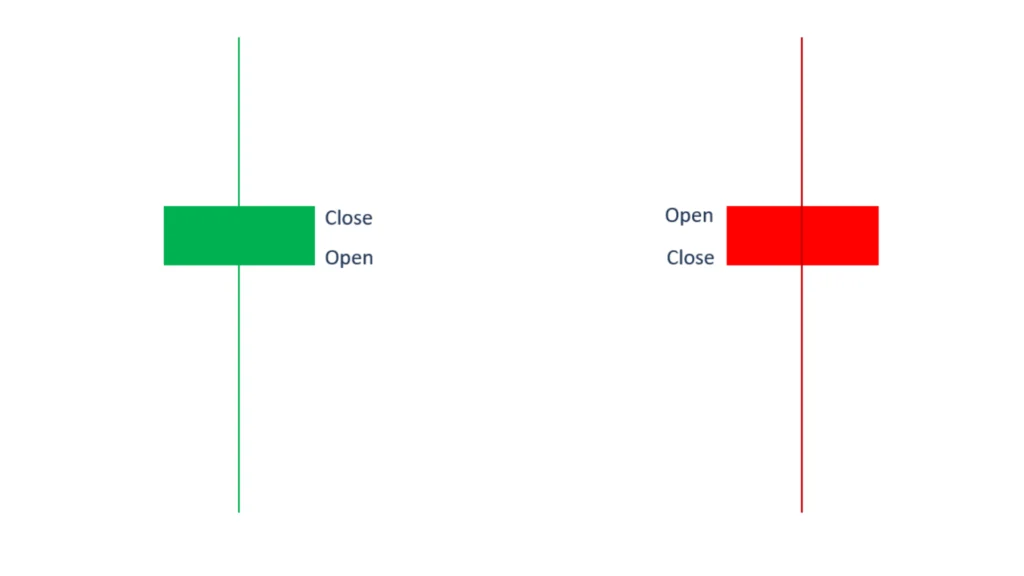
A doji candle is a special candlestick pattern you see on a price chart. It forms when the opening price and closing price are almost the same. This tiny but powerful candle tells traders something very important — the market can’t make up its mind.
Simple Meaning of a Doji Candle
Think of it like a tug of war. Both teams pull hard, but nobody moves. That’s exactly what a doji candle meaning is — buyers and sellers fought all day, but nobody won.
What It Tells About the Market
A doji candle in technical analysis shows that the market is in a state of confusion. Neither bulls (buyers) nor bears (sellers) are in control. This makes it an indecision candle pattern worth watching closely.
Why Traders Care About It
Traders love doji candles because they can signal a possible change in direction. When you see one, it’s like a yellow traffic light — slow down and pay attention.
What Does a Doji Candle Look Like?
Shape (Like a Plus ➕ or Cross ✝️)
A doji candlestick pattern looks like a plus sign or a cross. It has a very small body in the middle with lines (called shadows or wicks) going up and down.
Open Price vs Close Price
The open and close prices are almost equal. That’s why the body is so thin — sometimes just a tiny line.
Long vs Short Shadows
Some doji candles have very long shadows. Others have short ones. The length of the shadows tells you how wild the price moved during that time period.

Doji Candle in Simple Words (Easy Story)
Buyers vs Sellers Example
Imagine a fruit market. The seller wants $10 for a mango. The buyer wants to pay $8. They argue all day. At the end, they agree on $9 — almost where they started.
“No One Wins” Explanation
That’s the doji candle story. Buyers pushed the price up. Sellers pushed it back down. At the end, the price closed right where it opened. Nobody won.
Why It Shows Confusion
This is why traders call it a candlestick indecision signal. The market is confused. It doesn’t know where to go next.
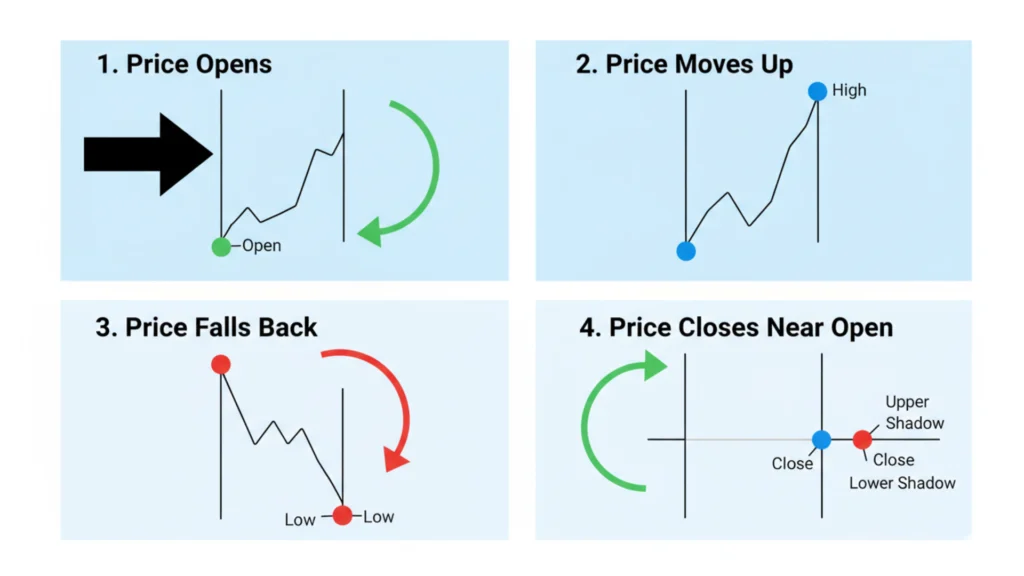
How a Doji Candle Forms (Step-by-Step)
A doji candle forms in a very simple way. First, the price opens at a certain level. Then buyers push it up — sometimes very high. Then sellers push it back down. Finally, the price closes very close to where it opened. That’s the complete story of one doji candle.
What Does a Doji Candle Mean in Trading?
Market Indecision
The most important doji candle meaning is indecision. The market is pausing. This pause can come before a big move.
Possible Trend Change
A doji candle is often a doji reversal signal. If the market was going up and then a doji appears, it might start going down. The same works in reverse.
Warning Signal (Not Confirmation)
Remember — a doji candle is just a warning. It’s not a confirmed signal. Never trade only based on a doji. Always wait for the next candle to confirm the move.
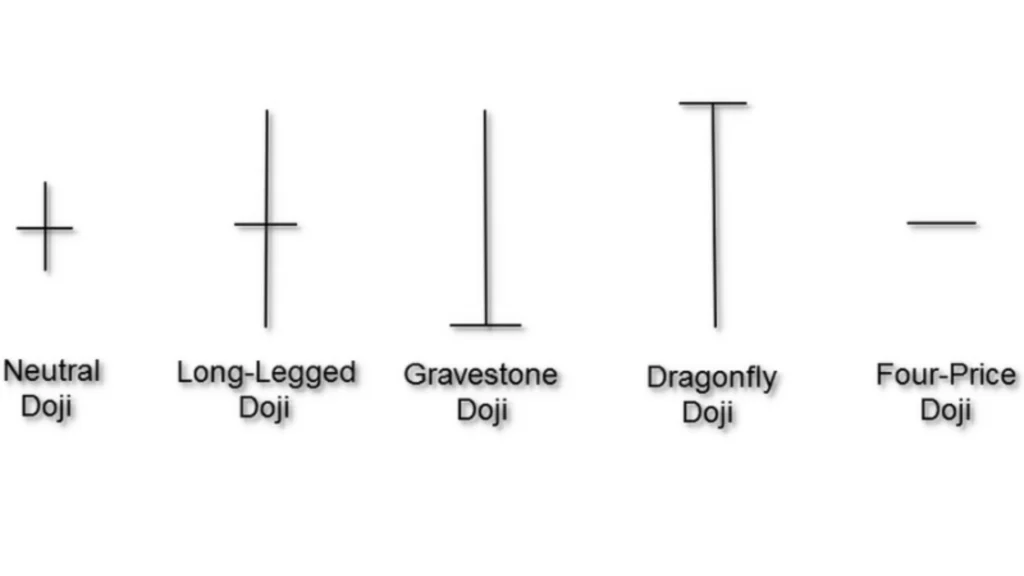
Types of Doji Candlestick Patterns
There are several types of doji candles. Each one looks a little different and tells a slightly different story.
Standard Doji
This is the basic doji. It has equal shadows on top and bottom, with a tiny body in the middle. It shows pure market indecision.
Long-Legged Doji
The long-legged doji candle has very long shadows on both sides. This means the price moved wildly in both directions before settling back. It shows extreme confusion in the market.
Dragonfly Doji
The dragonfly doji pattern has a long shadow only at the bottom and no shadow at the top. It looks like a “T” shape. This often appears at the bottom of a downtrend and can be a bullish signal.
Gravestone Doji
The gravestone doji explanation is simple: it’s the opposite of the dragonfly. It has a long shadow at the top and no shadow below. This often appears at the top of an uptrend and can be a bearish signal.
Four-Price Doji
This is a very rare doji. The open, close, high, and low are all the same price. It usually happens in very low-volume markets.
Doji Star
A doji star appears between two candles — one large candle before it and one after. It’s a strong part of reversal patterns like the morning star or evening star.
What Happens After a Doji Candle?
Possible Reversal
Many times, the market changes direction after a doji. This is what traders hope to catch using a doji breakout strategy.
Trend Continuation
Sometimes the trend just keeps going. That’s why confirmation is so important before entering any trade.
Sideways Movement
In some cases, the market stays flat after a doji. This is common in sideways markets where there’s no clear direction.
Doji Candle in Different Market Trends
In an Uptrend
A doji candle at the top of an uptrend is a warning sign. It could mean buyers are losing energy. Sellers might take over soon. This is called a doji at market top meaning.
In a Downtrend
A doji in a downtrend can mean sellers are tired. Buyers might be stepping in. This is the doji at market bottom signal — often a bullish hint.
In a Sideways Market
In a sideways or ranging market, doji candles appear often. In this case, they’re less meaningful. The market is already confused, so one more doji doesn’t help much.
Is a Doji Candle Bullish or Bearish?
Depends on Context
This is a common question. The truth is — a doji candle bullish or bearish answer depends on where it appears.
Examples of Both Cases
If a dragonfly doji appears after a big drop, it’s likely bullish. If a gravestone doji appears after a big rally, it’s likely bearish. Always look at the bigger picture.
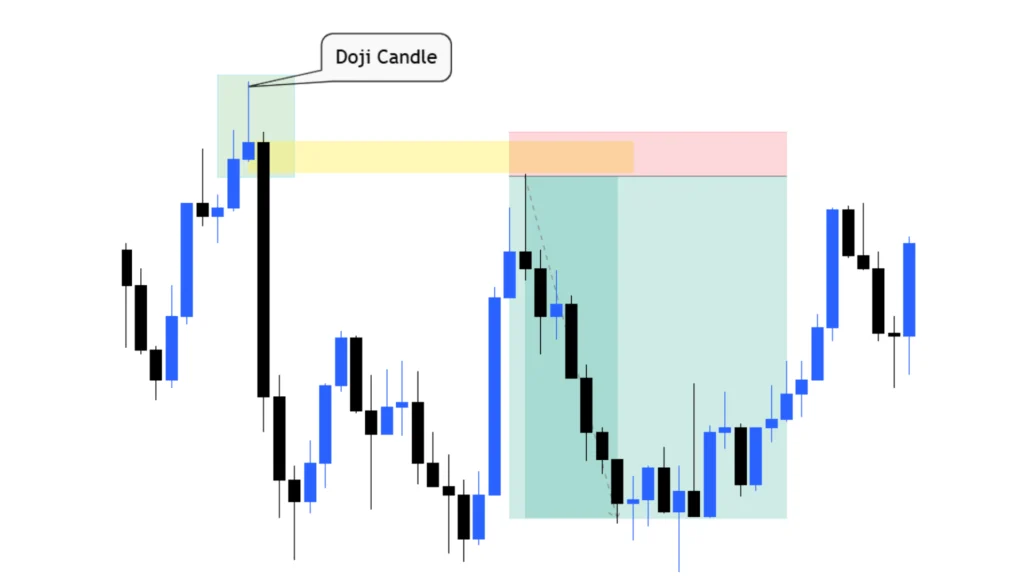
How to Identify a Doji Candle on a Chart
Look for a candle with a very small or nearly invisible body. The open and close should be almost at the same level. There should be shadows (wicks) on one or both sides. Most trading platforms will highlight these easily once you know what to look for.
How to Trade Using a Doji Candle (Step-by-Step)
Here is a simple doji candlestick strategy anyone can follow:
Step 1 – Find the Doji: Look for the cross-shaped candle on your chart.
Step 2 – Check the Trend: Is the market going up, down, or sideways?
Step 3 – Wait for Confirmation: Watch the next candle. Does it move in the expected direction?
Step 4 – Enter the Trade: Enter only after the confirmation candle closes.
Step 5 – Set Stop-Loss: Place your stop-loss just below the doji (for buy trades).
Step 6 – Set Profit Target: Use support and resistance levels to set your target.
Simple Doji Trading Strategies
Doji + Support & Resistance
If a doji forms exactly at a support or resistance level, it becomes much stronger. This is the best way to use doji support and resistance in your trading.
Doji + Trend Confirmation
Use a moving average to confirm the trend. If the price is above the moving average and a dragonfly doji forms, it can be a strong buy signal.
Doji + Multi-Candle Patterns
Combine doji with patterns like the morning star or evening star. These reversal candlestick indicators are much more reliable than a doji alone.
Best Indicators to Use with Doji
RSI: If RSI is above 70 (overbought) and a gravestone doji appears, that’s a strong sell signal. If RSI is below 30 (oversold) and a dragonfly doji forms, consider buying.
Moving Averages: Use these to identify the main trend direction before trading any doji pattern.
Volume: Always check volume. A doji with high volume is more significant.
Doji with volume analysis gives much better results than looking at the candle alone.
Doji Candle vs Other Candlestick Patterns
Doji vs Spinning Top
The doji vs spinning top candle is a common comparison. Both show indecision, but the spinning top has a slightly bigger body. A doji is more extreme in its indecision.
Doji vs Hammer
A hammer has a small body at the top and a long lower shadow. It’s a bullish pattern. A dragonfly doji looks similar but the body is almost invisible. Both can signal reversals.
Doji vs Shooting Star
A shooting star has a small body at the bottom and a long upper shadow. It’s bearish. A gravestone doji is similar but with virtually no body at all.
Doji Candle in Different Markets
Forex Trading
Doji trading strategy forex works well because forex markets are very liquid. Doji candles here are more reliable, especially on 1-hour or 4-hour charts.
Stock Market
The doji pattern in stock market trading is most useful at key earnings levels or after big news events. Always check the context.
Cryptocurrency Trading
Crypto markets are very volatile. Doji candles here can be tricky. Always use extra confirmation before trading in crypto.
How Reliable Is a Doji Candle?
A doji candle alone is not always reliable. But when you combine it with trend analysis, support/resistance, and volume, the doji candle reliability in trading improves greatly. Always look for confirmation before you act.
When You Should NOT Trust a Doji
Avoid trading doji candles in low-volume markets. Also avoid them when the market is moving sideways with no clear trend. Sometimes doji candles appear due to random price noise — these are false signals.
Common Mistakes Beginners Make
Many beginners jump into trades the moment they see a doji. Don’t do that. Always wait for the confirmation candle. Also, never ignore the trend direction. A doji in the middle of a strong trend is very different from one at a market top or bottom.
What Does 2 or 3 Doji in a Row Mean?
When you see multiple doji candles in a row, the market is showing very strong indecision. This usually means a big move is coming soon. Watch for a doji breakout strategy — when price finally breaks out of this range, it can move fast.
Advantages and Disadvantages of Doji Candle
Advantages: A doji is easy to spot even for beginners. It gives an early warning signal before a possible reversal. It works across all markets and timeframes.
Disadvantages: It’s not always reliable on its own. It needs confirmation from the next candle or other indicators. In choppy markets, it can give too many false signals.
Real Trading Examples
Winning Trade Example: A trader sees a dragonfly doji form at a key support level after a downtrend. RSI is at 28. The next candle is a big green bullish candle. The trader buys and makes a profit as price reverses upward.
Losing Trade Example: A trader sees a doji in the middle of a sideways market and jumps in too early. Price doesn’t move in any direction. The stop-loss gets hit. Lesson: always check the trend first.
Doji Candle Psychology
At its core, the doji candle is about emotions. Buyers feel excited and push the price up. Sellers feel scared and push it back down. By the end, both groups are equal. The market is confused. This moment of equal fear and greed is what makes the price action doji strategy so powerful.
Quick Checklist: What to Do When You See a Doji
✅ Check the trend direction
✅ Look at the volume — is it high or low?
✅ Wait for the next confirmation candle
✅ Check RSI or moving averages
✅ Don’t rush — patience wins
Doji Candle Cheat Sheet (Quick Summary)
| Details | |
|---|---|
| What it means | Market indecision, possible reversal |
| When to use it | At trend tops/bottoms, near support/resistance |
| When to avoid it | Low volume, sideways market, no confirmation |
FAQs About Doji Candle
Question: What is a doji candle?
Answer: A doji candle is a candlestick where the open and close prices are almost the same, showing market indecision.
Question: Is it bullish or bearish?
Answer: It depends on where it appears. Context and confirmation matter most.
Question: How often does it appear?
Answer: Doji candles are fairly common, especially in volatile markets. But strong ones with clear signals are less frequent.
Question: Is it profitable?
Answer: Yes, when used with other tools and proper confirmation. Not reliable alone.
Question: Does color matter?
Answer: Not much for a standard doji. The shape and location matter more than the color.
Final Conclusion
The doji candle is one of the most useful tools in technical analysis — but only when you understand it properly. It signals confusion in the market. It warns you that a change might be coming. But it is never a reason to trade blindly.
Always wait for confirmation. Always check the trend. Always use it with other tools like RSI, moving averages, and volume. That’s how smart traders use the doji candlestick pattern to make better decisions — not bigger mistakes.

Quant Trader Guide: Skills, Strategies & How to Start
Have you ever wondered how some people use computers to trade stocks automatically? That’s what a quant trader does. Instead of guessing or going with feelings, a quant trader uses math, data, and smart programs to make trading decisions.
More and more people are interested in this career. Why? Because it combines two cool things — finance and technology. You don’t need to sit and stare at charts all day. Your system does the work for you.
In this guide, you’ll learn exactly what a quant trader is, what skills you need, how to get started, and how much money you can make. Let’s keep it simple and fun.
What Is a Quant Trader? (Easy Explanation)
A quant trader is someone who uses math and computers to decide when to buy or sell things like stocks, currencies, or crypto. The word “quant” comes from “quantitative,” which just means using numbers.
Think of it like this: imagine a robot that watches prices all day. When it sees a pattern — like a price dropping in a way it has seen before — it automatically makes a trade. That robot follows rules built by a quant trader.
A quantitative trader doesn’t rely on gut feelings. Everything is based on data, statistics, and tested strategies. This makes decisions faster and more consistent than human guessing.

What Does a Quant Trader Do?
Daily Tasks (Simple Version)
Every day, a quant trader does a few key things:
- Checking data – Looking at price history, market trends, and news
- Building strategies – Writing rules for when to buy or sell
- Testing ideas – Running old data through new strategies to see if they work
- Placing trades – Letting the system execute trades automatically
It’s more like being a scientist than a traditional trader. You test ideas, look at results, and improve your system step by step.
A Day in the Life of a Quant Trader
- Morning – Check overnight data, review if any automated trading strategies made trades, look at market news
- Afternoon – Write or improve code, work on algorithmic trading systems, fix bugs
- Evening – Run backtesting on new ideas, review results, plan for tomorrow
How Quant Traders Make Money (Step-by-Step)
Here’s a super simple breakdown of how a quant trader earns profit:
- Find patterns in data – Look at historical prices and find repeating trends
- Build a strategy – Create rules: “If price drops 3%, buy. If it rises 5%, sell.”
- Test it – Use old data to check if the strategy would have worked in the past
- Use it in real trading – Run the strategy live with real money
Simple Example: You notice that every Monday morning, a certain stock’s price drops a little. So you build a program that automatically buys it Monday morning and sells it by Wednesday when it usually goes back up. That’s a basic data-driven trading strategy.
Skills You Need to Become a Quant Trader
Technical Skills
To work as a quant trader, you need:
- Basic math – Things like averages, percentages, and statistics
- Statistics – Understanding patterns, probability, and risk
- Programming (Python) – Python for quantitative trading is the most used tool to build and test strategies
You don’t need to be a genius. You just need to be willing to learn step by step.
Soft Skills
Technical knowledge isn’t everything. You also need:
- Patience – Strategies take time to develop and test
- Problem-solving – Things will break. You need to figure out why.
- Curiosity – The best quantitative analysts in trading always ask “why does this pattern happen?”

What Programming Languages Do Quant Traders Use?
- Python – The most popular choice. Easy to learn, has tons of libraries for data analysis and backtesting trading strategies. Perfect for beginners.
- R – Great for statistical analysis. R programming for trading models is widely used in academic and research settings.
- C++ – Used in high-frequency trading (HFT) where speed matters every millisecond. This is more advanced and not needed for beginners.
Start with Python. Once you’re comfortable, explore others.
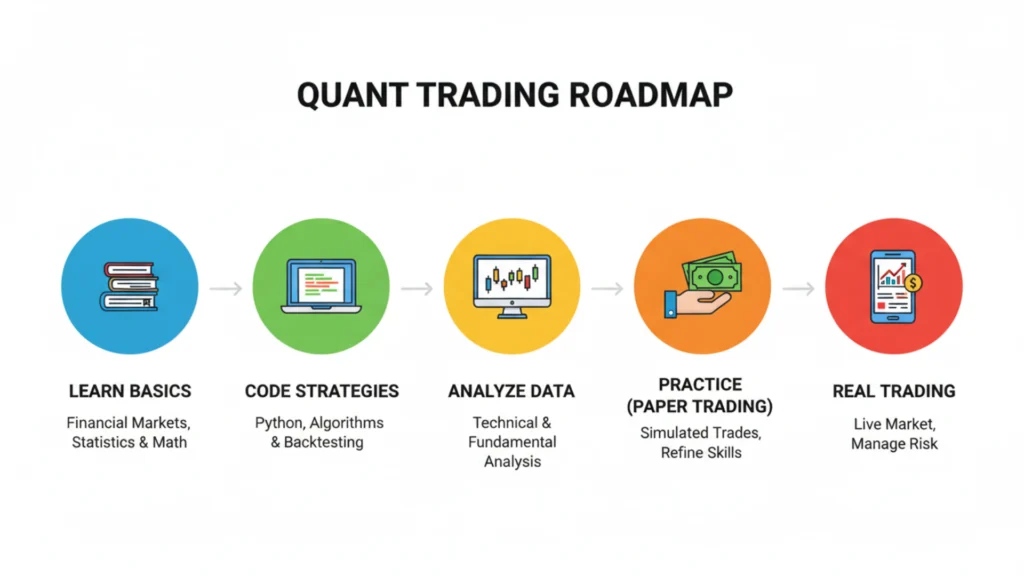
Step-by-Step Roadmap to Become a Quant Trader
Step 1 – Learn Basics
Start with simple math and coding. Learn Python basics. Understand what stocks and markets are. No experience needed — just start.
Step 2 – Practice with Data
Download free stock data and play with it. Build small projects like tracking price changes or finding averages. This builds your confidence.
Step 3 – Build Strategies
Try to create your first simple rule-based strategy. Something like: “Buy when the price falls below its 10-day average.” This is the beginning of algorithmic trading systems.
Step 4 – Test Without Risk (Paper Trading)
Paper trading means pretending to trade without real money. You test your automated trading strategies in real market conditions but with fake money. This is a safe way to learn.
Step 5 – Start Real Trading
Once your strategy works in testing, you can use a small amount of real money. Start small. Learn. Grow slowly.
Best Tools for Quant Traders (Beginner-Friendly)
- Python – For writing strategies and analyzing data
- Excel – For quick data checks and simple models. Great for beginners.
- Trading platforms – Tools like Alpaca, Interactive Brokers, or QuantConnect allow you to test and run your quant trading tools and platforms easily
Each tool has a purpose. Python is your brain, Excel is your notebook, and trading platforms are your marketplace.
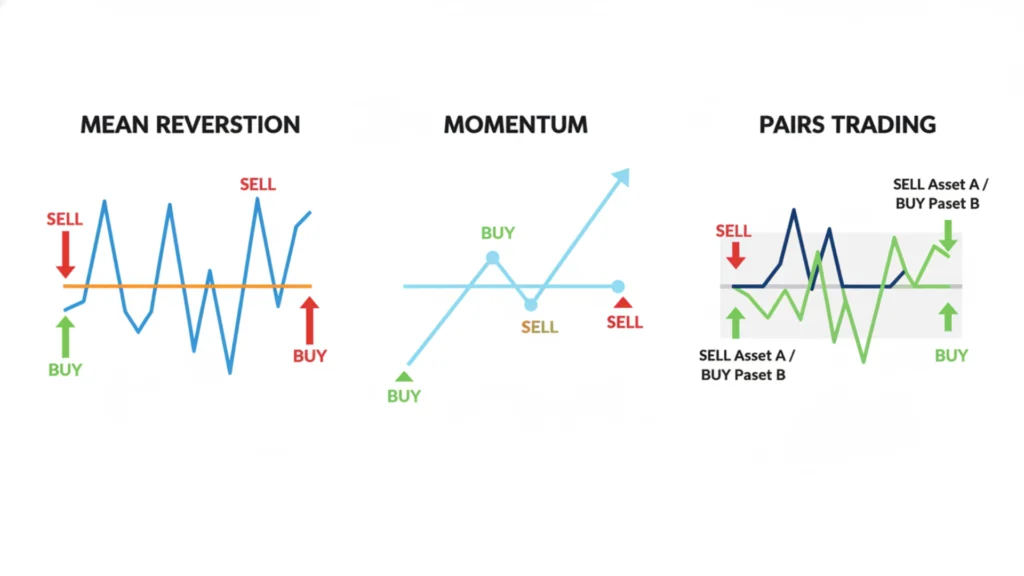
Popular Quant Trading Strategies (Simple Examples)
Mean Reversion
This strategy says: “What goes up must come down, and what goes down must come back up.” If a stock price falls way below its average, you buy it. When it bounces back, you sell. Simple and widely used in quantitative finance trading.
Momentum Trading
This one says: “What’s going up will keep going up for a while.” You buy things that are rising fast and sell when the speed slows down. It’s a popular alpha generation strategy.
Pairs Trading
You find two stocks that usually move together. When one goes up and the other doesn’t follow, you bet they’ll balance out. This is called statistical arbitrage trading. It’s clever and data-driven.
Advantages and Disadvantages of Quant Trading
Advantages
- No emotions – The system follows rules. No panic selling or greedy buying.
- Fast decisions – Algorithmic trading systems can react in milliseconds
- Consistent – Same rules applied every time
Disadvantages
- Can lose money – No strategy works 100% of the time. Risk management in quant trading is essential.
- Needs learning – It takes time to understand math, coding, and markets
How Much Do Quant Traders Make?
- Beginner – Around $60,000 to $100,000 per year at a firm
- Experienced – $150,000 to $500,000+ especially in quantitative hedge fund strategies roles
- Freelance/Independent – Unlimited, but also risky. Depends on your strategy’s success.
Salaries vary by country, company, and skill level. Top quant traders at big hedge funds earn millions.
How Long Does It Take to Become a Quant Trader?
- 3–6 months – Learn the basics of math, Python, and markets
- 6–12 months – Build and test your first strategies
- 1–2 years – Become confident and ready for professional or independent trading
Everyone moves at a different pace. Consistent effort beats speed every time.
Can You Become a Quant Trader Without a Degree?
Yes, absolutely. Many successful quant traders are self-taught. What matters most is:
- Can you code?
- Can you build and test strategies?
- Do you have real projects to show?
A strong portfolio of trading projects speaks louder than a degree in many cases. Self-learning through free courses, books, and practice is a real path.
Quant Trader vs Other Careers
Quant Trader vs Data Scientist
Both use data and Python. But a quant trader focuses on financial markets while a data scientist may work in healthcare, retail, or tech. Quant trading has higher income potential but also higher pressure.
Quant Trader vs Day Trader
A day trader watches charts and uses instincts. A quant trader builds systems and lets algorithms decide. Quant trading removes emotions and is more systematic.
Quant Trader vs Software Engineer
A software engineer builds apps and websites. A quantitative analyst in trading builds financial models and algorithms. Some skills overlap, but the goals are very different.
Common Mistakes Beginners Make
- Not testing strategies – Never trade with real money without proper backtesting trading strategies first
- Risking too much money – Start small. Protect your capital.
- Copying others blindly – Strategies that work for one person may fail for you. Understand what you’re using.
Understanding Risk in Quant Trading (Simple)
Every trade has a chance of winning or losing. Risk management in quant trading means controlling how much you can lose.
Think of it like this: if you have $1,000, never risk more than $50 on one trade. That way, even if you lose 10 times in a row, you still have money to keep going.
Good quant traders focus more on not losing than on winning big.
Your First Simple Quant Trading Strategy
Here’s the simplest strategy to start with:
- Buy when a stock’s price drops 5% below its 20-day average
- Sell when it rises back to the average
That’s it. Simple. Test this on historical data using Python. See how it performs. Improve it. This is how systematic trading begins.
Best Free Resources to Learn Quant Trading
- Books – “Quantitative Trading” by Ernest Chan, “Python for Finance” by Yves Hilpisch
- YouTube – Channels like QuantPy, Algorithmic Trading TV, and financial modeling tutorials
- Free Courses – Coursera, edX, and Khan Academy have great math and Python courses for beginners
Start with free resources. You don’t need to spend money to learn the basics.
What Kind of Person Should Become a Quant Trader?
You’d be a great quant trader if you:
- Love working with numbers and logic
- Get curious when something doesn’t make sense
- Are patient enough to test ideas before using them
- Enjoy solving puzzles and problems
If that sounds like you, this career could be a perfect fit.
Myths vs Reality of Quant Trading
Myth: It’s easy money. Build one strategy and get rich fast. Reality: It takes months of learning, testing, and improving. Most strategies fail at first. Success comes from persistence and discipline.
Myth: You need a fancy degree from a top university. Reality: Skills and results matter more. Many self-taught quant traders work at top firms.
Can You Work From Home as a Quant Trader?
Yes! This is one of the best things about being a quant trader:
- Remote jobs – Many firms hire remote quantitative analysts
- Freelancing – Build strategies for clients or funds
- Personal trading – Trade your own capital from anywhere in the world
With a laptop and internet, you can work from home, a café, or anywhere you like.
Final Beginner Checklist
Before you start trading real money, make sure you can check these off:
✔ Learn Python basics ✔ Understand basic math and statistics ✔ Build at least 1 simple strategy ✔ Test it using backtesting tools ✔ Start with a very small amount of real money
Quant Trader FAQs
Question: What is a quant trader?
Answer: A quant trader is someone who uses math, statistics, and computer programs to make financial trading decisions automatically.
Question: Is it hard to learn?
Answer: It takes effort, but with consistent practice and free resources, anyone can learn the basics. Start with Python and simple math.
Question: Do I need a degree?
Answer: No. Skills and a strong project portfolio matter more than a degree in most cases.
Question: How much money do I need to start?
Answer: You can start paper trading with zero real money. When you’re ready, even $500–$1,000 is enough to test your first live strategy safely.
Conclusion: Is Quant Trading Right for You?
Being a quant trader is exciting but not easy. It combines math, coding, and finance in a unique way. You can work from home, earn well, and let systems do the heavy lifting — but only after putting in the hard work to build those systems.
If you love numbers, enjoy solving problems, and have patience, this could be the perfect career path. Start small, learn daily, and don’t give up when things get hard.
The best time to start learning is today.
What Time Does Stock Market Open? US, UK, Asia & More
If you are new to trading, the first question you probably ask is — what time does stock market open?
The simple answer is: it depends on which country’s market you are talking about.
In the US, the stock market opens at 9:30 AM Eastern Time (ET). In the UK, it opens at 8:00 AM GMT. Every country has its own stock exchange opening hours. The biggest markets in the world are in the US, UK, Europe, and Asia.
The most famous markets are the NYSE (New York Stock Exchange) and NASDAQ in the US, the London Stock Exchange in the UK, and the Tokyo Stock Exchange in Japan.
What Time Does Stock Market Open Pakistan (PKT)
Pakistan is in the PKT (Pakistan Standard Time) zone, which is UTC+5. This matters a lot if you want to trade in foreign markets.
US Market Opening in PKT: The US stock market opens at 9:30 AM ET. In Pakistan, that equals 7:30 PM PKT (during standard time) or 6:30 PM PKT during US daylight saving time.
UK Market Opening in PKT: The London Stock Exchange opens at 8:00 AM GMT. In Pakistan, that is 1:00 PM PKT.
Other Major Markets in PKT:
- Tokyo opens at 9:00 AM JST = 6:00 AM PKT
- Hong Kong opens at 9:30 AM HKT = 6:30 AM PKT
- Sydney opens at 10:00 AM AEST = 5:00 AM PKT
Easy Table of Global Stock Market Opening Times
US Stock Market Hours
The US stock market hours run from 9:30 AM to 4:00 PM ET, Monday to Friday. This is the regular trading session. The market opening bell rings at exactly 9:30 AM on Wall Street.
UK Stock Market Hours
The London Stock Exchange is open from 8:00 AM to 4:30 PM GMT. It is one of the busiest markets in the world and has a huge impact on global trading.
European Market Hours
Most European markets open between 8:00 AM and 9:00 AM CET and close around 5:00 to 5:30 PM CET. Major markets include Frankfurt, Paris, and Amsterdam.
Asian Market Hours
Asian markets open early. Here is a quick look:
- Tokyo (TSE): 9:00 AM – 3:30 PM JST
- Hong Kong (HKEX): 9:30 AM – 4:00 PM HKT
- Shanghai: 9:30 AM – 3:00 PM CST
Note: Many Asian markets close for a lunch break in the middle of the day.
Australian Market Hours
The Australian Securities Exchange (ASX) is open from 10:00 AM to 4:00 PM AEST. Australia is one of the first major markets to open each day.
South American Market Hours
Brazil’s B3 exchange opens at 10:00 AM to 5:00 PM BRT. South American markets are less talked about but very active.

Why Do Stock Markets Have Opening and Closing Times?
Stock markets do not stay open all day because buyers and sellers need a fixed time to meet and trade fairly.
Think of it like a busy local market. Everyone shows up at the same time. They buy and sell. Then the market closes. This way, prices are fair for everyone.
Without fixed hours, trading would be messy and confusing. Fixed stock market hours also help regulators watch what is happening and keep things honest.
Are Stock Markets Open on Weekends?
No. Stock markets are closed on Saturdays and Sundays.
Most major exchanges like the NYSE and NASDAQ only operate Monday through Friday. This gives traders, brokers, and companies time to rest and review the week.
Some crypto markets are open 24/7, but regular stock markets are not. Always check the stock market schedule today before planning a trade.
What Are Pre-Market, Regular Market, and After-Hours?
Pre-Market Trading
Pre-market trading starts as early as 4:00 AM ET in the US. This is when some traders start buying and selling before the official market open time.
It is less busy and sometimes more risky. Not all brokers allow pre-market trading. Prices can jump a lot because fewer people are trading.
Regular Trading Hours
This is the main session. For the US, it runs from 9:30 AM to 4:00 PM ET. This is when the most trading happens and prices are most stable. Beginners should focus on this time.
After-Hours Trading
After the market closes at 4:00 PM ET, some trading continues until 8:00 PM ET. This is called after-hours stock trading time.
News often comes out after the market closes. This can cause big price moves. It is exciting but also risky for new traders.
What Time Does the US Stock Market Open?
NYSE Opening Time
The New York Stock Exchange opens at 9:30 AM Eastern Time (ET). The famous opening bell rings every weekday morning. Wall Street comes alive at this moment.
Nasdaq Opening Time
The NASDAQ also opens at 9:30 AM ET. Both the NYSE and NASDAQ follow the same regular trading session hours.
US Market Opening in Different Time Zones
- EST: 9:30 AM
- CST: 8:30 AM
- MST: 7:30 AM
- PST: 6:30 AM
- PKT (Pakistan): 7:30 PM (standard time)
- GMT (UK): 2:30 PM
What Is Daylight Saving Time (DST) and Why It Matters?
Daylight Saving Time (DST) is when the US and UK move their clocks forward by one hour in spring and back in autumn.
This changes the stock market opening time for people in other countries. For example, in Pakistan, the US market opens at 7:30 PM PKT during standard time. But during DST, it shifts to 6:30 PM PKT.
International traders must always check DST dates to avoid confusion. DST in the US usually starts in March and ends in November.
Do All Countries Have the Same Stock Market Hours?
No. Every country sets its own stock trading hours based on local time, culture, and laws.
Some markets like the US run for 6.5 hours. Others like Hong Kong have a lunch break in the middle. And some smaller markets open for only a few hours a day.
This is why understanding global stock market opening times is so important, especially if you trade international stocks.
Which Stock Market Opens First in the World?
The trading day starts in Asia, moves to Europe, and then ends in the Americas.
- Sydney (ASX) is often the first major market to open.
- Then comes Tokyo, Hong Kong, and Shanghai.
- After that, London and European markets open.
- Finally, New York opens last among the big markets.
This chain means that something happening in Asia can affect prices in Europe and then the US later the same day.
Why Some Stock Markets Close for Lunch
Some Asian stock markets, like those in Hong Kong and Shanghai, close for a lunch break of about one to two hours.
This is a cultural and practical tradition. It gives traders time to review the morning session, eat, and prepare for the afternoon. It is not common in Western markets like the US or UK.
Best Time to Trade Stocks for Beginners
For beginners, the mid-morning period is usually the safest. Around 10:30 AM to 11:30 AM ET is calmer than the opening rush.
Prices are more stable and easier to read. There is enough trading activity to buy and sell without big surprises. Starting in calmer hours helps new traders build confidence.
Worst Time to Trade Stocks (High Risk Times)
The first 30 minutes after the market opens (9:30 to 10:00 AM ET) can be very wild. Prices jump up and down fast. This is called opening volatility.
The last 30 minutes before close (3:30 to 4:00 PM ET) is also high risk due to the closing rush. Many traders exit their positions, causing quick price moves.
Beginners should avoid these times until they have more experience.
Power Hour in the Stock Market
Power Hour is the last hour of trading, from 3:00 PM to 4:00 PM ET. This is one of the busiest and most exciting times of the day.
Big traders and institutions make large moves. Volume goes up. Prices can change quickly. Experienced traders love this time, but it is risky for beginners.
How to Check If the Stock Market Is Open Today
There are easy ways to find out:
- Google it: Just search “is the stock market open today” and Google shows the answer instantly.
- Trading apps: Apps like Robinhood, TD Ameritrade, or your local broker app will show market status.
- Broker platforms: Most broker websites have a market status indicator on the home screen.
Always check before you plan to trade, especially around public holidays.
Examples: If You Live in Pakistan, When Should You Trade US Stocks?
Let us say you live in Lahore or Karachi. Here is when you should be ready:
- US market opens at 9:30 AM ET = 7:30 PM PKT (standard time)
- Pre-market starts at 4:00 AM ET = 2:00 PM PKT
- US market closes at 4:00 PM ET = 2:00 AM PKT
So for Pakistanis, trading US stocks means staying up in the evening and night. Many traders in Pakistan focus on pre-market data during the day and execute trades after 7:30 PM.
Trading Hours on Holidays
Stock markets close on national holidays. For example, the NYSE closes on Christmas Day, Thanksgiving, and Independence Day.
Different countries have different holidays. The Tokyo market closes on Japanese national holidays. The London exchange closes on UK bank holidays.
Always check the US stock market holiday schedule before trading. A surprise market closure can leave your orders unexecuted.
Common Mistakes Beginners Make About Market Timing
Time zone confusion is the biggest mistake. Many new traders forget to convert market times to their local time and miss the opening.
Another common mistake is thinking stock markets are open 24/7. They are not. Only forex and crypto run around the clock.
Some beginners also forget about daylight saving time changes and get confused when the market opens an hour earlier or later than expected.
Beginner Tips Before the Market Opens
Before the market opens each day, try to:
- Check the news: Big news affects stock prices. Read headlines before trading.
- Plan your trades: Know what you want to buy or sell before the bell rings.
- Stay calm: Do not rush. The market will be open for hours. You do not need to trade in the first minute.
Good preparation is the secret weapon of smart traders.
Visual Timeline of a Stock Market Day
Pre-Market
4:00 AM – 9:30 AM ET — Early birds trade here. Low volume, higher risk. News drives prices before the official open.
Market Open
9:30 AM ET — The opening bell rings. Prices move fast. Lots of buying and selling happens in the first 30 minutes.
Mid-Day Trading
11:30 AM – 2:00 PM ET — Things slow down. Prices are calmer. A good time for careful beginners to make moves.
Market Close
3:30 PM – 4:00 PM ET — Activity picks up again. Power Hour begins. Traders close or adjust positions before the end of the day.
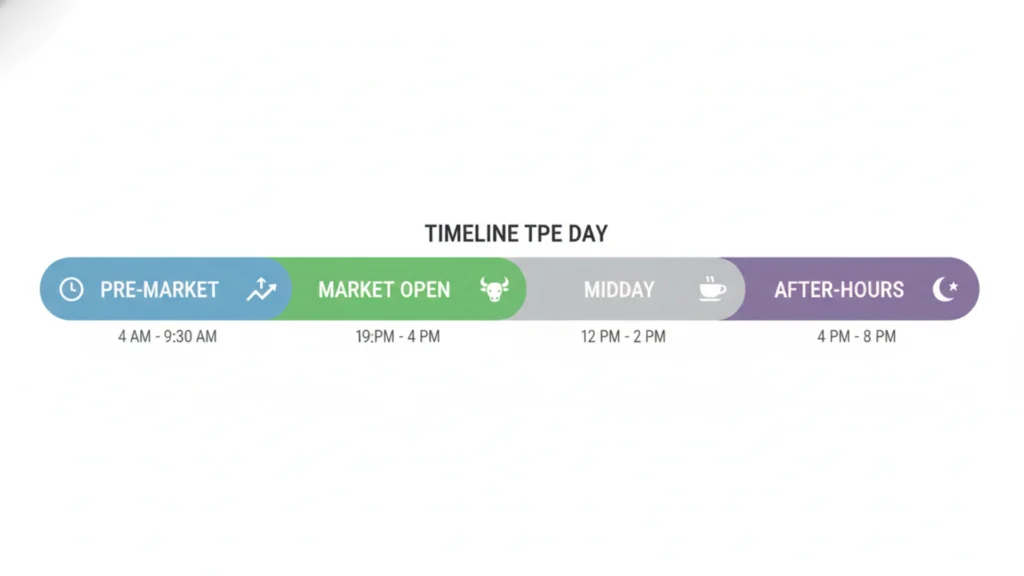
Frequently Asked Questions (FAQs)
Question: What time does the US stock market open in Pakistan?
Answer: The US stock market opens at 9:30 AM ET, which is 7:30 PM PKT during US standard time and 6:30 PM PKT during daylight saving time.
Question: Is the stock market open today?
Answer: You can check by searching on Google or opening your broker app. Most broker platforms show real-time market status.
Question: Can I trade stocks at night?
Answer: Yes, through after-hours trading from 4:00 PM to 8:00 PM ET. But it is riskier and not ideal for beginners.
Question: What is pre-market trading?
Answer: Pre-market trading happens before the official open, starting as early as 4:00 AM ET. It allows traders to react to overnight news before the regular session begins.
Key Takeaways (Quick Summary)
- The US stock market opens at 9:30 AM ET and closes at 4:00 PM ET
- For Pakistan, the US market opens at 7:30 PM PKT
- Pre-market trading starts at 4:00 AM ET; after-hours ends at 8:00 PM ET
- Stock markets are closed on weekends and holidays
- Asia opens first, then Europe, then the US
- DST can shift opening times by one hour
- Beginners should trade during calm mid-morning hours
- Always check the market schedule before trading
Conclusion
Understanding what time does stock market open is one of the first steps to becoming a smart trader. Whether you are in New York, London, or Pakistan, knowing the right time to trade can make a big difference.
Start by learning the US stock market hours and your local time zone. Use apps and Google to stay updated. Avoid the risky opening and closing rush until you are confident.
The stock market is full of opportunity — but timing matters. Trade smart, stay patient, and always do your homework before the bell rings. 🚀

YoY in Trading & Finance: Formula, Examples & Calculator
What Is YoY (Year Over Year)?
YoY stands for Year Over Year. It is a way to compare something from this year to the same thing from last year. Think of it like checking how much you grew taller compared to last birthday.
In finance, Year Over Year helps you see if a company, stock, or market is doing better or worse than before. It is one of the most used tools in trading and investing.
Why YoY Is Important in Trading and Finance
YoY is important because it gives you the big picture. Instead of looking at just one month, you look at a full year. This removes random ups and downs and shows you the real trend.
Traders and investors use year over year growth to decide if a company is worth buying. If a company keeps growing every year, that is a good sign.
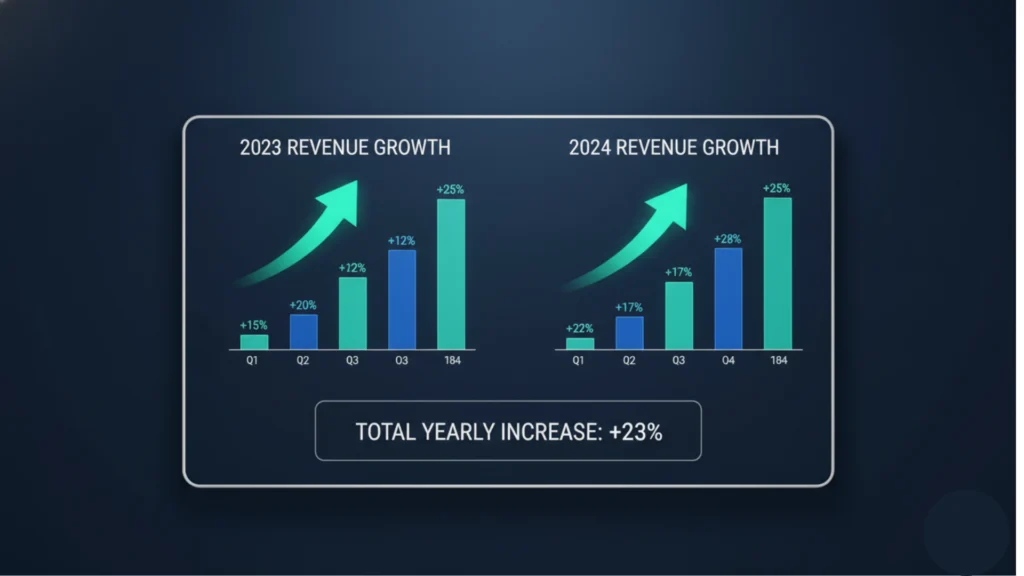
How YoY Works in Trading
Comparing Current vs Previous Year
Year Over Year works by taking two numbers — one from this year and one from last year — and comparing them. You find the difference and then turn it into a percentage.
For example, if a stock’s earnings were $100 last year and $120 this year, the YoY growth is 20%. Simple.
Why Traders Use Yearly Comparison
Traders use YoY because monthly numbers can be misleading. One bad month does not mean a company is failing. But if a company is losing money year after year, that is a real problem.
Annual comparison smooths out seasonal changes. A toy company always sells more in December. Year Over Yearhelps you compare December to December — not December to January.
Real-Life Trading Perspective
Imagine you are looking at two companies. Company A grew its sales by 30% year over year. Company B dropped by 10%. Which one would you invest in? Most smart traders would choose Company A.

YoY Formula (With Simple Explanation)
YoY Formula Breakdown
The Year Over Year formula is very easy. Here it is:
YoY Growth (%) = ((Current Year Value − Previous Year Value) ÷ Previous Year Value) × 100
That is all. Just three steps.
Step-by-Step Calculation
- Take the current year value
- Subtract the previous year value
- Divide that number by the previous year value
- Multiply by 100 to get the percentage
Easy Example
Last year revenue: $200,000 This year revenue: $250,000
YoY = ((250,000 − 200,000) ÷ 200,000) × 100 YoY = (50,000 ÷ 200,000) × 100 YoY = 25%
The company grew by 25% year over year.
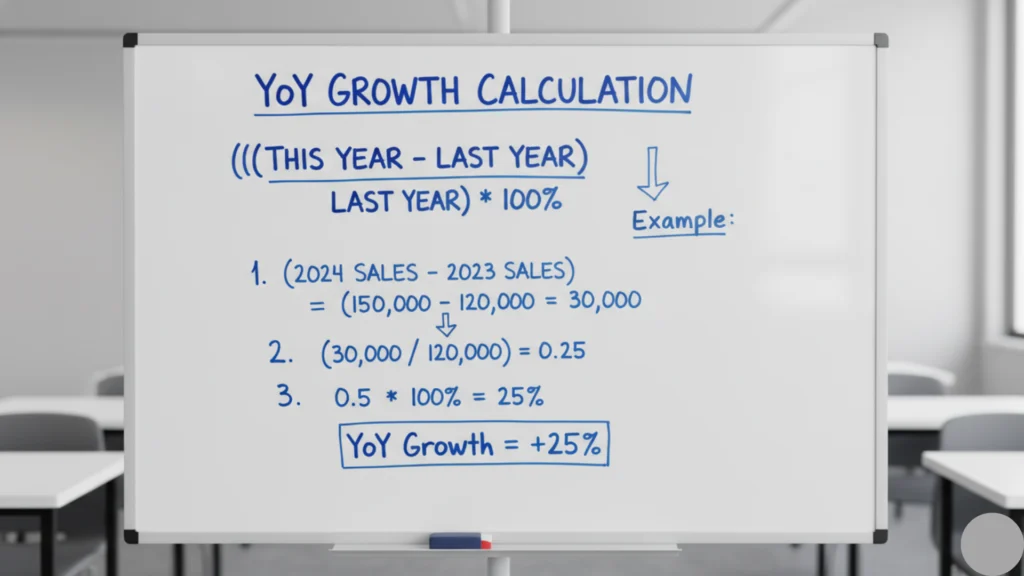
Year Over Year Growth Calculation Example
Example With Numbers
Let us say you are tracking a stock. The company earned $5 per share last year. This year it earned $6 per share.
YoY = ((6 − 5) ÷ 5) × 100 = 20% growth
Positive Growth Case
Positive Year Over Year means the company is growing. A 20% year over year increase is great. It tells you the business is getting stronger. Investors love positive Year Over Year numbers.
Negative Growth Case
Now imagine the company earned $5 last year but only $4 this year.
YoY = ((4 − 5) ÷ 5) × 100 = −20%
This is negative growth. It means the company made less money. This could be a warning sign for traders.
📊 Free YoY Calculator
YoY Growth Calculator
Crypto Price Checker
How to Use YoY in Stock Trading
Finding Strong Companies
When picking stocks, look for companies with consistent year over year revenue growth. If a company grows 15–25% every year, that is a strong signal. It shows stability and business health.
Revenue Growth Analysis
Revenue Year Over Year tells you if the company is selling more. Sales going up year after year means customers love the product. This is one of the first things serious traders check.
Profit Comparison
Revenue growth is good. But profit growth is even better. A company can sell more but still lose money. Always check if profits are also growing year over year. That is the real sign of a healthy business.
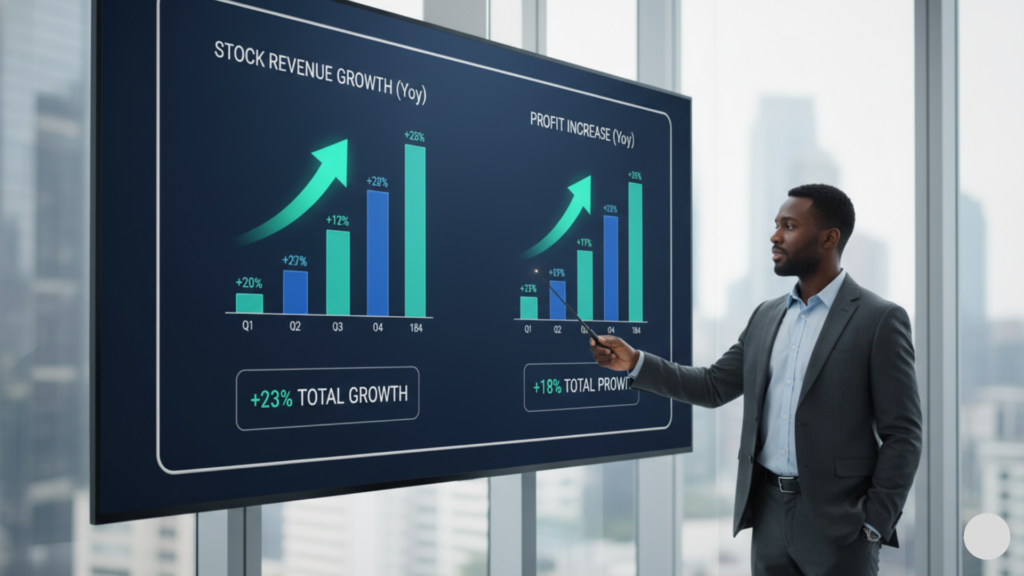
YoY in Crypto and Forex Trading
Crypto Yearly Growth Analysis
In crypto, YoY helps you see how much a coin has grown in one year. Bitcoin going from $20,000 to $60,000 in a year is a 200% Year Over Year gain. This kind of data helps long-term crypto holders make smart decisions.
Forex Market Long-Term Trends
In forex, Year Over Year is used to track how a currency has moved over one year. If the US dollar strengthened 8% against the Euro year over year, that tells a lot about economic trends.
Volatility Consideration
Crypto and forex are very volatile. Year Over Year gives a better picture than daily or weekly changes. But always combine it with other tools. One good year does not mean the next will be the same.
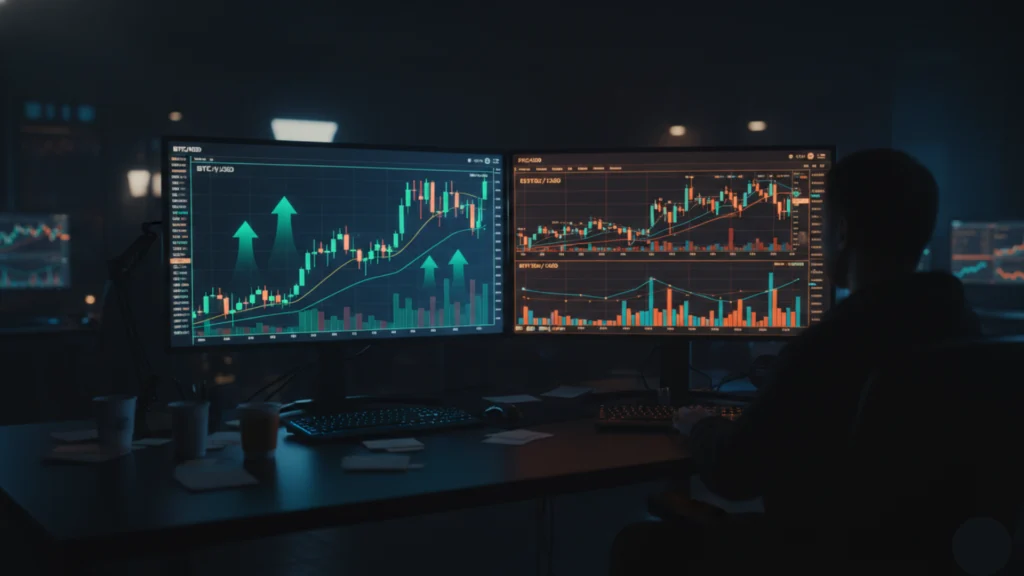
YoY in Fundamental Analysis
Revenue (Sales Growth)
Fundamental analysts use Year Over Year to check if a company’s sales are growing. Strong year over year sales growth means the business is expanding. This is a key metric before buying any stock.
Earnings (Profit Growth)
Earnings per share (EPS) growing Year Over Year is one of the best signs of a healthy company. Many top investors only buy stocks with strong and consistent earnings growth year after year.
Company Performance Tracking
By tracking multiple years of data, you can spot trends. Is the company growing faster or slower? Is it consistent? YoY gives you this complete performance picture quickly.
What Is a Good Year Over Year Growth Rate?
Positive vs Negative Growth
Any positive YoY is better than negative. Even 5% growth means the company is moving forward. Negative YoY means things are going backward. Always watch for two or more years of negative Year Over Year — that is a red flag.
Industry-Based Variation
A good YoY rate depends on the industry. Tech companies might grow 30–50% per year. Banks might grow 5–10%. Always compare a company’s YoY to others in the same industry.
Beginner-Friendly Explanation
If you are new to trading, think of it this way. 10–20% Year Over Year growth is solid. Over 25% is excellent. Under 0% means something is wrong. Use this as your starting guide.
YoY vs MoM vs QoQ (Simple Comparison)
Year Over Year (Yearly)
YoY compares year to year. Best for long-term analysis. Removes seasonal effects. Used by investors and fundamental analysts.
MoM (Monthly)
MoM means Month over Month. It compares this month to last month. Good for spotting fast changes. Used in short-term analysis and reporting.
QoQ (Quarterly)
QoQ means Quarter over Quarter. It compares one 3-month period to the previous one. Companies report earnings every quarter, so QoQ is very popular with stock traders.
When to Use Each
Use Year Over Year for big-picture, long-term decisions. Use QoQ for quarterly earnings analysis. Use MoM for short-term trends and fast markets like crypto.
Advantages of YoY Analysis
Removes Short-Term Noise
Markets go up and down every day. Year Over Year removes all that noise. It shows you what really happened over a full year. That is much more reliable.
Shows Real Growth
Year over year numbers show true business performance. Not one lucky month or one bad week. Real, meaningful growth or decline.
Useful for Long-Term Traders
If you invest for months or years, Year Over Year is your best friend. It helps you find companies that grow consistently. That is how long-term wealth is built.
Limitations of YoY in Trading
Not Useful for Short-Term Trading
If you are a day trader or scalper, Year Over Year is useless. You need minute-by-minute data. Year Over Year is too slow for short-term strategies.
Ignores Recent Trends
YoY only looks at two points in time. It does not tell you what happened in between. A company could have crashed mid-year and recovered — YoY would miss that.
Needs Other Indicators
Never use Year Over Year alone. Always combine it with other tools like moving averages, P/E ratio, and cash flow data for a complete picture.
Common Mistakes Traders Make with YoY
Relying Only on YoY
Some beginners look at Year Over Year and make decisions right away. That is risky. Year Over Year is one tool, not the whole toolbox.
Ignoring Market Conditions
A company might show negative Year Over Year during a recession. That does not mean it is a bad company. Always check what was happening in the overall market that year.
Misreading Negative Growth
Negative Year Over Year is not always a disaster. Sometimes a company spends more to grow faster. Short-term losses can lead to long-term profits. Always look deeper.
Pro Tips to Use YoY Like a Smart Trader
Combine With Technical Analysis
Use Year Over Year for the fundamental side. Use charts and technical indicators for the timing side. Together, they make a powerful strategy.
Use With Other Metrics
Pair YoY with P/E ratio, debt levels, and cash flow. This gives you a 360-degree view of a company’s health.
Always Check Multi-Year Data
One year of great YoY could be luck. Look at 3 to 5 years of Year Over Year data. Consistent growth over multiple years is the real gold.
When NOT to Use YoY
Day Trading / Scalping
If you buy and sell within hours or minutes, forget Year Over Year. You need real-time data and short-term indicators.
Highly Volatile Assets
For meme coins or super-volatile stocks, yearly data can be completely misleading. Use shorter timeframes instead.
Short-Term Decisions
Making a trade that lasts a few days? YoY will not help you here. It is built for patience and long-term thinking.
FAQs About Year Over Year
Question: What Does YoY Mean in Simple Words?
Answer: Year Over Year means comparing this year’s number to last year’s number. It shows if things got better or worse over one year.
Question: How Do You Calculate YoY Growth?
Answer: Use this formula: ((Current Year − Previous Year) ÷ Previous Year) × 100. The result is your YoY percentage.
Question: Is Year Over Year Important for Trading?
Answer: Yes, especially for long-term traders and investors. It helps you find strong, growing companies and avoid weak ones.
Question: What Is a Good Year Over Year Percentage?
Answer: It depends on the industry. Generally, 10–20% is good. Above 25% is excellent. Negative Year Over Year is a warning sign that needs investigation.
Conclusion
YoY is one of the most powerful tools in trading and finance. It gives you a clear, clean look at how something has grown or shrunk over one full year. For long-term traders and investors, year over year analysis is essential.
But remember — no single tool is perfect. Always combine Year Over Year with technical analysis, other financial metrics, and market context. Use it as part of your full trading strategy, not as your only decision-maker.
When used smartly, Year Over Year can help you find strong stocks, avoid weak companies, and make smarter, more confident trading decisions. Start using it today and level up your trading game.
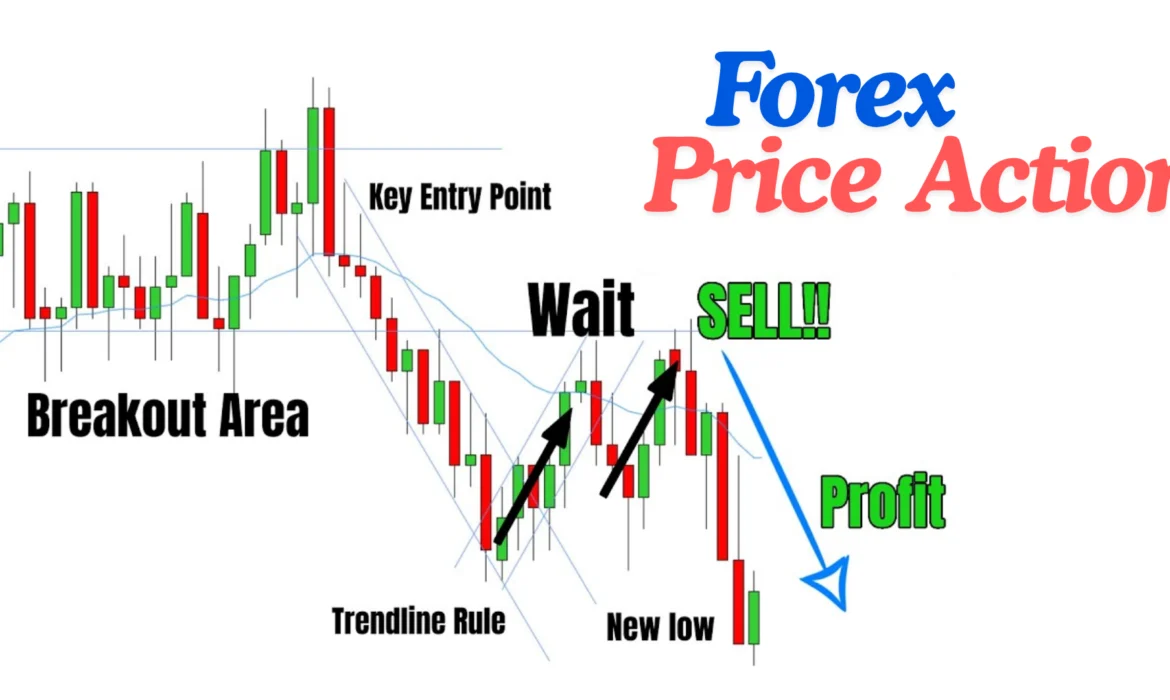
Forex Price Action: Simple Guide for New Traders
What Is Forex Price Action Trading?
Forex price action trading means reading the market using only price movement. No fancy tools. No confusing indicators. Just the raw price on your chart.
Simple Definition of Forex Price Action
Price action is how the price of a currency moves over time. When you look at a chart and see candles going up and down — that’s Forex price action. Traders study these movements to predict where price might go next.
Why Traders Use Price Instead of Indicators
Many traders prefer pure price action trading because indicators lag. They show what already happened. Price itself is live. It tells you the story right now. Using forex price action signals means you’re reading the market in real time.
Clean Charts vs Indicator-Based Charts
A clean chart has no indicators — just candles, lines, and levels. An indicator-based chart has many colorful lines that can confuse beginners. Forex trading without indicators keeps things simple and clear.
Basic Forex Terms You Must Know
Before you start, learn these simple words. They come up every day in forex price action trading.
What Is a Candlestick?
A candlestick is a small shape on your chart. It shows four things: the open price, close price, high, and low. Green candles mean price went up. Red candles mean price went down. Forex candlestick patterns are the building blocks of price action.
What Is a Trend (Up, Down, Sideways)?
A trend is the direction price is moving. Up trend means higher highs and higher lows. Down trend means lower highs and lower lows. Sideways means price is stuck in a range. Trend trading using forex price action is one of the safest strategies.
What Is Support and Resistance?
Support is a price level where buyers step in and stop the price from falling. Resistance is where sellers push price back down. Support and resistance trading forex is a core skill every beginner must learn.
What Is a Breakout and Retest?
A breakout happens when price pushes past a support or resistance level. A retest is when price comes back to that broken level before continuing. The forex breakout and retest strategy is very popular among forex price action traders.
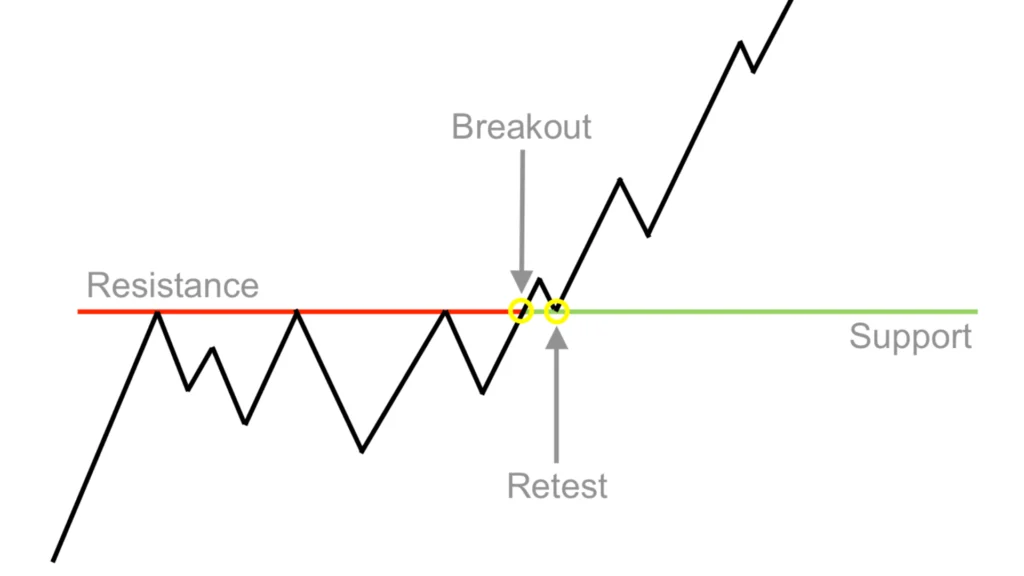
How Price Action Trading Works
Market Structure Made Easy
Market structure means understanding how price forms highs and lows. If price keeps making higher highs, it’s bullish. If it keeps making lower lows, it’s bearish. Forex market structure trading helps you see the big picture.
Understanding Buyer vs Seller Power
Every candle shows a battle between buyers and sellers. A big green candle means buyers won. A big red candle means sellers won. Forex Price action supply and demand zones show where these battles happen most.
How Price Moves in the Market
Price doesn’t move in a straight line. It moves in waves — up, then pulls back, then up again. Understanding this helps you find better entry points using forex price action entry signals.
How to Read Price Action
Reading Candlestick Patterns Easily
Look at the shape of each candle. A long wick at the top means sellers rejected higher prices. A long wick at the bottom means buyers rejected lower prices. These are called rejection candles, and they’re very important in forex price action trading tips for beginners.
Identifying Trend Direction
Draw a simple line connecting the lows in an uptrend or the highs in a downtrend. If price is making higher highs and higher lows — it’s going up. Keep it simple.
Spotting Strong vs Weak Moves
Strong moves have big candles with little wicks. Weak moves have small candles or lots of wicks. Price action momentum trading focuses on catching strong, clean moves.
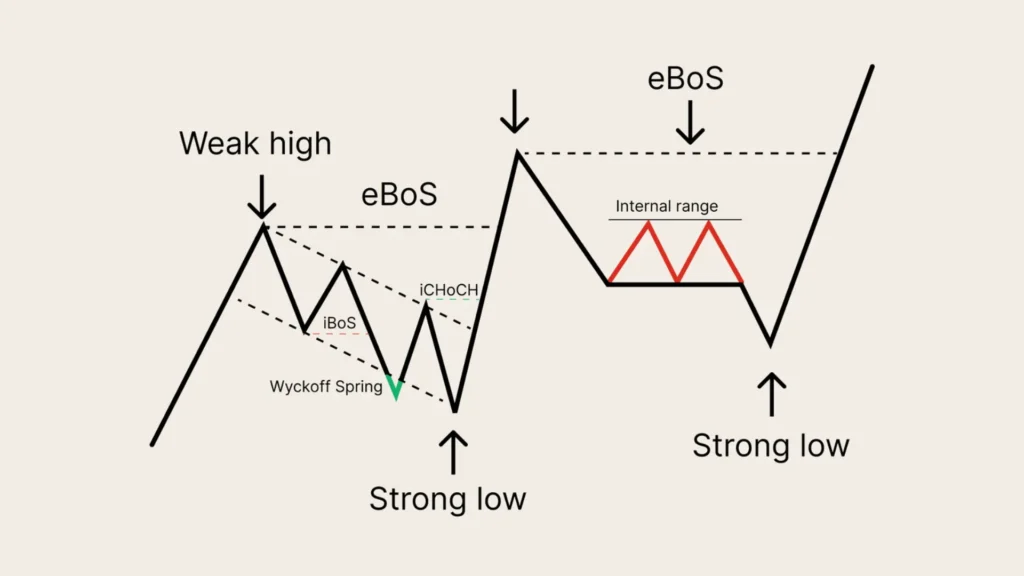
Common Price Action Patterns
Rejection Candles (Wicks)
A pin bar is a candle with a very long wick and a small body. It shows strong rejection. The forex pin bar strategy uses this candle to enter trades in the opposite direction of the wick.
Break and Retest Pattern
Price breaks a key level, comes back to test it, and then continues. This gives you a low-risk entry. It’s one of the best price action forex setups available.
Consolidation and Breakout
Sometimes price moves sideways for a while. This is consolidation. When it finally breaks out, it often moves fast and far. The price action breakout strategy targets these moments.
Head and Shoulders Pattern
This is a reversal pattern. It has three peaks — left shoulder, head, and right shoulder. When the neckline breaks, price usually drops. It’s a key part of price action reversal patterns.
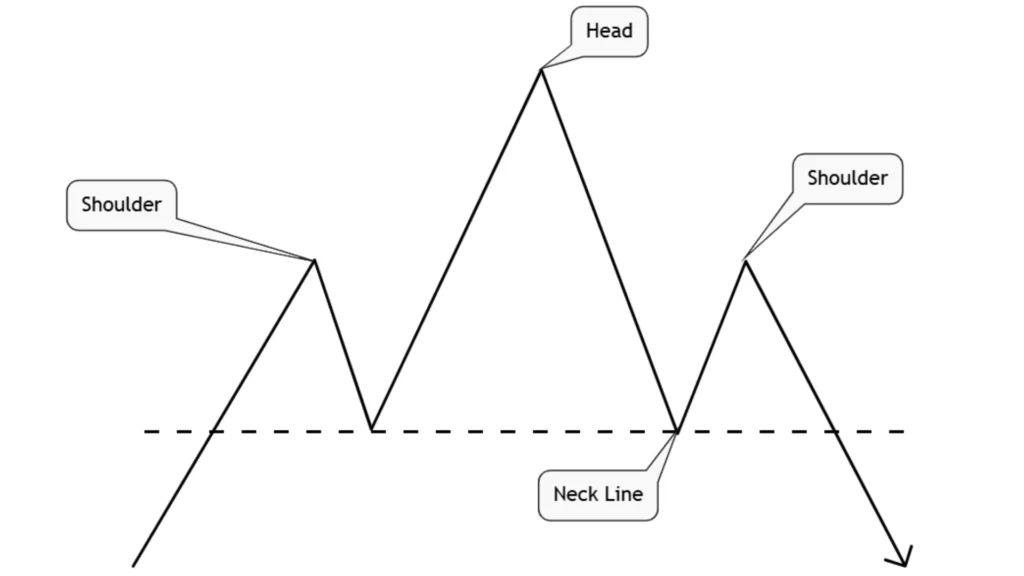
Types of Forex Price Action Trading Strategies
Trend Following Strategy
Follow the trend. Only take buys in an uptrend. Only take sells in a downtrend. Simple and effective for daily price action trading strategy.
Breakout Trading Strategy
Wait for price to break a key level with a strong candle. Enter on the breakout. Set your stop below the broken level. This is a classic price action breakout strategy.
Retracement Trading Strategy
Wait for price to pull back inside a trend. Enter when price resumes the original direction. Forex swing trading price action often uses this approach.
Reversal Trading Strategy
Look for signs that the trend is ending. Use price action reversal patterns like pin bars or engulfing candles. The engulfing candle forex strategy is very powerful here.
Advanced Price Action Strategies
Advanced forex price action techniques include multi timeframe price action analysis, trading forex liquidity zones, and reading order flow. These take time to learn but are very rewarding.
Step-by-Step: How to Start Price Action Trading
Step 1: Choose a Forex Broker
Pick a regulated broker with low spreads. Make sure they support MetaTrader 4, 5, or TradingView. Best price action forex pairs to start with are EUR/USD, GBP/USD, and USD/JPY.
Step 2: Open a Chart
Open a clean candlestick chart. Remove all indicators. Set your timeframe to daily or 4-hour to start.
Step 3: Identify the Trend
Ask yourself: Is price going up, down, or sideways? Use recent highs and lows to decide.
Step 4: Mark Support & Resistance
Draw horizontal lines at key price levels where price has reversed before. These are your trading zones.
Step 5: Wait for Entry Signal
Don’t rush. Wait for a clear forex price action confirmation signal like a pin bar or engulfing candle at your key level.
Best Timeframes for Price Action Trading
What Are Timeframes?
A timeframe is how much time each candle represents. A 1-hour candle shows one hour of price movement. A daily candle shows one full day.
Best Timeframes for Beginners
Start with the daily or 4-hour chart. These are slower and less noisy. They give cleaner forex price action setups.
Scalping vs Swing Trading Timeframes
Price action scalping strategy uses 1-minute to 15-minute charts. Intraday price action forex strategy uses 1-hour charts. Swing trading uses daily and weekly charts. Each has its own style and risk level.
Real Trade Examples (Simple Explanation)
Example of a Buy Trade
Price is in an uptrend. It pulls back to a support level. A pin bar forms. You enter a buy trade above the pin bar high. Your stop goes below the wick. Price moves up and hits your target.
Example of a Sell Trade
Price is in a downtrend. It pulls back to a resistance level. An engulfing candle forms pointing down. You enter a sell below the candle low. Price drops to your target.
What Went Right or Wrong
Good trades follow the trend and have clear confirmation. Bad trades are taken out of emotion or at random levels. Always review your trades to improve.
Risk Management in Forex Price Action
What Is Risk Management?
Risk management means protecting your money. Even the best forex price action trading course will tell you — managing risk is more important than finding good trades.
How to Use Stop Loss
A stop loss is an automatic exit if price moves against you. Always set it at a logical level — below support for buys, above resistance for sells.
Risk-to-Reward Ratio Explained Simply
If you risk $10, aim to make at least $20. That’s a 1:2 ratio. Price action risk management means never taking a trade where the risk is more than the reward.
Never Risk Too Much Money
Never risk more than 1–2% of your account on a single trade. This keeps you safe even after a losing streak.
Trading Psychology (Control Your Emotions)
Fear in Trading
Fear makes you close trades too early or not enter at all. Trust your setup. Price action trading psychology teaches you to follow your plan, not your feelings.
Greed in Trading
Greed makes you stay in trades too long or overtrade. Take your profit at your target. Don’t wait for more.
Importance of Patience
Good setups don’t happen every minute. Wait for the right moment. Patience is your biggest edge in how to trade price action forex.
How to Stay Calm While Trading
Take deep breaths. Step away from the screen if needed. Never trade when you’re angry, tired, or emotional.
Common Mistakes Beginners Make
Overtrading
Trading too much leads to losses. Take only high-quality setups. Less is more in price action forex signals trading.
Ignoring the Trend
Never fight the trend. Trading against it is one of the biggest beginner mistakes in forex chart patterns analysis.
Entering Without Confirmation
Always wait for a clear signal before entering. Don’t guess. Forex Price action confirmation signals save you from bad trades.
Not Using Stop Loss
Never trade without a stop loss. The market can move fast. One bad trade without a stop can wipe out your account.
Daily Trading Routine (Simple Checklist)
Check Market Trend
Every morning, check if the market is going up, down, or sideways. Use the daily chart first.
Mark Key Levels
Draw your support and resistance levels. Mark any forex price action supply and demand zones you see.
Wait for Setup
Don’t force a trade. Watch for a clean setup — a pin bar, engulfing candle, or breakout at a key level.
Manage Your Trade
Once in a trade, let it run. Move your stop to breakeven once price moves in your favor. Follow your plan.
Best Tools & Platforms for Price Action Trading
Charting Platforms (e.g., TradingView)
TradingView is the best free charting platform. It’s clean, easy to use, and great for naked forex trading method. You can draw levels and see multiple timeframes easily.
Choosing a Forex Broker
Pick a broker with low spreads, fast execution, and regulation. Avoid brokers with hidden fees.
Useful Trading Tools
Use a simple economic calendar to avoid trading during big news. A trading journal helps you track and improve your performance. These are among the best forex price action indicators free of cost.
How to Practice Forex Price Action Trading
Using a Demo Account
A demo account uses fake money but real market data. Practice your forex price action strategy here before risking real money.
What Is Backtesting?
Backtesting means going back through old charts and testing your strategy. It shows you how your setup performed in the past.
Practice Before Real Trading
Spend at least 2–3 months on demo and backtesting. Don’t rush into live trading. Mastering Forex price action trading for beginners takes time.
Price Action in Forex vs Other Markets
Forex vs Stocks
Forex runs 24 hours. Stocks have set hours. Forex is more liquid, which makes price action patterns cleaner and more reliable.
Forex vs Crypto
Crypto is very volatile. Price action works, but fakeouts are common. Forex is more structured and suits the naked forex trading method better.
Is Forex Price Action the Same Everywhere?
Yes. The core idea is the same in all markets. Buyers and sellers always leave clues on the chart. Price action forex strategies can be applied to any market.
Simple Price Action Trading Plan (Template)
Entry Rules
Only enter in the direction of the trend. Wait for a pin bar or engulfing candle at a key level. Use price action confirmation signals before entering.
Exit Rules
Set a target at the next key support or resistance level. Move stop to breakeven once trade is halfway to target.
Risk Rules
Risk only 1% per trade. Always use a stop loss. Maintain a minimum 1:2 risk-to-reward ratio.
Example of a Simple Plan
“If EUR/USD is in an uptrend on the daily chart, and price pulls back to support on the 4-hour chart, and a pin bar forms — I will buy with a stop below the pin bar and target the previous high.”
When NOT to Trade
During Big News Events
Big news like Non-Farm Payrolls or central bank decisions causes wild, unpredictable moves. Avoid trading 30 minutes before and after major news.
When Market Is Too Slow
If the market is barely moving, there’s no opportunity. Low volatility means no clean forex price action setups.
When You Feel Emotional
Never trade when you’re angry, sad, or overly excited. Emotions destroy discipline. Price action trading psychology starts with self-control.
Does Price Action Trading Work?
Pros of Price Action Trading
It’s simple. It works on any timeframe and any market. It teaches you to understand the market deeply. Advanced price action techniques are used by professional traders worldwide.
Limitations and Challenges
It takes time to learn. It requires patience and discipline. Not every setup works perfectly. You will have losing trades.
Who Should Use It
Anyone who wants to trade forex without indicators. Beginners who want a clean, simple approach. Experienced traders who want deeper market understanding.
Frequently Asked Questions (FAQs)
Is Price Action Good for Beginners?
Yes! It’s actually one of the best ways for beginners to start. It teaches you how the market really works, without confusing tools.
Can I Trade Without Indicators?
Absolutely. Many professional traders use the naked forex trading method and nothing else. Clean charts lead to clearer thinking.
How Much Money Do I Need to Start?
You can start with as little as $100 on some brokers. But always start on a demo account first. Focus on learning, not earning.
How Long Does It Take to Learn?
Most traders need 6–12 months of consistent practice to get comfortable. Some take longer. Speed depends on how much you practice and study.
Beginner-Friendly Summary
Key Points to Remember
Forex price action trading is about reading raw price movement. Learn candlestick patterns, market structure, and key levels. Use simple strategies like trend following, breakout, and retracement. Always manage your risk. Control your emotions. Practice daily.
Final Simple Advice
Start slow. Learn one setup at a time. Use a demo account. Never risk money you can’t afford to lose. Forex price action is a skill — and like all skills, it gets better with practice and patience. Stay consistent, stay patient, and the results will come.
Forex Trend Trading: Easy Strategies & Tips for Beginners
What is Forex?
Forex means “foreign exchange.” It is the place where people buy and sell currencies from different countries. It is the biggest financial market in the world. Millions of people trade every single day.
What is Currency Trading?
Currency trading means you swap one country’s money for another. For example, you trade US dollars for euros. The price of each currency changes every second. Traders try to guess which way the price will go.
How People Make Money in Forex
Traders make money by buying a currency when it is cheap and selling it when it gets more expensive. If you buy euros at a low price and the price goes up, you sell and keep the difference as profit.
Simple Real-Life Example
Imagine you go on holiday to Europe. You change 100 dollars into euros. When you come back, you change the euros back into dollars — and you get 105 dollars. That small difference is how forex profit works!
What is Forex Trend Trading?
Forex trend trading is a way of trading where you follow the direction the market is already moving. Instead of guessing where the price will go, you simply go with the flow.
Meaning in Simple Words
If prices are going up, you buy. If prices are going down, you sell. That is the basic idea of forex trend trading.
“Follow the Direction” Concept
Think of it like swimming with the current in a river. It is much easier than swimming against it. Trend traders follow the current — they trade in the same direction the market is already moving.
Why Forex Trend Trading Works
Markets move in trends most of the time. Big banks, governments, and institutions push prices in one direction for weeks or months. Trend traders ride these big moves and collect profits along the way.
Why Trend Trading is Good for Beginners
Forex trend trading is one of the best ways to start trading. Here is why beginners love it.
Less stress than fast trading. You do not need to watch your screen every second. Trends last for hours, days, or even weeks. You have time to think.
Easier to understand. The idea is simple — follow the trend. No complicated math or secret formulas needed.
Works in real markets. This is not just theory. Forex Trend trading is used by professional traders all over the world every single day.
What is a Trend in Forex?
A trend is when prices keep moving in one direction for some time. It is not a straight line — it goes up and down a little, but the overall direction stays the same.
Simple definition: A trend is the general direction the market is heading.
Types of trends:
- Uptrend (price goes up): Prices make higher highs and higher lows. The market is climbing.
- Downtrend (price goes down): Prices make lower highs and lower lows. The market is falling.
- Sideways (no clear direction): Prices move left and right without going clearly up or down.
Types of Trends by Time
- Major (long-term): These trends last months or even years. Big movements driven by economic changes.
- Intermediate (medium-term): These last weeks to a few months. Good for swing traders.
- Minor (short-term): These last hours to a few days. Useful for short term forex trend trading strategy traders.
The Stages of a Forex Trend
Every trend goes through four stages. Understanding these stages helps you trade smarter.
- Start of trend: Price breaks out of a quiet zone and starts moving. Volume increases.
- Strong movement: The trend picks up speed. This is the best time to be in the trade.
- Weakening phase: The trend slows down. Smaller moves, more noise.
- Trend reversal: The trend ends and goes the other direction. Trend reversal forex signals appear here.
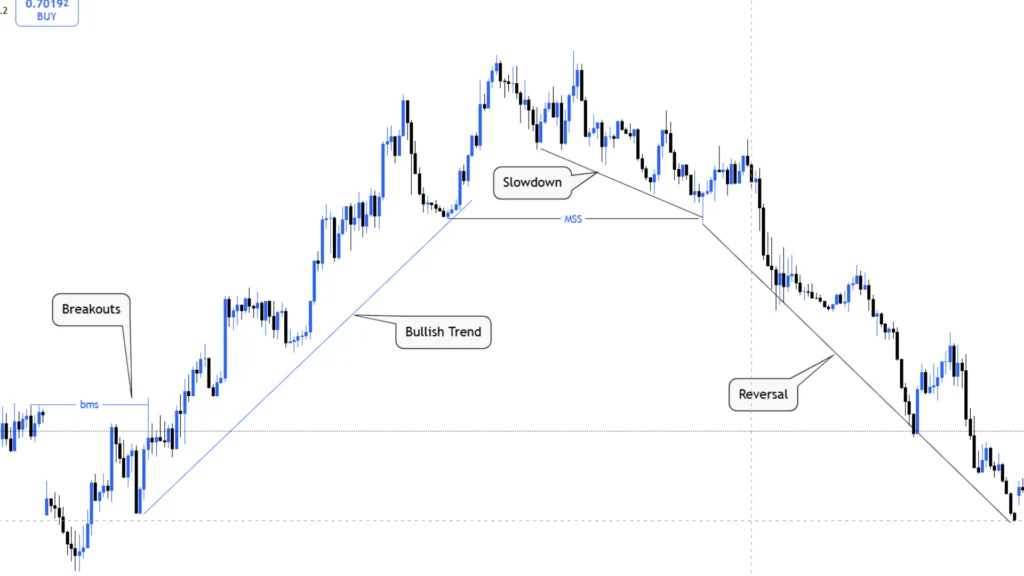
How to Identify a Trend (Easy Methods)
Trend analysis forex is about spotting which direction the market is going. Here are four easy methods.
Method 1: Higher Highs & Higher Lows
In an uptrend, every new high is higher than the last one. Every dip is also higher than the last dip. This is the clearest sign of an uptrend. The opposite is true for a downtrend.
Method 2: Using Moving Averages
A moving average smooths out price data so you can see the trend clearly. Moving average forex trend trading is very popular. If the price is above the moving average, the trend is up. If it is below, the trend is down.
Method 3: Trendlines
Draw a straight line connecting the lows in an uptrend or the highs in a downtrend. This is called trend line trading forex. When price stays above the line, the uptrend is alive.
Method 4: Indicators (ADX, RSI)
Indicators are tools built into trading charts. The ADX indicator forex trend trading tells you how strong the trend is. The RSI tells you if the market is overbought or oversold. Both are great for trend confirmation indicators forex.
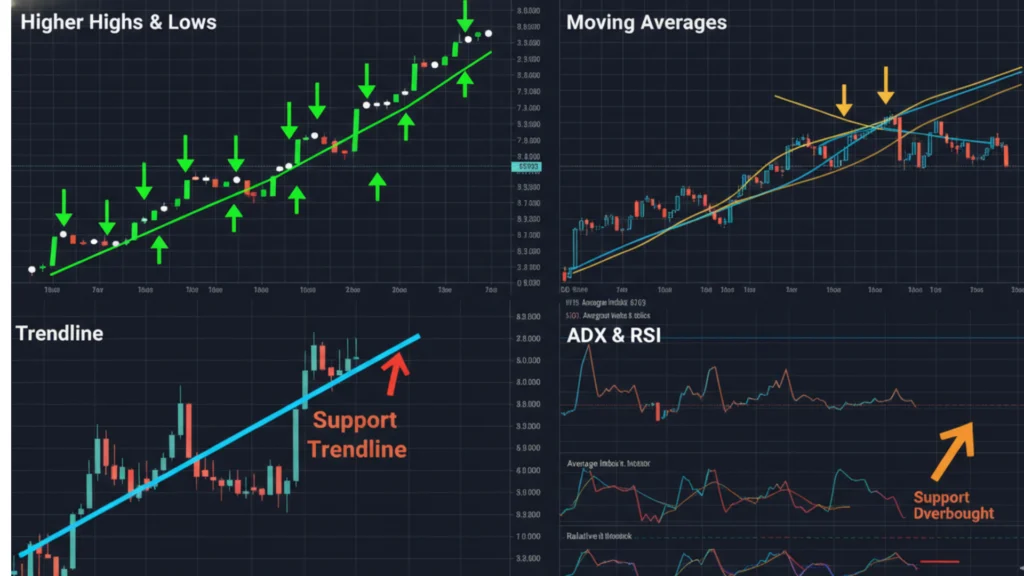
Best Indicators for Forex Trend Trading
Forex market trend indicators help you see and confirm trends. Here are the most popular ones.
Moving Averages
Moving averages show the average price over a period of time. The 50-day and 200-day moving averages are the most used. They help you stay on the right side of the market.
Relative Strength Index (RSI)
RSI measures the speed of price movement. It goes from 0 to 100. Above 70 means overbought. Below 30 means oversold. It helps you avoid entering at the wrong time.
Bollinger Bands
Bollinger Bands are three lines on the chart. When price moves close to the upper band, the market is strong. When it touches the lower band, the market may be weak. They also show when a breakout is coming.
Average Directional Index (ADX)
ADX is one of the best trend strength indicators forex traders use. A reading above 25 means a strong trend. Below 20 means the market is flat or ranging. Always check ADX before entering a trend trade.
Donchian Channels
Donchian Channels show the highest high and lowest low over a set period. When price breaks above the top channel, it signals an uptrend. When it breaks below, a downtrend may start.
Popular Forex Trend Trading Strategies
There are many profitable forex trend trading strategies. Here are the five most popular ones.
1. Breakout Trading
The forex trend breakout strategy works when price breaks through a key level. You enter the trade as soon as the breakout happens. This is great for catching the start of new trends.
2. Retracement Trading
Price never moves in a straight line. It pulls back before continuing. In retracement trading, you wait for the pullback and enter at a better price. Support and resistance trend trading is used here to find the right spots.
3. Range Trading
Sometimes the market moves sideways. In range trading, you buy at the bottom of the range and sell at the top. But this is not really forex trend trading — it is used when there is no clear trend.
4. News-Based Trend Trading
Big news events like interest rate decisions can start powerful trends. News-based trend trading means you watch the economic calendar and trade after major announcements.
5. Trend Following Strategy
The forex trend following system simply means you stay in the trade as long as the trend continues. You use trailing stops to lock in profits. This is one of the best trend trading strategy forex methods for beginners.
Trading with Price Action
Price action forex trend trading means reading the chart without using many indicators. You study how the price moves and make decisions from that.
What is price action? It is the study of raw price movement. No extra tools — just the candlestick chart.
Candlestick basics: Each candlestick shows you the open, close, high, and low price for a time period. Green candles mean price went up. Red candles mean price went down.
Key patterns:
- Engulfing pattern: A large candle that covers the previous candle. It signals a possible reversal or strong continuation.
- Support & resistance: Support is a price floor where buyers show up. Resistance is a ceiling where sellers take over. These levels help you plan trades.
Chart Patterns for Trend Trading
Trend continuation patterns forex help you spot where the trend will continue after a pause.
Ascending Triangle
This pattern forms in an uptrend. Price keeps hitting a flat resistance level but makes higher lows. When it breaks through the resistance, the uptrend continues.
Descending Triangle
This is the opposite. Price keeps hitting a flat support level but makes lower highs. When it breaks below support, the downtrend continues.
Head and Shoulders
This pattern signals a trend reversal. It looks like three peaks — a small one, a big one, and another small one. When complete, the trend often reverses direction. Watch for it at the end of long trends.
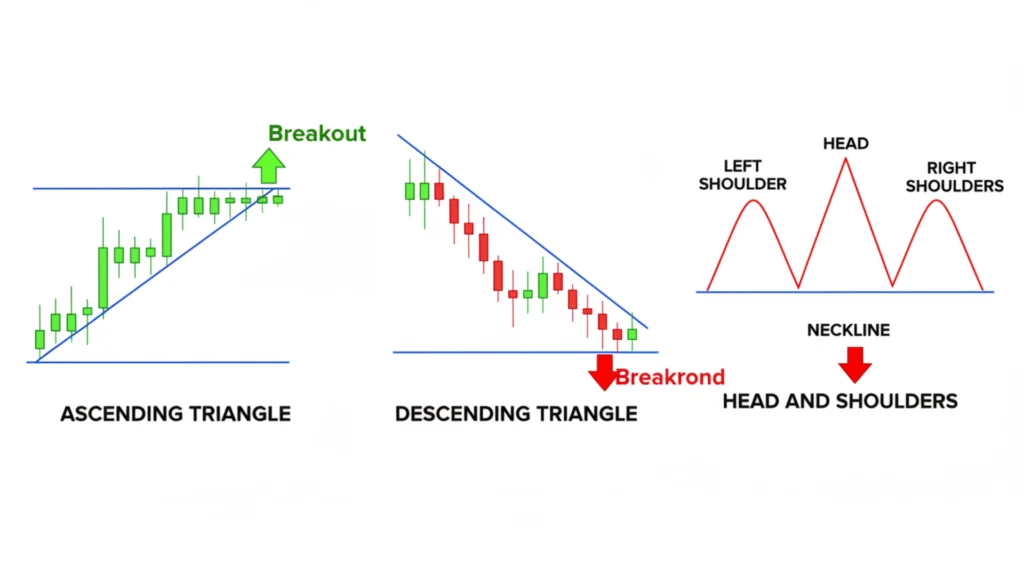
Step-by-Step Guide to Start Forex Trend Trading
Here is how to do your first forex trend trading step by step.
- Choose a currency pair — Start with EUR/USD or GBP/USD. They are the most popular.
- Open a chart — Use MT4 or MT5. Set your timeframe.
- Identify the trend — Is price going up, down, or sideways?
- Use indicators — Add moving averages and ADX to confirm.
- Confirm entry — Wait for a pullback or breakout signal.
- Place trade — Set stop loss and take profit before entering.
When to Enter a Trade (Simple Rules)
Knowing the forex trend entry and exit strategy is very important.
- Enter in direction of trend — Never fight the trend. Always trade with it.
- Wait for confirmation — Do not jump in too early. Wait for a clear signal.
- Avoid late entries — If you missed the beginning of the move, wait for the next setup. Entering too late means more risk and less reward.
When to Exit a Trade
Exiting correctly is just as important as entering at the right time.
- Take profit: Set a clear target before you enter. When price reaches it, close the trade.
- Stop loss: Always use a stop loss. It protects your money if the trade goes wrong.
- Trailing stop: As the trade moves in your favor, move your stop loss up. This locks in profits and keeps you in the trade longer.
Best Timeframes for Trend Trading
Multi timeframe trend analysis forex helps you see the full picture.
- Short timeframe (fast trades): 15-minute or 1-hour charts. Good for forex trend scalping strategy and quick trades.
- Medium timeframe (balanced): 4-hour charts. Great for swing trading forex trends.
- Long timeframe (safer for beginners): Daily or weekly charts. Better for long term trend trading forex. Less noise, clearer trends.
Real-Life Example of Forex Trend Trading
Let’s say you open your EUR/USD chart on a Monday morning. You notice price has been going up for the last two weeks. The 50-day moving average is pointing up. ADX shows 30 — that means a strong trend.
You wait for a small pullback to the moving average. Price dips and then bounces back up. You buy at 1.0850. You set your stop loss at 1.0800 and your take profit at 1.0950.
Three days later, price hits your take profit. You made 100 pips profit. That is forex trend trading in action — simple, patient, and profitable.
Trends vs Ranges (Important Difference)
Not all markets are trending. Sometimes they just move sideways. This is called a ranging market.
What is a ranging market? Price bounces between two levels without breaking out. It goes up, comes back, goes up again, comes back — no progress in either direction.
When NOT to trend trade: Do not use a forex trend strategy in a ranging market. Your signals will be false and you will lose money. Wait for a clear breakout before entering.
Economic Trends and Currency Movement
Big events in the economy affect how currencies move. Understanding this helps with trend analysis forex.
How news affects trends: A positive jobs report can push a currency up. A poor GDP number can push it down. These moves often start new trends.
Interest rates and inflation: When a country raises interest rates, its currency usually gets stronger. When inflation rises too much, the currency may weaken. These are the forces behind long-term forex trend following system trades.
Risk Management in Forex Trend Trading
No matter how good your strategy is, you must protect your money. This is the most important part of forex trend trading.
- Never risk too much: Only risk 1% to 2% of your account on one trade.
- Use stop loss: Always. No exceptions.
- Risk-reward ratio: Try to make at least 2x what you risk. Risk 50 pips, aim for 100 pips.
- Protect your account: A good account grows slowly. A bad one is blown quickly.
Common Mistakes in Trend Trading
Even simple strategies go wrong when traders make these mistakes.
- Trading without a trend: Never trade in a flat, sideways market with a trend strategy.
- Ignoring risk: Skipping stop losses is the fastest way to lose your money.
- Emotional trading: Making decisions based on fear or excitement is dangerous.
- Entering too late: Jumping in at the end of a trend means you catch the reversal — not the profit.
Trading Psychology (Simple Explanation)
Your mindset is just as important as your strategy in forex trend trading.
Fear and greed: Fear makes you exit too early. Greed makes you stay too long. Both destroy profits. Stay balanced.
Patience in trading: Good setups take time to form. Do not rush. Wait for the right moment.
Discipline: Follow your plan every single time. Do not change rules in the middle of a trade.
Trend Trading vs Other Trading Styles
Trend Trading vs Day Trading
In Day Trading Day traders open and close trades in one day. Trend traders hold for days or weeks. Trend trading is less stressful and needs less screen time.
Trend Trading vs Scalping
Scalping means taking many tiny trades every day. Forex trend scalping strategy needs very fast reactions. Trend trading is slower and calmer. It is much easier for beginners.
Which One is Better for Beginners?
Trend trading wins for beginners. It gives you time to think, plan, and act without panic. Start with trend trading before trying faster styles.
Best Tools & Platforms for Forex Trend Trading
- Trading platforms: MT4 and MT5 are the most popular. They are free and packed with tools.
- Charts and indicators: All the indicators mentioned in this guide are available on these platforms.
- Demo accounts: Most brokers offer free demo accounts where you trade with fake money. Use it to practice.
How to Practice Without Losing Money
You do not need to risk real money to learn forex trend trading.
- Demo trading: Trade with virtual money on a real platform. Same charts, same tools — zero risk.
- Backtesting: Look at old charts and test your strategy. See how it would have performed in the past.
- Learning slowly: Take your time. Spend weeks on demo before risking real money.
How Much Money Do You Need to Start?
You do not need a lot to begin.
- Small accounts: Some brokers let you start with as little as $10 to $100.
- Large accounts: More money means more flexibility, but also more risk.
- Risk per trade: Always keep it at 1% to 2% of your account. That way, even 10 losses in a row will not wipe you out.
Daily Routine of a Trend Trader
A good routine keeps you consistent and focused.
- Check charts every morning to see what happened overnight.
- Analyze trend — Is it still going in the same direction?
- Place trades if a good setup appears. If not, wait.
- Review performance at the end of the day. Learn from every trade.
Simple Trend Trading Checklist
Before every trade, ask yourself these questions:
- ✅ Is there a clear trend?
- ✅ Did I confirm it with indicators?
- ✅ Is my risk controlled with a stop loss?
- ✅ Am I following my trading plan?
If all four answers are yes — go ahead and trade!
FAQs About Forex Trend Trading
What is the Best Strategy?
The best trend trading strategy forex is the one you understand and follow consistently. For beginners, trend following with moving averages is the most reliable.
Is Trend Trading Profitable?
Yes, but only with discipline and proper risk management. Many professional traders make their living with forex trend trading.
Can Beginners Do Forex Trading?
Absolutely. Forex trend trading tips for beginners always say the same thing — start on a demo account, learn slowly, and keep risk low.
What Timeframe is Best?
The daily chart is best for beginners. It is clear, simple, and not too noisy. As you get better, you can try the 4-hour chart for swing trading forex trends.
Final Tips for Success in Forex Trend Trading
Here are your four golden rules for forex trend trading success:
- Follow the trend — Always trade with it, never against it.
- Stay patient — Wait for clear setups. Do not force trades.
- Keep learning — Markets change. Always study and improve.
- Manage risk — Protect your account first. Profits follow discipline.
Forex trend trading is not about being perfect. It is about being consistent. Small, steady wins build big accounts over time. Start simple, stay patient, and trust the process.