
Forex Scalping Strategy: Top Tips, Tools & Techniques
Forex scalping is one of the fastest ways to trade in the currency market. Scalpers open and close trades within seconds or minutes. They aim to grab small profits many times a day. If you love fast trading and quick decisions, a forex scalping strategy might be perfect for you.
What Is a Forex Scalping Strategy?
Simple Explanation of Scalping
Scalping means making very fast trades. You buy or sell a currency pair and close the trade in just a few seconds or minutes. You don’t hold trades for hours or days. Think of it like picking up coins off the floor very quickly, one after another.
How Scalping Works in Forex Trading
In forex scalping, traders use short timeframes like 1-minute or 5-minute charts. They look for small price movements and try to profit from them. Each trade may earn only 3 to 10 pips. But when you take many trades per day, those small profits add up.
Why Traders Choose Forex Scalping Strategy
Many traders love scalping because results come fast. You don’t have to wait days to see if a trade works. It also reduces overnight risk because you close all trades before the day ends. It suits people who can focus well and act quickly.
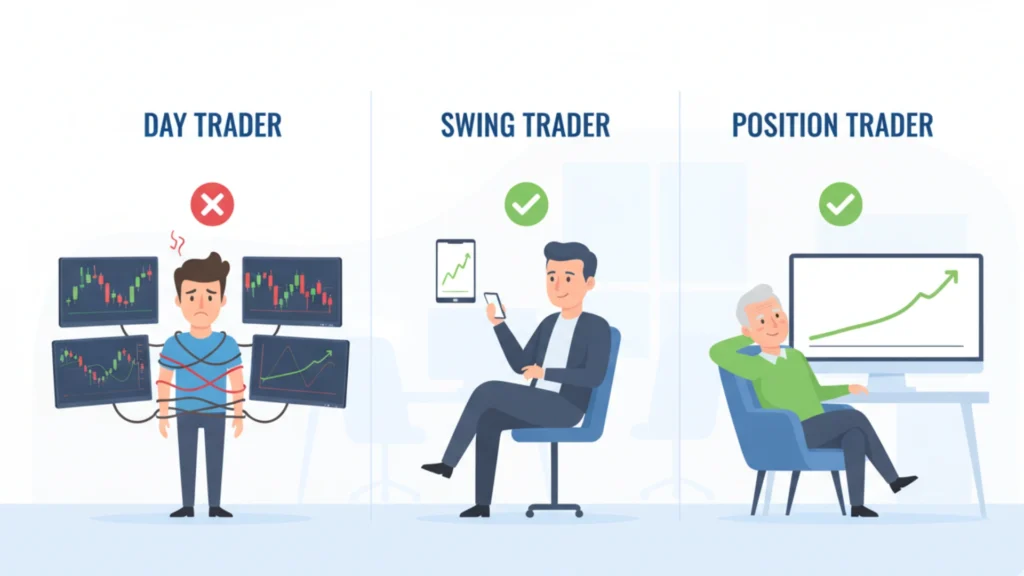
Scalping vs Day Trading vs Swing Trading
Scalping is faster than day trading and much faster than swing trading. Day traders hold trades for a few hours. Swing traders hold for days or weeks. Scalpers hold for seconds to minutes. Each style has its own risks and rewards, but fast forex trading strategies like scalping need more attention and discipline.

Key Features of Forex Scalping Strategy
Very Short Trading Timeframes
Scalpers mostly use 1-minute and 5-minute charts. Some use even tick charts. The goal is to catch tiny price moves before they reverse. Short timeframes mean more trading opportunities throughout the day.
Small Profits Per Trade
Each trade targets just a few pips. A scalper might aim for 3 to 10 pips per trade. This seems small, but with good volume and frequency, it builds into solid daily profits.
High Trading Frequency
A scalper might take 10 to 50 trades in a single day. This is called a high frequency forex trading strategy. More trades mean more chances to profit, but also more chances to lose if you’re not careful.
Importance of Speed and Execution
Speed is everything in scalping. A slow broker or a slow internet connection can ruin your trade. You need fast order execution and tight spreads. Even a one-second delay can turn a winning trade into a losing one.
Best Timeframes for Forex Scalping
1-Minute Forex Scalping Strategy
The 1 minute forex scalping strategy is the most popular. Traders use it to catch very short price spikes. It works best during high-volume sessions. You need sharp focus because prices move very fast.
5-Minute Forex Scalping Strategy
The 5 minute forex scalping method is slightly slower but gives cleaner signals. It’s a great choice for beginners who find 1-minute charts too stressful. There’s a little more time to think before entering.
15-Minute Forex Scalping Strategy
The 15-minute chart gives even more stable signals. It’s used by traders who want fewer but higher-quality trades. It’s part of a solid intraday forex scalping system for those who prefer less screen time.
Multi-Timeframe Analysis for Scalpers
Smart scalpers check higher timeframes first. For example, check the 15-minute chart for the trend, then use the 1-minute chart for entry. This is called multi-timeframe analysis and it improves accuracy a lot.
Best Currency Pairs for Forex Scalping Strategy
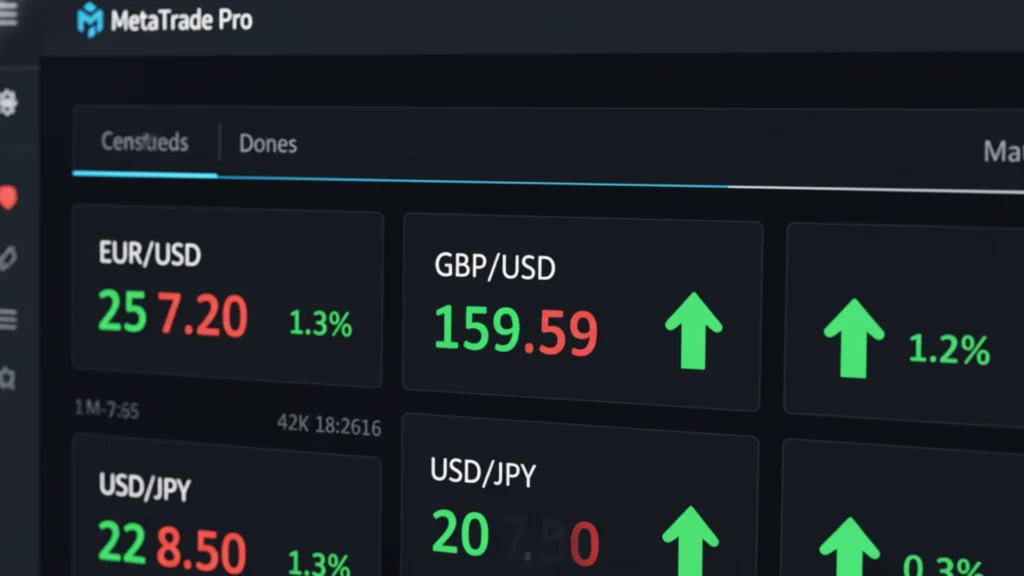
EUR/USD
The EUR/USD forex scalping strategy is very popular. This pair has the tightest spreads and highest liquidity. It moves smoothly and offers great scalping conditions throughout the day.
GBP/USD
GBP/USD is more volatile. It moves more pips per candle, which means bigger profit chances but also bigger risk. Experienced scalpers love it.
USD/JPY
USD/JPY is another great high liquidity forex pair for scalping. It’s stable during the Asian session and picks up speed during New York hours. Spreads are usually very tight.
Why Major Pairs Are Better for Forex Scalping Strategy
Major pairs have high volume and tight spreads. These are the low spread forex pairs for scalping. Exotic pairs have wide spreads which eat into your small profits. Always stick to majors for the best results.
Best Forex Scalping Indicators
Moving Averages
The moving average forex scalping strategy uses two or more moving averages. When the fast MA crosses above the slow MA, it signals a buy. When it crosses below, it signals a sell. Simple and effective.
Bollinger Bands
Bollinger Bands forex scalping strategy helps traders find price breakouts and reversals. When price touches the lower band, it may bounce up. When it hits the upper band, it may pull back. Great for range-bound markets.
RSI (Relative Strength Index)
The RSI scalping strategy forex uses the RSI indicator to find overbought and oversold conditions. RSI above 70 means overbought. Below 30 means oversold. Scalpers use these signals to enter trades quickly.
Stochastic Oscillator
Stochastic is similar to RSI but reacts faster. It’s one of the best forex scalping indicators for spotting quick reversals, especially in sideways markets.
Parabolic SAR
Parabolic SAR places dots above or below candles to show trend direction. When dots flip from above to below, it signals a buy. It’s great for price action forex scalping strategy setups.
7 Best Forex Scalping Strategies
Moving Average Scalping Strategy
Use a 9 EMA and 21 EMA on a 1-minute or 5-minute chart. Enter when they cross. Exit when they cross back or after a target of 5 pips. Clean and beginner-friendly.
Bollinger Band Forex Scalping Strategy
Wait for price to squeeze inside the bands. When price breaks out with strong momentum, enter the trade. Target the middle band as profit exit. This is a top best forex scalping strategy for beginners.
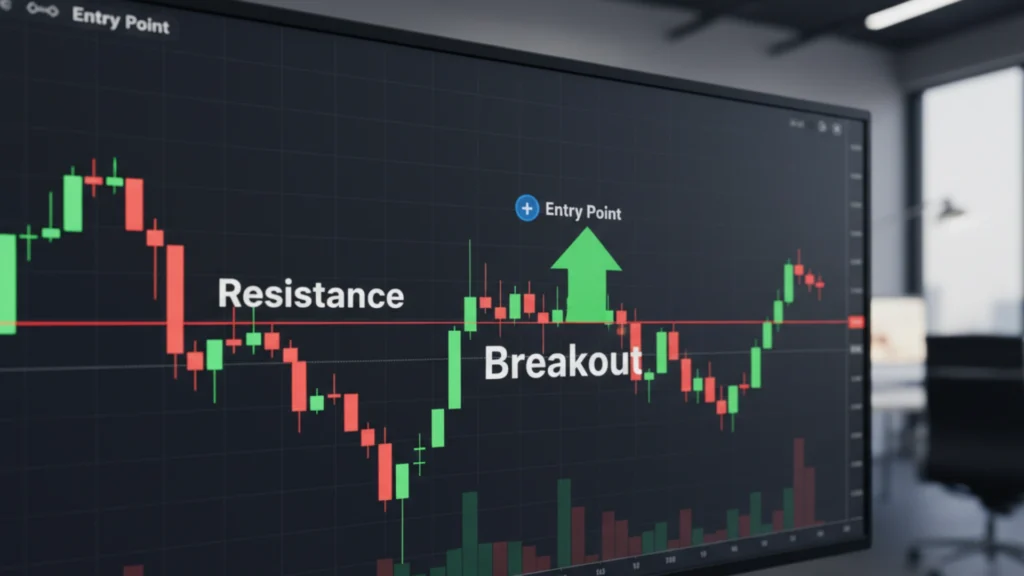
Breakout Scalping Strategy
Identify a tight consolidation zone. Place a buy order above resistance and a sell order below support. When price breaks out, catch the move fast. Use tight stop losses.
Range Forex Scalping Strategy
When the market is moving sideways, buy at support and sell at resistance. Repeat this process multiple times. Works well in low-volatility conditions.
Momentum Forex Scalping Strategy
Look for strong candles with volume. Enter in the direction of momentum. Use MACD scalping technique to confirm momentum direction. Exit quickly when momentum slows.
Support and Resistance Scalping
Mark key support and resistance levels. When price bounces from these zones with confirmation, enter a short-term trade. It’s a classic part of any professional forex scalping system.
Price Action Forex Scalping Strategy
No indicators needed. Just read the candles. Pin bars, engulfing candles, and doji patterns near key levels give powerful entry signals. This is the purest form of price action scalping strategy forex.
The 1-Minute Forex Scalping Strategy (Step-by-Step)
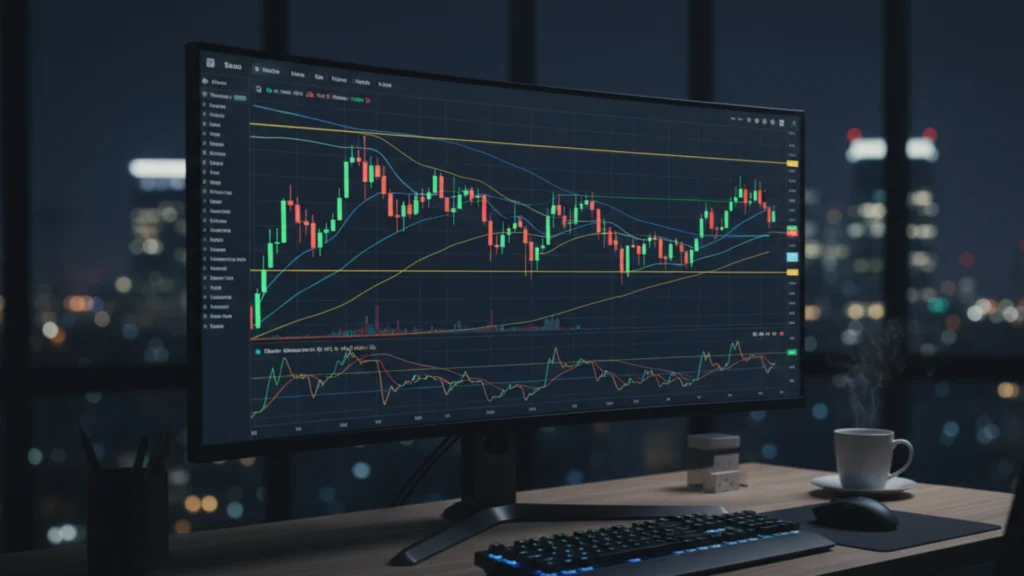
Setup and Indicators
Use the 1-minute chart. Add 50 EMA, RSI (14), and Bollinger Bands. These three tools work together to give clear entry and exit signals.
Buy Entry Rules
Price must be above the 50 EMA. RSI should be above 50. Price touches the lower Bollinger Band and bounces. Enter a buy trade immediately.
Sell Entry Rules
Price must be below the 50 EMA. RSI should be below 50. Price touches the upper Bollinger Band and drops. Enter a sell trade.
Stop Loss Placement
Place your stop loss 3 to 5 pips below the entry candle for buys. For sells, place it 3 to 5 pips above. Keep it tight. This is key in risk management for scalping.
Take Profit Forex Scalping Strategy
Target 5 to 8 pips per trade. You can also use the middle Bollinger Band as your take profit zone. Don’t be greedy. Small and consistent is the scalper’s way.
Step-by-Step Guide to Start Forex Scalping
Choose a Reliable Forex Broker
Pick a broker with tight spreads, fast execution, and no dealing desk. ECN or STP brokers are best for scalping. Check reviews before depositing money.
Select the Right Trading Platform
MetaTrader 4 or MetaTrader 5 are the most popular platforms. They’re fast, reliable, and support all forex scalping indicators you’ll need.
Choose Currency Pairs
Start with EUR/USD. It’s the safest pair for beginners. Once confident, you can add GBP/USD or gold scalping strategy forex pairs like XAU/USD.
Set Up Indicators
Add your indicators one by one. Don’t clutter your chart. Two or three indicators are enough. Clean charts lead to better decisions.
Start Trading on a Demo Account
Always practice first. Use a demo account for at least 2 to 4 weeks. Test your forex scalping trading plan without risking real money.
Risk Management for Scalping
How Much Risk Per Trade
Never risk more than 1% of your account per trade. If you have $1000, risk only $10 per trade. This protects you from blowing your account.
Stop Loss Rules
Always use a stop loss. No exceptions. In advanced forex scalping techniques, even professional traders use stop losses on every single trade.
Lot Size Management
Use small lot sizes. Micro lots are great for beginners. As your account grows, you can increase lot size slowly and carefully.
Maximum Trades Per Day
Set a daily trade limit. For beginners, 5 to 10 trades per day is enough. More trades don’t always mean more profit. Quality over quantity always wins.
Best Time to Trade Forex for Scalping
London Session
The London session opens at 8 AM GMT. It’s the most active session. Spreads are tight and price moves fast. Perfect for scalping strategy for volatile forex markets.
New York Session
The New York session opens at 1 PM GMT. It brings massive volume, especially for USD pairs. Great opportunities arise during economic news releases.
Overlap Trading Sessions
The London-New York overlap (1 PM to 5 PM GMT) is the golden window. Volume is at its highest. This is the best time to apply any short term forex trading strategy.
Avoiding Low Liquidity Periods
Avoid trading during the Asian session if you scalp EUR/USD. Also avoid trading just before and after major news events unless you’re experienced. Low liquidity means wide spreads and choppy price action.
Common Forex Scalping Mistakes
Overtrading
Taking too many trades is a top mistake. It leads to mental fatigue and poor decisions. Stick to your plan and stop when your daily target is hit.
Ignoring Spreads
A 3-pip spread can kill a 5-pip profit target. Always choose pairs and brokers with the lowest spreads when using a forex scalping strategy.
Trading During Low Liquidity
Thin markets move unpredictably. Avoid trading at market open, midnight hours, or during holidays.
No Stop Loss
Trading without a stop loss is gambling, not trading. One bad trade can wipe out 10 good ones.
Emotional Trading
Fear and greed are your biggest enemies. Follow your forex scalping entry and exit rules strictly. Don’t change your plan mid-trade.
Forex Scalping Example (Real Trade Setup)
Market Setup
EUR/USD on a 1-minute chart. Price is above the 50 EMA. RSI is at 55. Bollinger Bands are slightly expanding, showing building momentum.
Entry Signal
Price pulls back to the middle Bollinger Band and forms a bullish engulfing candle. RSI stays above 50. This is a high probability scalping setup. Enter a buy at market price.
Stop Loss Placement
Stop loss goes 4 pips below the entry candle’s low. This keeps the risk tight and controlled.
Profit Target
Target is 7 pips above entry. That hits the upper Bollinger Band. Once reached, close the trade and move on to the next setup.
Tools and Platforms for Forex Scalping
MetaTrader 4 / MetaTrader 5
MT4 and MT5 are the world’s most used trading platforms. They support custom indicators, expert advisors (EAs), and automated forex scalping bots. Fast and reliable.
TradingView
TradingView offers beautiful charts and a huge library of indicators. Great for analysis. You can also paper trade on it for free.
cTrader
cTrader is built for speed. It’s preferred by ECN traders and is excellent for manual forex scalping strategy execution. Fast order filling is its biggest advantage.
VPS for Fast Execution
A Virtual Private Server (VPS) keeps your trading platform running 24/7. It reduces latency and improves execution speed. Every serious scalper should use one.
Daily Routine of a Successful Scalper
Pre-Market Preparation
Check economic news for the day. Mark key support and resistance levels. Review your trading plan and set your daily profit and loss limits.
Finding Trading Opportunities
Watch the market during peak sessions. Wait for your setup to appear. Don’t force trades. Patience is a big part of professional forex scalping.
Managing Active Trades
Once in a trade, follow your rules. Don’t move your stop loss further away. Let the trade hit its target or stop out.
Reviewing Trades
At the end of the day, review every trade. What worked? What didn’t? A trade journal is one of the best tools any scalper can use for growth.
Pros and Cons of Forex Scalping
Advantages
Scalping gives fast results. You can make multiple small profits daily. It reduces overnight market risk. It suits traders who love action and quick thinking. It also builds strong discipline and chart-reading skills.
Disadvantages
It requires intense focus for hours. Transaction costs from spreads add up quickly. It’s stressful and not suitable for everyone. Beginners may lose money fast without proper practice and a solid forex scalping trading plan.
Is Forex Scalping Profitable?
Factors That Affect Profitability
Your broker’s spread, your strategy’s win rate, your risk management, and your trading session all affect profitability. A quick profit forex trading method only works when all these pieces are in place.
Skills Needed for Successful Scalping
You need fast decision-making, strong discipline, and chart-reading ability. You must control emotions and follow rules consistently. With practice, scalping can be very profitable.
Frequently Asked Questions (FAQs)
What is the best forex scalping strategy?
The best forex scalping strategy depends on your style. For beginners, the Moving Average or Bollinger Band strategy works great. For advanced traders, price action scalping gives the cleanest results.
Is scalping good for beginners?
Yes, but start on a demo account first. The best forex scalping strategy for beginners is a simple one with 2 indicators maximum. Keep it simple until you’re confident.
How many trades do scalpers take per day?
Most scalpers take between 10 and 50 trades per day. Beginners should start with 5 to 10 trades. Quality setups matter more than quantity.
How many pips do scalpers target?
Scalpers usually target 3 to 10 pips per trade. Some aggressive traders go for 15 pips. The key is keeping the reward bigger than the risk.
Can you make a living from scalping?
Yes, many professional traders earn a living from scalping. It requires months of practice, strong risk management, and a tested forex scalping strategy. It’s not a get-rich-quick method, but with dedication, it absolutely works.
CISD Trading: Complete Guide for Beginners
Introduction to CISD Trading
If you’ve been exploring smart money concepts or ICT methodology, you’ve probably heard about cisd trading. It’s one of the most powerful ideas in modern price action trading. But many traders still don’t fully understand what it means or how to use it properly.
This guide will walk you through everything — from the basics to advanced techniques. Whether you’re new or experienced, you’ll find real value here.
What You Will Learn in This Guide
By the end of this article, you’ll know what cisd trading is, why it happens, how to spot it on a chart, and how to build a trading strategy around it. You’ll also learn how it fits with other ICT tools like order blocks and fair value gaps.
Why CISD Trading is Popular Among ICT Traders
CISD trading has grown in popularity because it gives traders a clear signal that the market is switching direction. It helps you stop guessing and start reading price movement with more confidence. Traders love it because it’s clean, logical, and based on real market mechanics.
Who Should Use CISD Trading Strategy
This guide is perfect for anyone learning ICT concepts, price action traders, forex traders, and crypto traders who want to understand how institutional money moves markets.
What is CISD in Trading?
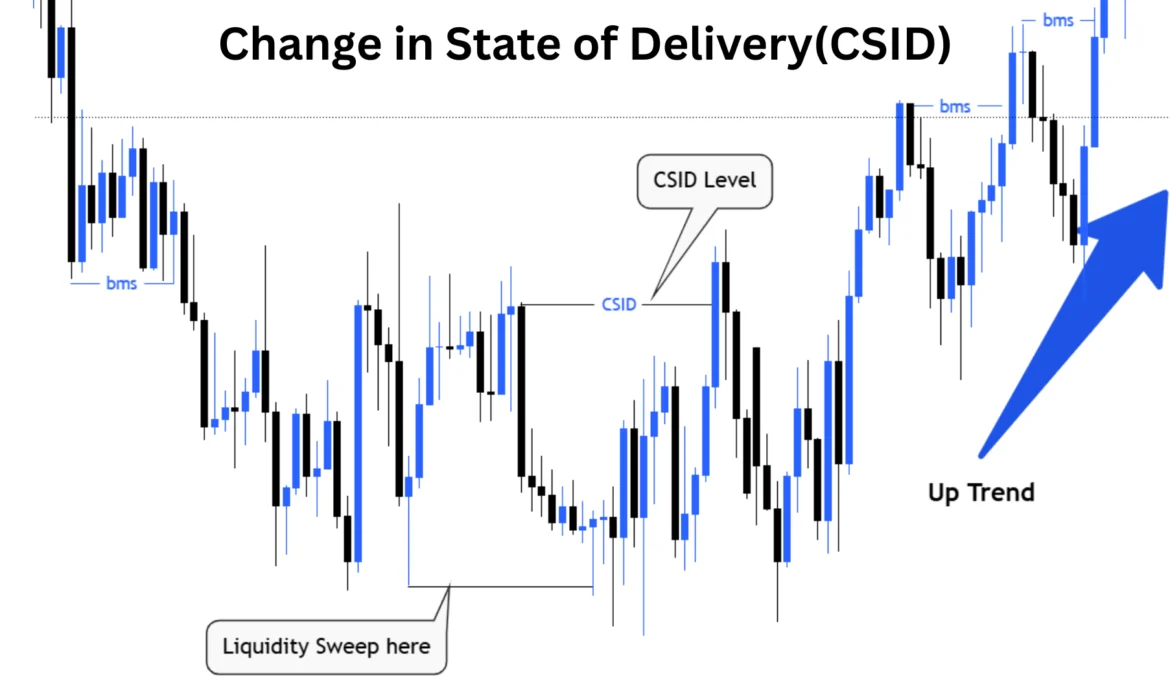
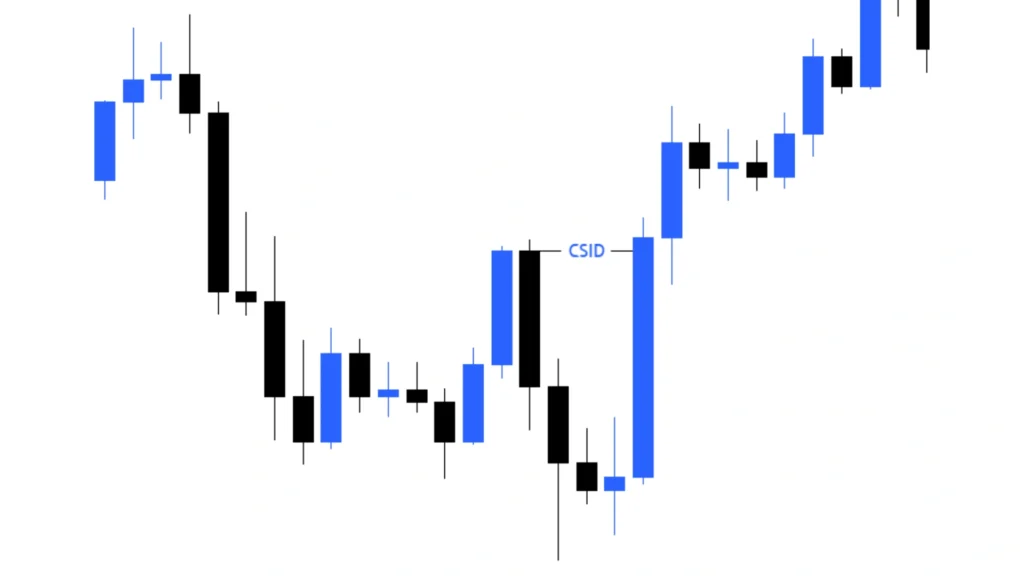
What is Change in State of Delivery (CISD)?
CISD stands for Change in State of Delivery. In simple words, it means the market has shifted from delivering price in one direction to delivering it in the opposite direction. Think of it like a truck that was moving north suddenly turning around and heading south.
What is ICT Change in the State of Delivery?
In ICT (Inner Circle Trader) methodology, a change in state of delivery happens when the market transitions from a bullish delivery (price going up) to a bearish delivery (price going down), or vice versa. This shift tells us that the big players — institutions and banks — have changed their intention.
Features of CISD
CISD is clean and visible on the chart. It happens after a liquidity sweep. It signals a real shift in who controls the market — buyers or sellers. It works across multiple timeframes and markets.
Technical Meaning of Delivery Shift in Markets
Technically, CISD is confirmed when a candle or series of candles closes beyond a previous swing point in the opposite direction after a liquidity grab. This confirms that the old delivery state is over and a new one has begun.
Who Created the CISD Concept?
Background of ICT Methodology
ICT methodology was developed to help retail traders understand how banks and institutions move the market. It includes concepts like order blocks, fair value gaps, liquidity pools, and of course, CISD trading.
Role of Michael Huddleston in Developing CISD
Michael Huddleston, known online as The Inner Circle Trader (ICT), is the creator of this concept. He built it as part of his larger smart money framework to help traders identify when the market is genuinely shifting direction — not just retracing.
Why CISD Happens in the Market
Buyer vs Seller Control Shift
CISD happens when the balance of power in the market flips. When buyers are in control, price moves up. When sellers take over, price moves down. CISD marks the exact point of that power shift.
Liquidity and Order Flow Explanation
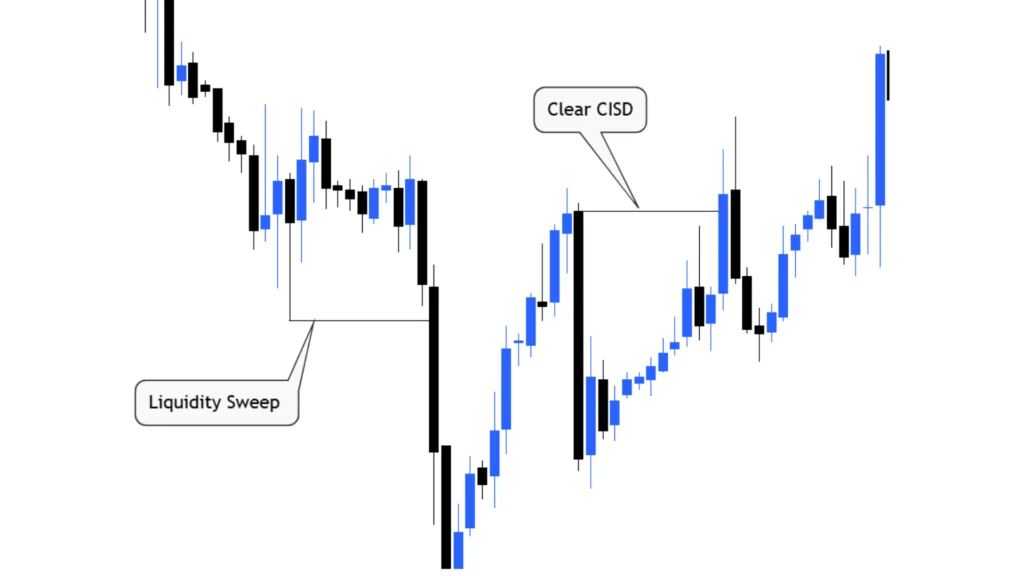
Before a CISD forms, institutions usually sweep liquidity — they push price into an area where retail traders have placed their stop losses. After collecting that liquidity, the institutions reverse price. This reversal is the beginning of the CISD.
Market Psychology Behind CISD
Retail traders often get trapped on the wrong side of the market. They enter a trade, price moves against them, they get stopped out — and then price goes in the direction they originally thought. CISD helps you see this trap before it catches you.

Market Structure Basics You Must Understand First
What is Market Structure?
Market structure is the pattern of highs and lows on a price chart. An uptrend makes higher highs and higher lows. A downtrend makes lower lows and lower highs. Understanding this is essential for cisd trading strategy.
What is Market Structure Shift (MSS)?
A Market Structure Shift (MSS) happens when price breaks a significant swing point, signaling that the trend may be changing. For example, in an uptrend, if price breaks a recent higher low, that’s an MSS.
What is Change of Character (CHoCH)?
CHoCH is another concept that marks early signs of a trend change. It’s a subtle shift — not as strong as MSS. Think of CHoCH as the first hint and MSS as the confirmation.
Difference Between MSS, CHoCH, and CISD
CHoCH is the first sign of weakness. MSS is the structural break. CISD is the confirmation that price has fully switched its delivery direction. They are related but different in timing and strength.
How to Identify CISD on the Chart
Key Signs of CISD Formation
Look for a liquidity sweep followed by strong opposite-direction candles. There should be a clear break of a previous swing high or low. Volume should increase at the CISD point.
What to Look for Before CISD Appears
Before a CISD forms, price usually runs into a liquidity pool — an area with clustered stop losses. Once that sweep happens, watch for the reversal.
Liquidity Sweep Detection Method
A liquidity sweep looks like a wick or spike beyond a previous high or low, followed by a fast rejection. That rejection is your first clue that a CISD might be forming.
Bullish CISD
How to Identify a Bullish CISD
A bullish CISD forms when price sweeps below a low (taking out sell-side liquidity), then aggressively returns upward and breaks above a recent swing high. This tells us that buyers have taken control.
Conditions for Valid Bullish Setup
Price must sweep liquidity first. The reversal candles must be strong and decisive. The CISD point should align with a key support zone or order block.
Bearish CISD
How to Identify a Bearish CISD
A bearish CISD forms when price sweeps above a high (taking out buy-side liquidity), then drops sharply and breaks below a recent swing low. This tells us sellers are now in control.
Conditions for Valid Bearish Setup
The sweep must happen at or near a premium zone. Reversal candles should close strongly. Confirmation from a higher timeframe adds more validity.
Key Levels to Watch When Identifying CISD
Liquidity Pools
These are areas where lots of stop losses sit — above old highs or below old lows. Institutions target these first before reversing price.
Order Blocks
An order block is a zone where institutional orders were placed. When price returns to these zones after a CISD, it often continues the new direction.
Premium and Discount Zones
Premium zones are in the upper half of a price range — good for selling. Discount zones are in the lower half — good for buying. CISD setups are stronger when they form in these zones.
Support and Resistance
Classic support and resistance levels add extra weight to a CISD signal. When a CISD forms at a well-known resistance or support level, it’s a high-probability setup.
CISD vs Other ICT Concepts
ICT CISD vs ICT MSS
MSS tells you the structure has broken. CISD tells you the market has switched how it’s delivering price. CISD is a deeper confirmation.
CISD vs CHoCH
CHoCH is early and subtle. CISD is later and more confirmed. For cisd trading, you want to wait for the CISD rather than acting too early on CHoCH.
MSS vs CISD
MSS happens first. CISD follows. Both are important, but CISD gives a stronger signal for entry.
Difference in Price Basis Between MSS and CISD
MSS focuses on the break of a swing point. CISD focuses on a full delivery shift — meaning multiple candles confirming the new direction.
Order of Occurrence Between MSS and CISD
First comes the liquidity sweep → then CHoCH → then MSS → then CISD. Each step confirms the next.
Multi-Timeframe CISD Trading
Importance of Higher Timeframe Bias
Before trading any CISD, always check the higher timeframe. If the daily chart is bullish, only take bullish CISD setups on lower timeframes.
Multi-Timeframe Analysis Strategy
Use the weekly and daily charts for bias. Use the 4-hour or 1-hour for structure. Use the 15-minute or 5-minute for entry refinement. This is the core of cisd trading strategy across timeframes.
Employing Multiple Timeframes for Accuracy
Combining timeframes reduces false signals. A CISD on the 15-minute chart that aligns with the daily bias is a high-quality trade setup.
In-Depth Multi-Timeframe CISD Trading Examples
Imagine the daily chart is bearish. On the 1-hour chart, price sweeps a high and forms a bearish CISD. On the 5-minute chart, you wait for a small retracement and enter short. All timeframes agree — that’s a powerful cisd trading opportunity.
Step-by-Step CISD Trading Strategy for Beginners
This is your beginner’s guide to cisd trading, broken into simple steps.
Step 1 — Analyze Higher Timeframe: Determine the overall trend and bias using the daily or 4-hour chart.
Step 2 — Identify Liquidity Sweep: Look for price spiking into a liquidity pool and then rejecting sharply.
Step 3 — Confirm CISD Point: Wait for price to break a swing point in the new direction after the sweep.
Step 4 — Entry Strategy: Enter at the CISD candle’s close or wait for a retracement to an order block.
Step 5 — Stop-Loss Placement: Place your stop beyond the liquidity sweep point or the CISD candle’s high/low.
Step 6 — Take-Profit Planning: Target the next liquidity pool, order block, or major swing point.
CISD Entry Models
Aggressive Entry
Enter right at the CISD confirmation candle. This gets you in early but carries more risk. Best for experienced traders who are confident in the setup.
Conservative Entry
Wait for price to return to the CISD point or nearby order block before entering. This reduces risk but may mean missing some moves.
Confirmation Entry
Wait for a smaller timeframe CISD within the larger setup. This triple-layer confirmation gives the highest probability.
How to Trade CISD (Complete Strategy)
How to Trade with Change in State of Delivery
Use the cisd trading tools to find the delivery shift, then align your entry with the new direction. Always wait for the market to prove itself before entering.
Using CISD to Define Daily Bias
Start each trading day by identifying whether price is in a bullish or bearish CISD state on the higher timeframe. This sets your bias for the day.
Market Timing with CISD
CISD works best during active sessions — especially London and New York opens. These are times when institutions are most active and real delivery shifts occur.
Combining CISD with Other ICT Tools
CISD with Order Blocks
When a CISD forms at or near an order block, the setup is much stronger. The order block acts as a launching pad for the new delivery direction.
CISD with Fair Value Gaps (FVG)
After a CISD, price often leaves behind a fair value gap (FVG). Price frequently retraces into that FVG before continuing. This gives you a clean entry point.
CISD with Inverted Fair Value Gap (IFVG)
An IFVG flips its role after a CISD. What was once resistance becomes support, and vice versa. This adds extra precision to your entries.
Validity of MSS and CISD in PD Array Zones
PD array zones — including order blocks, FVGs, and breaker blocks — add significant weight to any CISD signal that forms within them.
Trade Examples
CISD Long Trade Example
Example of CISD in Buy Trades
Price is on the 1-hour chart in a downtrend. It sweeps a key low, taking out stop losses. Then a strong bullish candle forms, closing above the recent swing high. That’s a bullish CISD.
Candle-by-Candle Explanation
Candle 1 sweeps the low. Candle 2 is a small recovery. Candle 3 closes above the swing high — this is the CISD confirmation. Enter on candle 4.
CISD Short Trade Example
CISD in Sell Trades
Price is in an uptrend on the 15-minute chart. It spikes above a key high, grabbing buy-side liquidity. Then price aggressively falls and breaks below the recent swing low. That’s a bearish CISD.
Trade Breakdown
Stop goes above the sweep high. Target is the next major support zone. Risk-to-reward is 3:1 or better.
Trade Example with MSS, CISD, and IFVG
Price first shows CHoCH, then MSS, then CISD. After the CISD, price retraces into an IFVG zone. Enter short at the IFVG with stop above the CISD point. Clean, structured, high-probability cisd trading setup.
Best Timeframes for CISD Trading
Scalping Timeframes
For scalping, use the 1-minute and 5-minute charts. Look for CISD on the 15-minute for direction, then scalp entries on the lower timeframes.
Day Trading Timeframes
The 15-minute and 1-hour charts are ideal for day trading CISD. These give you clear structure without too much noise.
Swing Trading Timeframes
For swing trades, use the 4-hour and daily charts. CISD signals here tend to last several days and offer larger profit potential.
Best Market Conditions for CISD
Trending Markets
CISD works best in trending markets where a clear direction is in place and then suddenly shifts. Ranging markets reduce signal quality.
Session Timing (London / New York)
London open (2 AM–5 AM EST) and New York open (8 AM–11 AM EST) are the best times. These are when institutions are actively placing and moving orders.
High Liquidity Periods
CISD signals are most reliable during high-volume periods. Low volume = slow price action = unreliable signals.
When NOT to Trade CISD
Choppy Markets
If price is moving sideways without clear structure, skip it. You’ll just get whipsawed back and forth with no clean CISD forming.
News Events
Major news events like NFP, CPI, or Fed announcements can create fake CISD signals. Avoid trading right before or during these events.
Low Volume Sessions
The Asian session is usually very quiet. CISD setups here often fail or don’t follow through. Stick to London and New York.
Risk Management for CISD Trading
Risk Per Trade Rules
Never risk more than 1-2% of your account on any single cisd trading setup. This protects you from losing streaks.
Stop-Loss Logic
Your stop should always go beyond the liquidity sweep — the extreme point where price grabbed liquidity before reversing. This is a logical invalidation level.
Position Sizing
Calculate your position size based on the distance between your entry and stop-loss. Use a fixed percentage of account balance, not a fixed dollar amount.
Risk-to-Reward Ratios
Aim for a minimum 2:1 risk-to-reward. Many cisd trading setups naturally offer 3:1 or better when traded correctly.
CISD Indicator Guide
What is CISD Trading Indicator?
The CISD indicator is a tool that automatically identifies change in state of delivery points on your chart. It marks the candle or zone where the shift occurred.
Indicator of CISD Trading
This indicator draws a line or zone at the CISD confirmation point, making it easier to spot setups at a glance without manual analysis.
Effective Configuration of CISD Trading Indicator
Set the indicator to match your trading timeframe. Use it on the 15-minute or 1-hour chart for best results. Don’t over-clutter your chart with too many settings.
How to Trade Using CISD Trading Indicator
Wait for the indicator to mark a CISD zone. Confirm it aligns with your higher timeframe bias. Then look for entry using FVG or order block within that zone.
How to Filter CISD Trading Signals Effectively
Avoiding False Signals
Not every candle that breaks a swing point is a CISD. You must confirm the liquidity sweep happened first. Without the sweep, the signal is weak.
Confirmation Techniques
Use multi-timeframe confluence. Look for order blocks or FVGs near the CISD point. The more confluence you have, the better the signal quality.
Probability Improvement Methods
Track your trades in a journal. Over time, you’ll learn which conditions produce the best results. Stick to your highest-probability setups only.
Advantages and Disadvantages of CISD
Advantages
CISD gives precise entry signals. It works across all markets — forex, crypto, stocks. It’s rooted in institutional logic, making it reliable.
Disadvantages
It requires patience. False signals can occur in choppy markets. It has a learning curve for beginners.
Limitations
CISD doesn’t work well without multi-timeframe analysis. It’s not a standalone strategy — it needs to be combined with other ICT tools for best results.
Common Mistakes Traders Make with CISD
Entering Too Early
Many traders jump in at the first sign of a reversal without waiting for the actual CISD confirmation. This leads to early entries that fail.
Ignoring Higher Timeframe Bias
Trading CISD against the higher timeframe trend is one of the most common and costly mistakes. Always align with the bigger picture.
Overtrading
Not every session will give a clean cisd trading setup. Forcing trades when conditions aren’t right leads to unnecessary losses.
Poor Risk Management
Even if your analysis is perfect, poor position sizing or tight stops in the wrong places can ruin otherwise good trades.
CISD Trading Psychology
Patience and Discipline
CISD rewards waiting. The setup has rules — follow them. Don’t rush. The market will always give another opportunity.
Waiting for Confirmation
Impulsive traders lose. Disciplined traders wait for the liquidity sweep AND the CISD confirmation before entering. That’s the edge.
Managing Emotions During Trades
Once you’re in a trade, let the plan run. Set your stop, set your target, and walk away. Watching every tick will destroy your decision-making.
Tools and Platforms for CISD Trading
Chart Platforms (like TradingView)
TradingView is the most popular platform for cisd trading analysis. It offers clean charts, drawing tools, and custom indicators.
Drawing Tools
Use horizontal lines to mark liquidity pools, rectangles to draw order blocks, and the Fibonacci tool to mark premium/discount zones.
Templates and Layout Tips
Save your chart layout as a template so you don’t have to rebuild it every session. Keep it clean — less clutter means clearer thinking.
How to Practice CISD Trading Without Risk
Demo Accounts
Open a free demo account on any broker. Practice identifying and trading CISD setups with virtual money until you’re consistently profitable.
Backtesting Methods
Go back through historical charts and mark every CISD you can find. Study what happened after each one. This builds your eye and pattern recognition.
Replay Mode Practice
TradingView has a bar replay feature. Use it to replay past markets in real time and practice your cisd trading decisions as if they were live.
CISD PDF Download
Guide Download Section
Many traders look for a CISD PDF to study offline. You can compile the key concepts from this guide — CISD definition, identification rules, entry models, and risk management tips — into a personal PDF reference sheet. Keep it handy while you trade.
FAQs About CISD Trading
Question: What is the best timeframe to trade CISD?
Answer: The 15-minute and 1-hour charts are ideal for most traders. Use higher timeframes to set your bias.
Question: Is CISD Trading good for beginners?
Answer: Yes, with patience. Start with the step-by-step strategy outlined above, use a demo account, and study the examples.
Question: How accurate is CISD?
Answer: When used with proper multi-timeframe analysis and confluence, CISD setups can be very accurate. No strategy is 100%, but CISD is among the better tools.
Question: Does CISD work in Forex and Crypto?
Answer: Absolutely. CISD works in any liquid market — forex, cryptocurrency, stocks, and indices.
Question: What is the difference between CISD and CHoCH?
Answer: CHoCH is the first early sign of a possible reversal. CISD is the confirmed delivery shift. CISD is stronger and more reliable for entries.
Final Summary — How to Start CISD Trading Today
Beginner Action Plan
Start by learning market structure. Then study liquidity and order flow. Practice identifying CISD on demo charts for at least 30 days before going live.
Key Rules to Remember
Always wait for the liquidity sweep. Confirm the CISD. Align with higher timeframe bias. Risk no more than 2% per trade. Keep a trading journal.
Next Steps for Learning
Dive deeper into ICT methodology. Study order blocks, fair value gaps, and market maker models. CISD is one powerful piece of a larger and highly effective trading system.
Conclusion
CISD trading is one of the most precise and logical concepts in the ICT toolkit. It tells you exactly when the market has switched direction — not based on guesswork, but based on real institutional order flow and liquidity mechanics.
Whether you’re trading forex, crypto, or stocks, understanding and applying CISD can truly transform how you read the market. It takes practice, patience, and discipline — but once it clicks, it becomes one of the most valuable tools in your trading arsenal.
Start simple. Learn the rules. Practice every day. And let the market come to you.

What Is Position Trading? A Simple & Complete Guide
Have you ever heard someone say, ‘Buy and hold’? That is the heart of position trading. It is a long-term trading strategy where you buy something — like a stock, forex pair, or crypto — and hold it for weeks, months, or even years.
Unlike day trading, position trading is slow and calm. You do not need to sit in front of a screen all day. You wait for the right moment, enter a trade, and let it grow over time.
In this guide, you will learn everything about position trading — what it is, how it works, the best strategies, tools, risks, and tips to get started. Whether you are a total beginner or just exploring long-term trading ideas, this guide is for you.
Position Trading in Simple Words
Position trading means buying an asset and holding it for a long time to earn a profit when the price goes up. It is based on the idea that big trends take time to develop. So instead of making quick trades, you wait for the market to move in your favor.
Here is a simple example: Imagine you buy 10 shares of Apple stock at $150. You believe Apple will grow over the next 6 months. You hold your shares. Six months later, Apple is at $200. You sell and earn a profit. That is position trading!
It is sometimes called the ‘buy and hold trading method’ because you simply buy, wait, and hold until your target is reached.
What Is a Position Trader?
A position trader is someone who trades with patience. They do not panic when the market drops a little. They look at the big picture. They study long-term trends and use that knowledge to decide when to buy and when to sell.
Position traders are usually not glued to their screens all day. They check their trades once a day or even a few times a week. They trust their research and wait calmly for the market to move in their direction.
A position trader meaning is simple: it is a trader who plays the long game.

How Position Trading Works
Understanding how position trading works is easy when you break it into steps:
- Finding trends: First, you look for a market that is moving in one direction for a long time. This is called a trend. If prices are going up, it is an uptrend. If prices are going down, it is a downtrend.
- Opening a trade: Once you spot a strong trend, you enter the trade. For an uptrend, you buy. For a downtrend, you may sell short.
- Holding for weeks or months: After entering, you hold the trade. You are not looking for small daily moves. You want the big price change that comes over weeks or months.
- Closing for profit: When your target price is reached — or when the trend shows signs of ending — you close the trade and take your profit.
This is the basic flow of a position trading strategy: spot the trend, ride it, and exit at the right time.
How Long Do Position Traders Hold Trades?
The position trading time frame is much longer than day trading or swing trading. Most position traders hold their trades for a few weeks to several months. Some even hold for a year or more.
Here is a simple timeline example:
- Short position trade: 2 to 6 weeks
- Medium position trade: 2 to 6 months
- Long position trade: 6 months to 2+ years
The exact time depends on the market and the trend. Some strong trends in stocks or crypto can last for years. Others in forex might last a few months.
5. Step-by-Step Guide to Start Position Trading
Here is a simple position trading tutorial to help you begin:
- Step 1 — Learn the basics: Read about how markets work, what trends are, and how to read a chart. This guide is a great start!
- Step 2 — Choose a market: You can do position trading in stocks, forex, commodities, or crypto. Pick one that interests you and that you can research easily.
- Step 3 — Open a trading account: Choose a trusted broker that offers low fees and the market you want to trade. Popular ones include TD Ameritrade, eToro, and Interactive Brokers.
- Step 4 — Start with small trades: Never risk all your money. Start small. Learn from your trades. Add more capital as you grow in confidence.
Position trading for beginners is very doable. Just be patient and take one step at a time.
6. How Much Money Do You Need for Position Trading?
Good news: you do not need a lot of money to start! Many brokers let you start with as little as $50 or $100.
A smart rule in risk management in position trading is the 1-2% rule. This means: never risk more than 1-2% of your total money on a single trade.
- If you have $100, risk only $1 to $2 per trade.
- If you have $1,000, risk only $10 to $20 per trade.
This keeps you safe even when trades go wrong. Over time, your small wins can grow into big gains. The key is to protect your capital and trade smart.
7. Position Trading vs Other Trading Styles
7.1 Position Trading vs Day Trading
Day trading means buying and selling within the same day. It is fast, stressful, and requires constant screen time. Position trading vs day trading is like a marathon vs a sprint. Day traders may make many trades daily and need to be very quick. Position traders are slow and steady. They care about the big picture, not the small daily moves.
7.2 Position Trading vs Swing Trading
Swing trading sits in between. Swing traders hold trades for a few days to a few weeks. Position trading vs swing trading comes down to time and patience. Swing traders react to short-term price swings. Position traders ignore those and wait for major long-term moves.
7.3 Position Trading vs Long-Term Investing
Long-term investing (like buying and forgetting) can mean holding for 5, 10, or 20 years. Position traders are more active. They still use charts and signals. They may enter and exit several times a year. Investing is passive. Position trading is active but slow.
8. Best Position Trading Strategies
8.1 Trend Following Strategy
This is the most popular position trading strategy. You simply follow the trend. If a market has been going up for several weeks, you buy and ride that upward trend. Tools like Moving Averages help you spot and confirm the trend. This is also called the trend-following trading strategy.
8.2 Breakout Strategy
A breakout happens when the price moves above a level it has been stuck at for a while. Position traders watch these breakout points carefully. When the price breaks out with strong momentum, they enter the trade and hold it as the new trend begins.
8.3 Pullback Strategy
Sometimes, prices go up a lot and then drop a little before going up again. That small drop is called a pullback. Smart position traders use this as a chance to buy at a better price. It is a safe entry point in a long-term uptrend.
8.4 Value-Based Position Trading
This strategy looks at whether an asset is priced too low compared to its real value. If a stock is ‘on sale’ compared to what the company is worth, traders buy it and hold until the market corrects the price. This is similar to the value investing idea used by Warren Buffett.
8.5 Sector Rotation Strategy
Markets move in cycles. Some industries boom during certain economic periods. For example, tech stocks may boom during low interest rates, while energy stocks may do better when inflation rises. The sector rotation strategy means moving your money into the sectors that are set to grow next.
9. Best Tools for Position Trading
Having the right position trading tools makes a huge difference. Here are the most important ones:
- Trading Charts: TradingView and MetaTrader are the most popular platforms. They let you view price charts, add indicators, and spot trends easily.
- Indicators — The best indicators for position trading include: Moving Averages (MA) to spot the trend direction; RSI (Relative Strength Index) to see if an asset is overbought or oversold; Support and Resistance levels to find safe entry and exit points.
- News and Economic Calendars: Big news events move markets. Tools like Forex Factory or Investing.com show you upcoming events so you are not caught off guard.
10. Position Trading in Different Markets
10.1 Position Trading in Stocks
Position trading stocks is very common. Traders look for companies with strong growth trends, great earnings, or an industry boom. They buy shares and hold for months as the company grows. Stocks like Apple, Tesla, and Amazon have given huge returns to patient position traders.
10.2 Position Trading in Forex
Position trading forex means holding a currency pair for weeks or months. Currency trends are driven by economic events, interest rates, and government policies. Forex position traders study macro trends and hold through short-term price noise to catch big moves.
10.3 Position Trading in Commodities
Gold, oil, and silver are popular commodities for position traders. These assets often move in long, slow trends based on global supply and demand. A macro trend trading strategy works very well here. For example, gold often rises during economic uncertainty, offering great position trade opportunities.
10.4 Position Trading in Crypto
Position trading crypto has become popular in recent years. Cryptocurrencies like Bitcoin and Ethereum have shown massive long-term trends. Position traders buy during early uptrends and hold as crypto grows. It is volatile, but the rewards can be enormous for patient traders.
11. Risk and Reward Explained Simply
Every trade has risk. But smart position trading rules help you protect your money.
- Stop Loss: A stop loss is a price level where you automatically exit the trade if it moves against you. For example, you buy Bitcoin at $40,000 and set a stop loss at $37,000. If Bitcoin falls to $37,000, your trade closes automatically, limiting your loss.
- Take Profit: A take profit is the price where you exit with your planned gain. For example, you set a take profit at $50,000. When Bitcoin hits that level, you lock in your profit.
- Risk-Reward Ratio: A good rule is to aim for at least a 1:3 ratio. This means if you risk $100, you aim to make $300. Even if you lose half your trades, you still make money overall.
Understanding position trading profit targets and stop loss levels is one of the most important parts of any position trading system.
12. Mindset of a Successful Position Trader
Position trading psychology is just as important as strategy. Here is the mindset you need:
- Patience: Trends take time. You cannot rush the market. Learn to wait for your trade to develop without panicking.
- Discipline: Stick to your plan. Do not change your stop loss because you are scared. Do not exit early because of a small dip. Trust your analysis.
- Avoid emotions and fear: When markets drop, fear kicks in. When markets rise too fast, greed takes over. The best position traders stay calm and follow their system, not their feelings.

13. Common Mistakes Position Traders Make
Even experienced traders make mistakes. Here are the most common ones to avoid:
- No Stop Loss: Skipping your stop loss can lead to huge losses. Always set one before you enter a trade.
- Trading too much: More trades do not mean more profit. In position trading, quality matters more than quantity.
- Following fake news: Social media is full of tips and rumors. Do your own research. Do not buy or sell based on hype.
- Using too much leverage: Leverage boosts your profits but also your losses. Using too much leverage on a long position trade can wipe out your account if the market moves against you.
14. Real-Life Position Trading Example
Here is a simple story to show how position trading works in real life:
In early 2020, Alex noticed that gold was trending upward. The world was facing uncertainty, and people were buying gold as a safe asset. Alex studied the long-term technical analysis on the gold chart and saw a clear uptrend.
He bought gold at $1,600 per ounce and set a stop loss at $1,500. He set his take profit at $1,900.
Over the next 6 months, gold climbed steadily. He held patiently through a few small dips. In August 2020, gold hit $1,900. Alex closed his trade and made a profit of $300 per ounce.
This is a classic position trading example — spot the trend, enter wisely, hold patiently, and exit at your target.

15. Pros and Cons of Position Trading
Let us look at the advantages of position trading and its downsides:
Advantages
- You do not need to watch the market every day
- Less stress compared to day trading
- Big profit potential from major trends
- Works well for busy people who cannot trade full-time
- Lower trading fees because you make fewer trades
Disadvantages
- Your money is tied up for a long time
- Overnight swap fees can add up in forex
- Requires patience — not good for people who want quick results
- Large price swings can be scary during the holding period
16. Is Position Trading Safe for Beginners?
Yes! Position trading is actually one of the best styles for beginners. Here is why:
Who should try it: If you have a job and cannot trade all day, position trading is perfect. If you are patient and like research, this style suits you. If you want a simple, low-stress approach, go for it.
Who should avoid it: If you need money in the short term, this style is not for you. If you get very stressed seeing your account value go up and down, you may struggle. And if you want fast results, look into swing trading first.
17. Beginner Checklist for Position Trading
Here is a quick position trading tutorial checklist to get started right:
- Choose a market with a clear long-term trend
- Set your risk per trade (use the 1-2% rule)
- Pick your entry, stop loss, and take profit before entering
- Open the trade and be patient — do not keep changing it
- Review your trades every week to learn and improve
- Keep a trading journal to track your progress
18. Fees, Taxes, and Costs in Position Trading
Position trading is not completely free. Here are costs to be aware of:
- Broker Fees: Most brokers charge a small commission per trade. Some charge a spread (difference between buy and sell price). Always compare fees before choosing a broker.
- Swap/Holding Costs: In forex, holding a trade overnight can cost you a small daily fee called a ‘swap.’ Over weeks or months, this can add up significantly. Factor this into your profit target.
- Taxes: In most countries, profits from trading are taxable. The exact rules vary by country. It is always a good idea to consult a tax professional about your trading gains.
19. Future of Position Trading
The world of position trading is evolving fast. Here is what to watch:
- AI Tools: Artificial intelligence is now helping traders spot trends faster and more accurately. AI-powered position trading signals and tools are becoming more common and accessible even to beginners.
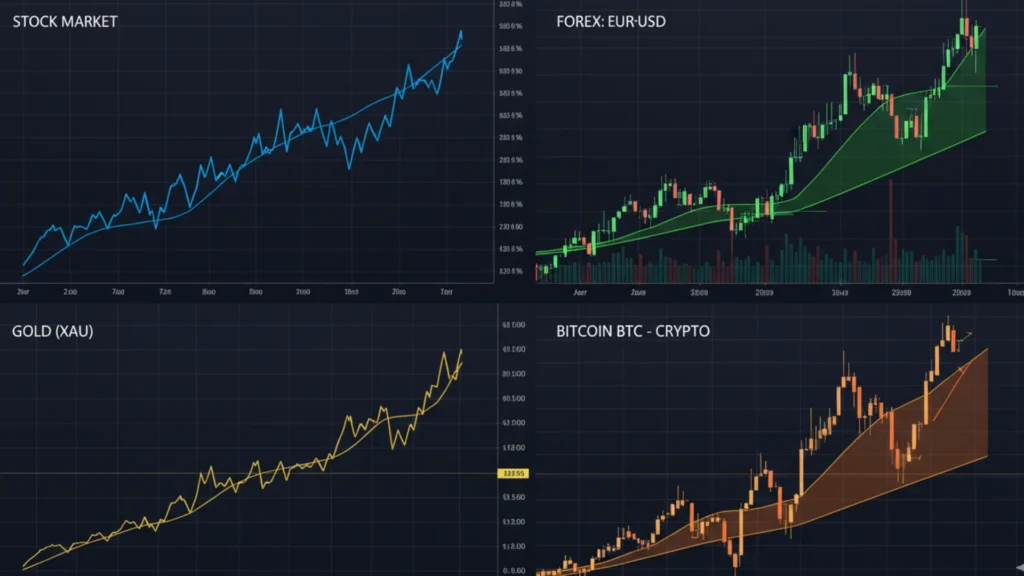
- Crypto Growth: As crypto markets mature, more institutional investors are using long-term trend trading strategies in Bitcoin, Ethereum, and other assets. This makes crypto a growing space for position traders.
- Long-Term Market Trends: Global megatrends like clean energy, technology, and healthcare are creating new opportunities for macro trend trading strategy. Patient position traders who spot these early can benefit greatly.

20. Conclusion
Position trading is one of the smartest and most relaxed ways to trade the financial markets. It suits people who are patient, disciplined, and willing to let their trades breathe over time.
You do not need to be glued to a screen. You do not need thousands of dollars. You just need a solid plan, the right tools, and the patience to wait for the market to do its thing.
Remember: the best position trading strategy is the one you can stick to through ups and downs. Start small, learn constantly, and treat every trade as a lesson.
Now go out there, pick your market, spot a trend, and let your first long-term trading strategy journey begin!
❓ Frequently Asked Questions (FAQ)
Q1: What is the typical holding time in position trading?
Most position trades are held for a few weeks to several months. Some traders hold for a year or more depending on the strength of the trend. The position trading time frame depends on the market and the trader’s goal.
Q2: Is position trading profitable?
Yes, position trading can be very profitable when done correctly. Catching a major trend and riding it for months can generate significant returns. However, like all trading, there is risk. Proper risk management in position trading is essential to long-term success.
Q3: Is position trading better than day trading?
It depends on your lifestyle and personality. Position trading is less stressful, requires less screen time, and is great for people with busy lives. Day trading can be more exciting but is also harder and more stressful. For beginners, position trading is generally the safer and easier choice.
Q4: Can beginners do position trading?
Absolutely! Position trading for beginners is one of the best starting points. The slower pace gives you time to learn and research. You do not need advanced skills — just basic chart reading and a solid plan.
Q5: What indicators are best for position trading?
The best indicators for position trading include Moving Averages (50-day and 200-day), the RSI (Relative Strength Index), MACD (for trend strength), and Support & Resistance levels. These tools help you identify long-term trends and find good entry points.
Q6: Can position trading work in crypto?
Yes! Position trading crypto works well because crypto markets have shown powerful long-term trends. Bitcoin, for example, has had several massive multi-month uptrends over the years. Position traders who caught those trends early earned huge profits. Just remember — crypto is volatile, so always use a stop loss.
What is Breaker Blocks: Simple Steps to Master Forex Trading
What Is a Breaker Block?
A breaker block is a special area on a trading chart where the price breaks through an important level and then comes back to test it. Think of it like a door that was locked, someone broke it open, and now people want to check if it’s really broken. In forex trading and other markets, breaker blocks help traders find good entry points.
Breaker Block Explained in Simple Words
Imagine you’re playing a game where you need to jump over walls. A breaker block is like a wall that you jumped over, but then you come back to touch it one more time before running away fast. In trading, when price breaks a support or resistance level, that broken level becomes a breaker block. Smart traders wait for price to return to this block before entering a trade.
How a Breaker Block Forms Step by Step
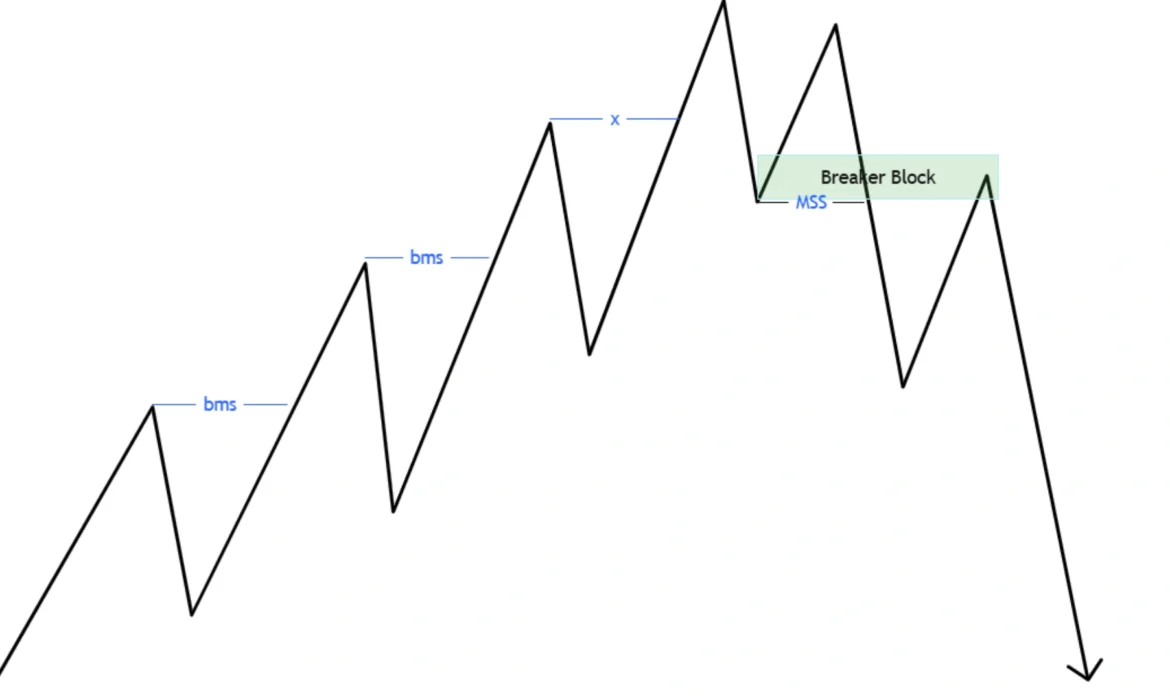
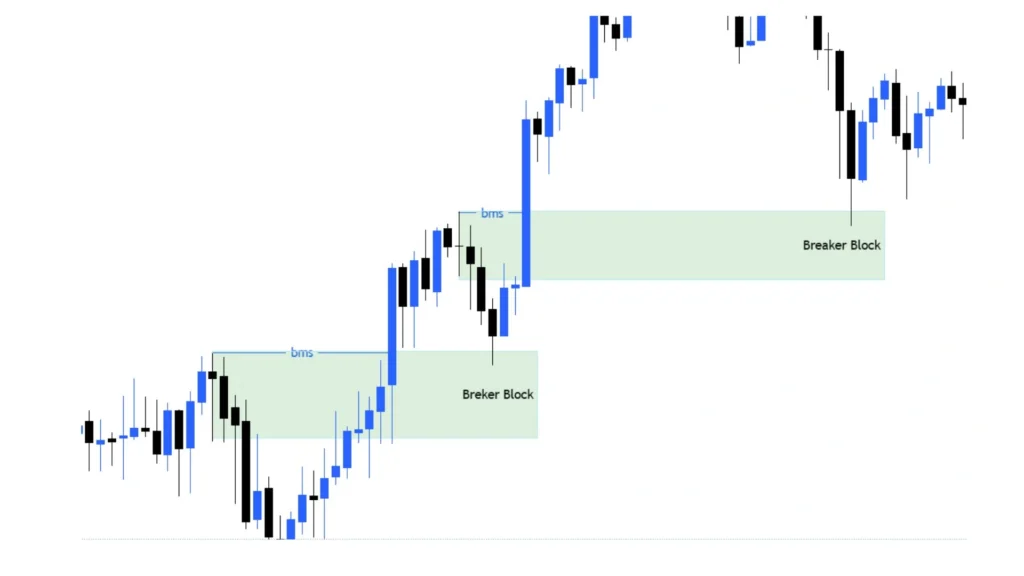
A breaker block forms in three simple steps. First, price creates a support or resistance zone. Second, price breaks through this zone with strong momentum (this is called a structure break). Third, price comes back to retest this broken zone. This retested zone is now your breaker block. The breaker block concept helps traders understand market structure better.
Bullish Breaker Block Explained
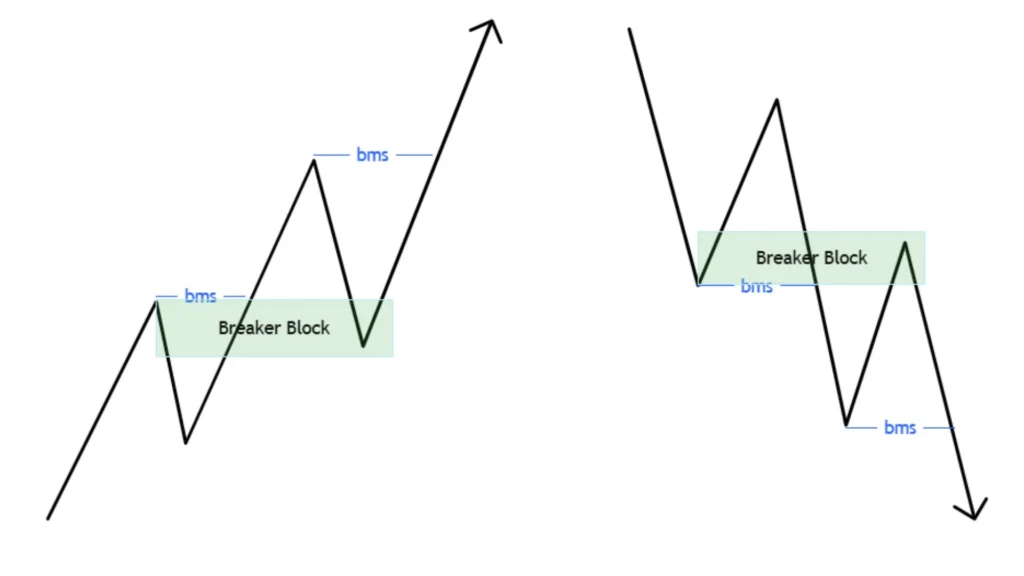
A bullish breaker block happens when price breaks below a support level and then comes back up to test it. After the test, price usually continues going up. Think of it like digging under a fence, then climbing back up to check the fence, and finally jumping over it to go higher. Traders use bullish breaker blocks to find buy opportunities.
Bearish Breaker Block Explained
A bearish breaker block is the opposite. Price breaks above resistance, comes back down to test it, and then continues falling. It’s like jumping over a high wall, landing on the other side, touching the wall one more time, and then running downhill. Bearish breaker blocks signal selling opportunities in the market.
How to Identify Breaker Blocks on a Chart
Finding breaker blocks isn’t hard once you know what to look for. You need to train your eyes to spot structure breaks and retests.
Simple Checklist to Find a Breaker Block
Here’s your easy checklist: First, find a clear support or resistance level. Second, watch for a strong break of this level. Third, wait for price to come back and touch the broken level. Fourth, look for rejection signs like a pin bar or engulfing candle. If all these happen, you’ve found a breaker block forex setup.
How to Find Bullish Breaker Blocks
To find bullish breaker blocks, look at downtrends. Find where price breaks below old support levels. Mark the last bearish candle before the break. When price comes back up to this candle, that’s your bullish breaker block. The key is waiting for the retest to complete before entering.
How to Find Bearish Breaker Blocks
For bearish breaker blocks, do the opposite. Look at uptrends. Find where price breaks above old resistance. Mark the last bullish candle before the break. When price returns down to this candle, you’ve found your bearish breaker block. This is where selling pressure often comes in.
Valid vs Fake Breaker Blocks (Beginner Rules)
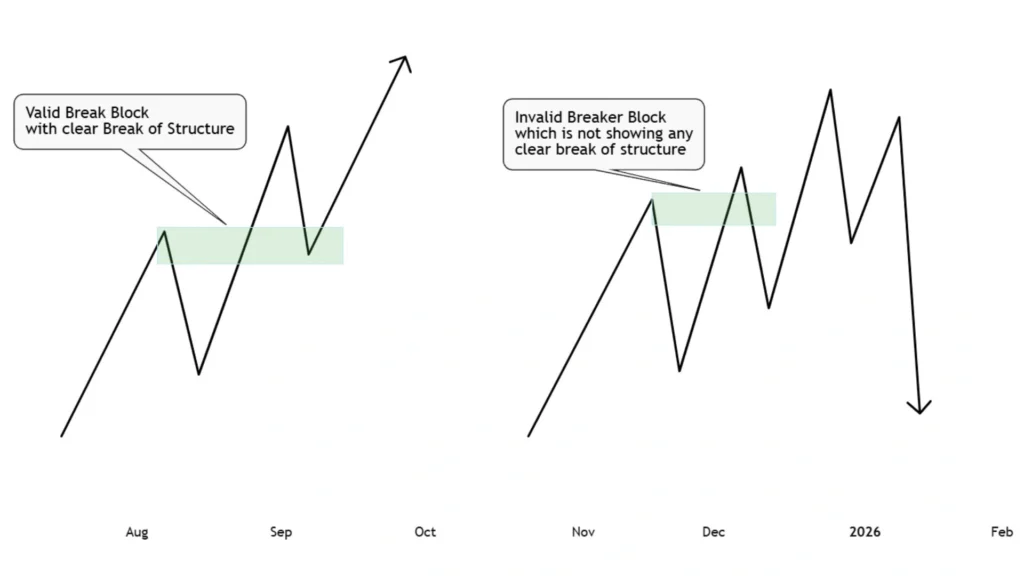
Not all breaker blocks work. A valid breaker block has a clean structure break with strong momentum. A fake one has weak breaks or too many retests. Valid breaker blocks also respect the liquidity zones around them. If price breaks but immediately comes back, it might be a fake signal. Always check the higher timeframe for confirmation.
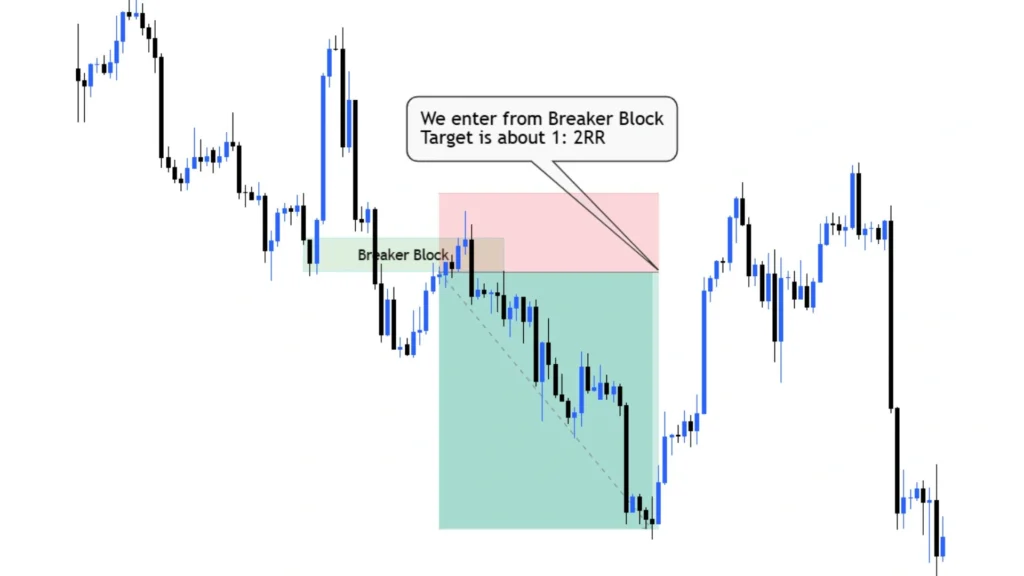
Breaker Block Trading Strategy
Now let’s talk about how to actually trade using breaker blocks. This breaker block trading strategy is simple and works on any market.
How to Trade Using Breaker Blocks
Wait for price to break a key level. Let it move away from the break point. When price returns to the breaker block, look for rejection candles. Enter your trade when you see confirmation. The breaker block strategy works best when combined with order flow analysis.
Entry Rules for Breaker Block Trades
For bullish trades, enter when price retests the breaker block from below and shows rejection (like a bullish engulfing or hammer). For bearish trades, enter when price retests from above with bearish rejection patterns. Never enter before the retest completes. This entry strategy keeps you safe from false moves.
Stop Loss Placement
Put your stop loss just beyond the breaker block. For bullish trades, place it below the block. For bearish trades, place it above. Give it some breathing room (5-10 pips for forex). This protects you if the breaker block fails. Good risk management always includes proper stop loss placement.
Take Profit Targets
Your first target should be the next structure level. For example, if you bought at a bullish breaker block, aim for the next resistance. You can also use a 1:2 or 1:3 risk-reward ratio. Some traders use liquidity pools as targets. The breaker block high probability setup often gives great risk-reward opportunities.
Risk Management Rules
Never risk more than 1-2% of your account on one trade. Use proper position sizing. Don’t trade every breaker block you see. Pick the best setups only. Keep a trading journal to track which breaker block setups work best for you.
Breaker Block Trading Examples
Let’s look at real trading examples so you can see how breaker blocks work in practice.
Bullish Breaker Block Example
Imagine EUR/USD is falling. Price breaks below 1.0800 support strongly. Then price pulls back up to 1.0800. You see a hammer candle form right at 1.0800. This is your entry signal. You buy at 1.0805, put stop loss at 1.0785, and target 1.0850. Price moves up and hits your target. That’s a successful bullish breaker block trade.
Bearish Breaker Block Example
Now let’s say GBP/USD breaks above 1.2500 resistance. Price moves to 1.2540, then comes back down to 1.2500. A bearish engulfing forms. You sell at 1.2495, stop at 1.2515, target 1.2450. Price drops and you win. This bearish breaker block gave you a clear edge.
EUR/USD Breaker Block Example
On EUR/USD 4-hour chart, price breaks through 1.0750 support. After moving down to 1.0700, it returns to 1.0750. A pin bar forms showing rejection. This breaker block forex setup offers a selling opportunity with a stop above 1.0760 and target at 1.0680.
USD/JPY Breaker Block Example
USD/JPY breaks above 150.00 on the daily chart. Price reaches 150.50, then pulls back to 150.00. This creates a bearish breaker block. When price shows weakness here, you can short with confidence, targeting 149.50.
AUD/USD Breaker Block Example
AUD/USD breaks below 0.6500. Price tests 0.6500 from below and rejects. This bullish breaker block gives you a buy signal with a target at 0.6550. The structure break and retest pattern makes this a high-probability trade.
Best Timeframes and Markets for Breaker Blocks
Breaker blocks work on different timeframes and markets, but some are better than others.
Best Timeframe to Trade Breaker Blocks
The 4-hour and daily timeframes work best for breaker blocks. These give cleaner signals and fewer fake-outs. For scalping, you can use 15-minute or 1-hour charts, but expect more noise. Higher timeframes have stronger breaker blocks because more traders watch them.
Best Forex Pairs for Breaker Block Trading
Major pairs like EUR/USD, GBP/USD, and USD/JPY work great. They have good liquidity and cleaner price action. Exotic pairs can be choppy and give false signals. Stick to majors when learning the breaker block trading guide principles.
Using Breaker Blocks in Crypto and Stocks
Breaker blocks work in crypto markets like Bitcoin and Ethereum. They also work in stocks, especially on larger timeframes. The concept is the same—find the break, wait for the retest, and trade the rejection. Market structure principles apply everywhere.
ICT Breaker Block Strategy Explained
ICT (Inner Circle Trader) has a specific way of teaching breaker blocks. Let’s understand his approach.
What Is ICT Breaker Block?
ICT breaker block is a failed order block that becomes a new trading zone. In the ICT strategy, when an order block fails to hold price, it “breaks” and becomes a breaker block. This connects to smart money concepts and institutional trading patterns.
Types of ICT Breaker Blocks
ICT teaches two main types: bullish and bearish. But he also talks about nested breaker blocks (breaker blocks within breaker blocks) and premium/discount breaker blocks based on where they form in the price range.
ICT Bullish Breaker Block
An ICT bullish breaker block forms when a bearish order block fails. Price breaks below it, sweeps liquidity, then returns to the failed order block. This zone now acts as support. Smart money uses this for long entries.
ICT Bearish Breaker Block
An ICT bearish breaker block is a failed bullish order block. Price breaks above, grabs liquidity, then returns. Now this zone becomes resistance. Banks and institutions use these levels to distribute positions.
Complete ICT Breaker Block Trading Strategy
The complete ICT approach includes: identify the order block, wait for it to fail, watch for liquidity sweep, wait for retest of the failed block, enter on confirmation, and target the next liquidity pool. This institutional trading approach requires patience but offers great rewards.
Breaker Block vs Other Trading Concepts
Understanding how breaker blocks compare to other concepts helps you trade better.
Breaker Block vs Order Block
An order block is where institutions place orders. A breaker block is a failed order block. Order blocks haven’t broken yet; breaker blocks have. Both are important, but breaker blocks often give stronger signals because they show a shift in market structure.
Breaker Block vs Mitigation Block
Mitigation blocks are similar to breaker blocks but focus on where institutions mitigate their positions. The main difference is context. A breaker block emphasizes the break and retest, while a mitigation block focuses on the institutional positioning.
Breaker Block vs Support and Resistance
Traditional support and resistance are static levels. Breaker blocks are dynamic—they were support/resistance that got broken and now flip polarity. Breaker blocks often provide better entries because they combine structure break with retest.
Breaker Block vs Fair Value Gap (FVG)
Fair value gaps are price imbalances on the chart. Breaker blocks are retested broken levels. You can use both together. Often, a breaker block forms near a fair value gap, creating a confluence zone for high-probability trades.
Advanced Breaker Block Concepts
Once you master basics, these advanced concepts will improve your trading.
Nested Breaker Blocks
Nested breaker blocks are smaller breaker blocks inside larger ones. For example, a 15-minute breaker block might exist within a 4-hour breaker block. Trading from the nested block gives you a better entry with tighter stops.
Breaker Block Failure Strategy
Sometimes breaker blocks fail. When this happens, it often signals a strong continuation. If a bullish breaker block fails (price breaks below it again), it becomes a bearish signal. Smart traders can profit from these failures too.
Time-Based Filtering
Not all hours are good for trading breaker blocks. London and New York sessions work best. Asian session breaker blocks are often less reliable. Use time-based filtering to improve your win rate.
Volume Profile with Breaker Blocks
Combining volume profile with breaker blocks adds confirmation. Look for breaker blocks that align with high-volume nodes or point of control. This shows where most trading activity happened, making the level stronger.
Trading Breaker Blocks in Different Market Conditions
Markets change, and your approach should too.
Breaker Blocks in Trending Markets
In strong trends, breaker blocks work beautifully. Use them to enter in the trend direction. Don’t fight the trend. If the trend is up, only trade bullish breaker blocks.
Breaker Blocks in Ranging Markets
In ranging markets, breaker blocks appear frequently but are less reliable. Price might retest multiple times. Be more selective and reduce position size in choppy conditions.
Breaker Blocks During High Volatility
During news events or high volatility, breaker blocks can give false signals. Price might blast through without proper retests. Either avoid trading during news or wait for volatility to settle before entering.
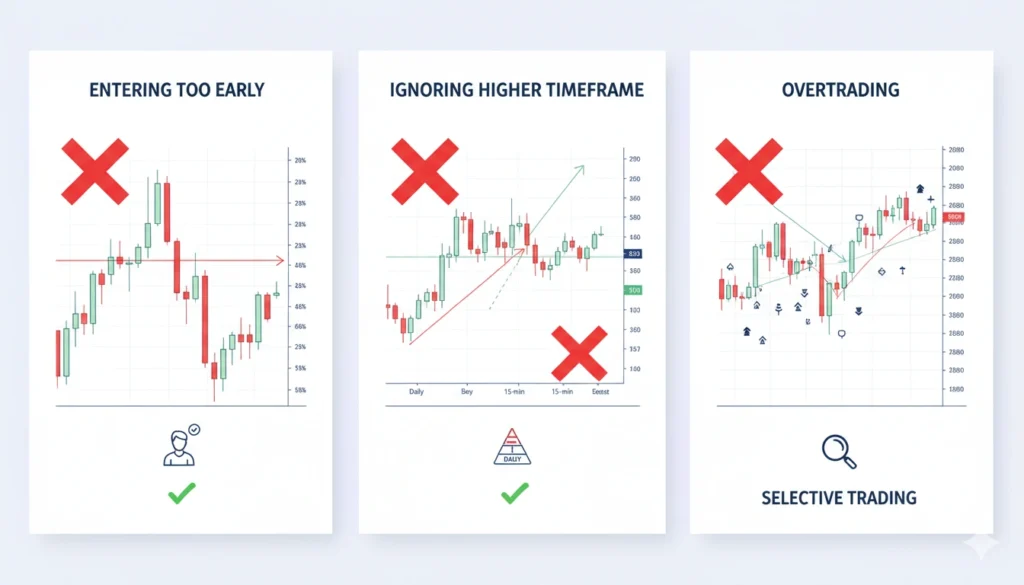
Common Breaker Block Mistakes Beginners Make
Learning from mistakes helps you improve faster.
Why Most Traders Fail with Breaker Blocks
Most traders fail because they enter too early, don’t wait for confirmation, or ignore the higher timeframe context. They also trade every breaker block instead of being selective. The breaker block liquidity concept requires patience.
How to Avoid False Breaker Block Signals
Avoid false signals by checking multiple timeframes, waiting for clear rejection candles, and ensuring the structure break was strong. Don’t trade breaker blocks in ranging markets or during low liquidity hours. Use the BOS (break of structure) and CHoCH (change of character) to confirm validity.
Why Breaker Blocks Work (Smart Money Psychology)
Understanding why breaker blocks work makes you a better trader.
Liquidity and Trapped Traders Explained
When price breaks a level, many traders get SMC trapped on the wrong side. These trapped traders create liquidity. When price returns to the breaker block, it collects this liquidity before moving. This liquidity grab is what makes breaker blocks powerful. Smart money uses this pattern repeatedly.
How Banks Use Breaker Blocks
Banks and large institutions need liquidity to fill their big orders. They break levels to trigger stop losses, creating liquidity. Then they enter at the breaker block retest. This is why the breaker block smart money concept is so important. You’re trading with the big players, not against them.
What Makes a Breaker Block Strong or Weak?
Not all breaker blocks are equal.
Factors That Strengthen a Breaker Block
A strong breaker block has: a clean structure break, strong momentum on the break, quick retest (not too much time), confluence with other levels, and higher timeframe alignment. These factors increase the probability of success.
When a Breaker Block Fails
Breaker blocks fail when: the break was weak, too much time passed before retest, price retests multiple times, or there’s no higher timeframe support. Recognize these warning signs to avoid bad trades.
Beginner-Friendly Trading Plan Using Breaker Blocks
Having a plan keeps you disciplined.
Simple Step-by-Step Breaker Block Trading Plan
Step 1: Identify the trend on the daily chart. Step 2: Find structure breaks on the 4-hour chart. Step 3: Wait for price to retest the broken level. Step 4: Look for rejection candles. Step 5: Enter the trade with proper stop loss. Step 6: Set your target at the next structure level. Step 7: Manage the trade and take partial profits if needed.
Example Trade Plan for Small Accounts
For a $500 account, risk only $10 per trade (2%). Find a breaker block setup with 20-pip stop loss. Use 0.05 lot size. Target 40-60 pips (1:2 or 1:3 reward). This conservative approach protects your capital while you learn.
Pros and Cons of Breaker Block Trading
Every strategy has advantages and disadvantages.
Pros:
- High probability setups when done correctly
- Clear entry and exit rules
- Works across all timeframes and markets
- Aligns with smart money movements
- Good risk-reward opportunities
Cons:
- Requires patience for proper setups
- Can give false signals in choppy markets
- Needs practice to identify correctly
- Requires understanding of market structure
- Not every breaker block works
Breaker Block Cheat Sheet (Quick Summary)
What it is: A broken support/resistance level that price retests
How to find it: Look for structure break + retest
Bullish setup: Break below support → retest from below → rejection → buy
Bearish setup: Break above resistance → retest from above → rejection → sell
Best timeframes: 4-hour and Daily
Entry: At retest with confirmation candle
Stop loss: Just beyond the breaker block
Target: Next structure level or 1:2 risk-reward
Key rule: Always wait for the retest to complete
Frequently Asked Questions About Breaker Blocks
Question: Can breaker blocks be used on all timeframes?
Answer: Yes, breaker blocks work on all timeframes from 1-minute to monthly. However, higher timeframes like 4-hour and daily give more reliable signals. Lower timeframes have more noise and fake signals. The breaker block chart pattern is universal across timeframes.
Question: Are breaker blocks only for forex?
Answer: No, breaker blocks work in forex, stocks, crypto, commodities, and indices. The concept is based on price action and market structure, which exists in all markets. You can use the breaker block technical analysis approach anywhere.
Question: Do breaker blocks always work?
Answer: No trading strategy works 100% of the time. Breaker blocks are high-probability setups, not guarantees. They fail in choppy markets, during unexpected news, or when the structure is unclear. That’s why risk management is crucial.
Question: Can breaker blocks be automated?
Answer: It’s difficult to fully automate breaker blocks because they require context and discretion. You need to judge the quality of the structure break and retest. However, you can create alerts for potential breaker blocks and manually review them.
Question: Is volume important for breaker blocks?
Answer: Volume helps confirm breaker blocks but isn’t essential. High volume on the break shows strong participation. Low volume retests often lead to stronger moves. In forex, where volume data isn’t always available, focus on price action instead.
Conclusion
The breaker block is a powerful tool for traders who understand market structure. Whether you’re using the breaker block ICT strategy or your own approach, the key is patience and proper execution. Start by practicing on demo accounts, identify clean setups on higher timeframes, and always use proper risk management. The breaker block forex education you’ve received here covers everything from basics to advanced concepts. Remember, successful trading isn’t about finding the perfect strategy—it’s about consistent execution of a good one. Master the breaker block price action principles, combine them with smart money concepts, and you’ll have a solid foundation for profitable trading. Keep learning, stay disciplined, and trade with confidence.

Swing Trading vs Day Trading: Which Is Right for You?
Trading is like buying and selling things to make money. Imagine you buy a toy today and sell it tomorrow for more money – that’s trading! But in the real world, people trade stocks, crypto, and other things.
There are two popular ways to trade: day trading and swing trading. Day trading means buying and selling everything in one day. Swing trading means holding onto your trades for a few days or weeks.
Both styles can help you make money, but they work very differently. One needs you to watch screens all day. The other lets you check your trades just a few times. One is fast and exciting. The other is slower and calmer.
In this article, we’ll explain swing trading vs day trading in the simplest way possible. You’ll learn which one fits your life, your money, and your personality. By the end, you’ll know exactly which trading style is better for you!

What Is Day Trading and How Does It Work?
Day trading is when you buy and sell stocks, crypto, or forex within the same day. A day trader never holds anything overnight. They close all their trades before the market closes.
Think of it like this: You buy a lemonade stand in the morning and sell it by evening. You don’t keep it overnight. That’s day trading!
Day traders watch the market all day long. They look for small price changes and try to make quick profits. They might make 5, 10, or even 20 trades in a single day. The goal is to catch small movements and earn money from each one.
Day traders need to be fast thinkers. They use charts, patterns, and news to decide when to buy or sell. It’s like a video game where you need quick reflexes!
Day Trading Strategies (Beginner-Friendly)
Day traders use different strategies to make money. Here are the most common ones explained simply:
Scalping: Scalping means making lots of tiny trades. You buy, sell quickly, and make small profits many times. It’s like collecting pennies fast!
Momentum Trading: You find stocks moving up fast and jump on the ride. When they slow down, you get off. It’s like catching a fast train.
Breakout Trading: You wait for a price to “break out” from a pattern, then you buy. It’s like waiting for a balloon to pop upward.
News Trading: Big news moves prices fast. Day traders buy or sell based on news announcements.
These strategies need practice, but beginners can learn them with time.
Advantages of Day Trading
Why do people love day trading? Here are the benefits:
- Quick Results: You know if you made or lost money by the end of each day
- No Overnight Risk: You don’t worry about what happens while you sleep
- More Opportunities: You can make many trades every single day
- Exciting: It’s fast-paced and keeps you alert
- Daily Income Potential: Some traders make money every day
Day trading can be thrilling for people who love action and fast decisions.

Disadvantages & Risks of Day Trading
But day trading isn’t easy. Here are the challenges:
- Very Stressful: Watching screens all day is tiring and pressure-filled
- Requires Full Time: You need 6-8 hours daily to day trade properly
- High Risk: You can lose money very quickly
- Expensive Fees: Making many trades costs money in fees
- Needs More Capital: Some places require $25,000 minimum to day trade
- Emotional Burnout: The constant pressure can exhaust you mentally
Day trading demands dedication, discipline, and strong nerves. It’s not for everyone.
What Is Swing Trading and How Does It Work?
Swing trading is holding trades for several days or weeks. Instead of closing everything today, swing traders keep positions open longer.
Imagine planting a seed and waiting for it to grow. You don’t check it every hour. You check every few days. That’s swing trading!
Swing traders look for bigger price movements. They don’t care about tiny changes during the day. They want to catch the “swing” – when prices move up or down over several days.
A swing trader might check their trades once or twice daily. They spend maybe 30 minutes to 2 hours managing trades. The rest of the day, they can do other things – work a job, spend time with family, or enjoy hobbies.
Swing trading is perfect for people who want to trade but don’t want trading to become their whole life.

Swing Trading Techniques Explained
Swing traders use different techniques. Here are the simplest ones:
Trend Following: You find a trend going up or down and follow it for days. Ride the wave!
Support and Resistance Trading: Prices bounce at certain levels. Swing traders buy at the bottom (support) and sell at the top (resistance).
Pattern Trading: Traders look for chart patterns that repeat and predict what happens next.
Moving Average Strategy: Using lines that show average prices helps traders see trends clearly.
These techniques are easier to learn than day trading strategies because you have more time to think.
Advantages of Swing Trading
Why do many traders prefer swing trading? Here’s why:
- Less Stressful: You’re not glued to screens all day
- Works With a Job: You can swing trade and work full-time
- More Thinking Time: You can research and plan carefully
- Lower Trading Costs: Fewer trades mean fewer fees
- Better Sleep: Your trades work while you sleep
- Bigger Profit Targets: You aim for larger gains per trade
Swing trading fits real life better. You don’t need to quit your job or sacrifice everything.

Disadvantages & Risks of Swing Trading
But swing trading has downsides too:
- Slower Results: You wait days or weeks to see profits
- Overnight Risk: News can change prices while you sleep
- Requires Patience: Not everyone can wait days for results
- Fewer Trading Opportunities: You make fewer trades overall
- Holding Through Dips: Prices might drop before rising again
Swing trading needs patience and trust in your analysis. Impatient people might struggle.
Day Trading vs Swing Trading: Key Differences
Now let’s compare day trading and swing trading side by side. Understanding these differences helps you choose wisely.
Time Frame & Trade Duration
Day Trading: Trades last minutes to hours. Everything closes before market close.
Swing Trading: Trades last days to weeks. Sometimes even months.
Think of day trading as a sprint. Swing trading is a marathon.
Trading Frequency
Day Trading: You might make 5 to 50 trades daily.
Swing Trading: You might make 5 to 15 trades monthly.
Day traders are busy all day. Swing traders make fewer, bigger moves.
Time & Screen Commitment
Day Trading: Needs 6-8 hours of screen time daily.
Swing Trading: Needs 30 minutes to 2 hours daily.
Day trading is a full-time job. Swing trading is part-time friendly.
Stress Level & Emotional Pressure
Day Trading: High stress! Every minute counts. Quick decisions needed.
Swing Trading: Lower stress. More time to think and plan.
Day trading can burn you out fast. Swing trading lets you breathe.
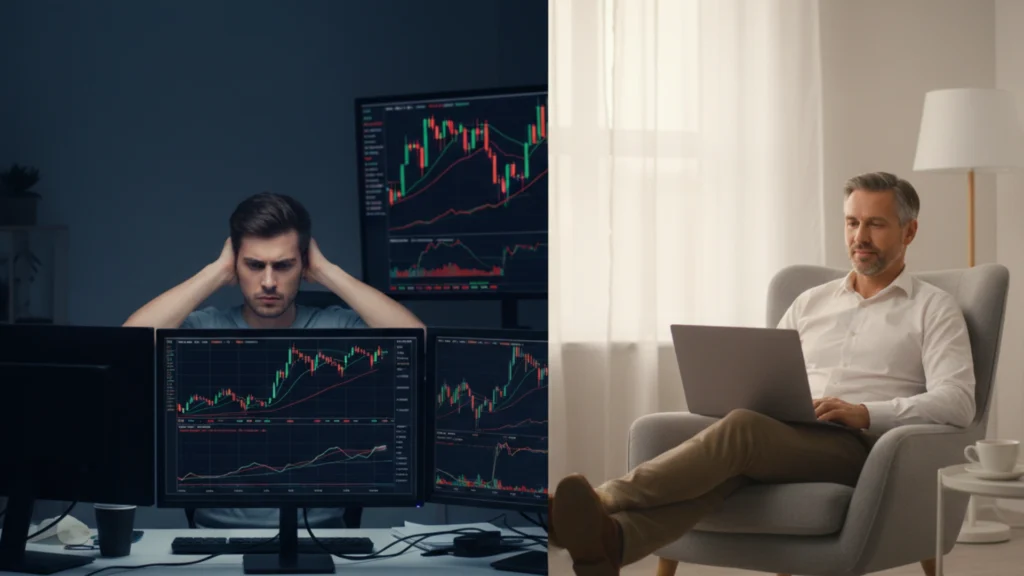
Capital & Equipment Needed
Day Trading: Often requires $25,000+ (US pattern day trader rule). Needs powerful computers and fast internet.
Swing Trading: Can start with $500-$1,000. Regular laptop and normal internet work fine.
Day trading has bigger barriers to entry. Swing trading is more accessible.
Profit Speed vs Patience
Day Trading: Quick profits (or losses) daily.
Swing Trading: Profits come slower but potentially bigger per trade.
Day traders want money fast. Swing traders are willing to wait for better rewards.
Day Trading vs Swing Trading in Different Markets
Both trading styles work in different markets. But which style works better where?
Crypto Day Trading vs Swing Trading
Crypto markets never sleep. They’re open 24/7.
Day Trading Crypto: Great for day traders because crypto moves fast. You can catch big movements within hours. But it’s extremely volatile and risky.
Swing Trading Crypto: Also excellent. Crypto has strong trends that last days or weeks. Perfect for swing traders who want to catch major moves without constant watching.
Winner? Both work well, but swing trading crypto is less exhausting since you don’t need to monitor 24/7.
Forex Day Trading vs Swing Trading
Forex is the currency market. It’s also open almost 24/5.
Day Trading Forex: Very popular. Forex moves fast during market sessions. Day traders love the quick action.
Swing Trading Forex: Also works great. Currency trends can last weeks. Swing traders can capture these longer movements.
Winner? Day trading is slightly more popular in forex, but both styles succeed.
Stocks: Which Style Works Better?
Stock markets have set hours (like 9:30 AM to 4 PM in the US).
Day Trading Stocks: Perfect for day trading since markets close daily. You’re forced to exit positions, which matches day trading perfectly.
Swing Trading Stocks: Excellent for stocks! Many stocks trend for days or weeks. Earnings reports and news create great swing opportunities.
Winner? Swing trading is often easier for stock beginners since you can research companies properly.
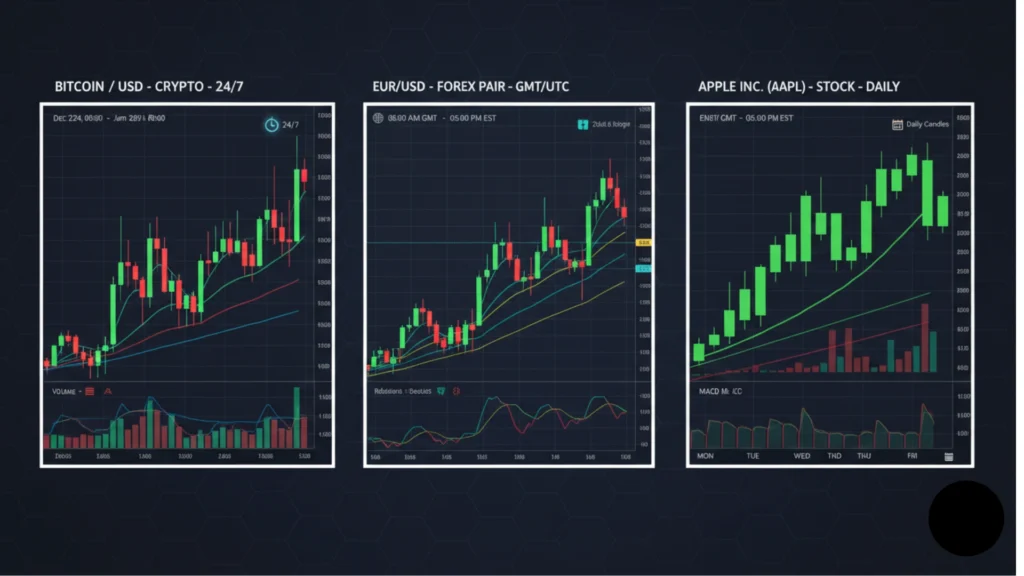
Technology & Tools Used in Trading
Modern trading needs technology. Let’s understand the tools simply.
Trading Platforms Explained Simply
A trading platform is like a special app where you buy and sell. Think of it as a shopping app, but for trading!
Popular platforms include:
- Robinhood (very beginner-friendly)
- TD Ameritrade (powerful tools)
- E*TRADE (good for learning)
- Interactive Brokers (for serious traders)
You choose a platform, add money, and start trading. Simple!
Tools Day Traders Use
Day traders need:
- Real-time charts (show prices every second)
- Level 2 data (shows who’s buying and selling)
- News feeds (instant market news)
- Scanners (find trading opportunities fast)
- Multiple monitors (see everything at once)
These tools help day traders make split-second decisions.
Tools Swing Traders Use
Swing traders need:
- Daily/weekly charts (longer timeframes)
- Basic technical indicators (moving averages, RSI)
- Stock screeners (find good swing opportunities)
- Alert systems (notify when prices hit targets)
- One good computer (fancy setups not required)
Swing trading tools are simpler and cheaper than day trading tools.

Risks in Day Trading and Swing Trading (And How to Reduce Them)
All trading has risks. Let’s understand them and learn how to stay safe.
Common Risks in Day Trading
Overtrading: Making too many trades loses money in fees.
Emotional Decisions: Panic buying or selling destroys accounts.
Leverage Risks: Borrowing money to trade can multiply losses.
Lack of Discipline: Breaking your trading rules leads to disaster.
Common Risks in Swing Trading
Overnight Gaps: Prices can jump or drop while markets are closed.
Holding Losers Too Long: Hoping bad trades recover can be costly.
Missing Exits: Not checking trades regularly can miss exit points.
Event Risk: Unexpected news can hurt positions held multiple days.
Risk Management Made Easy (Stop Loss, Position Size)
How do you protect yourself?
Use Stop Losses: Automatically sell if price drops to a certain level. This limits losses.
Position Sizing: Never risk more than 1-2% of your account on one trade. If you have $1,000, risk only $10-$20 per trade.
Diversify: Don’t put all money in one trade or one stock.
Have a Plan: Decide entry, exit, and stop loss before entering trades.
Start Small: Practice with small amounts before risking big money.
Risk management is more important than making profits. Protect your money first!
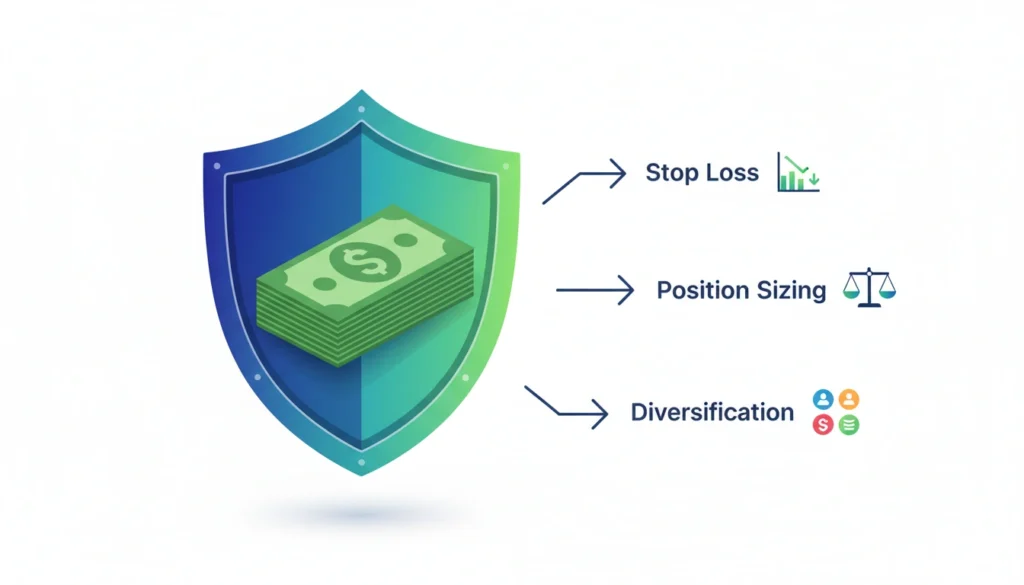
Which One Is Better for Beginners?
The million-dollar question! Which trading style should beginners choose?
The truth? It depends on YOUR life, personality, and goals.
When Day Trading Is a Better Choice
Choose day trading if you:
- Have 6-8 hours daily to dedicate to trading
- Love fast-paced, exciting environments
- Can handle high stress and pressure
- Have at least $25,000 to start (for US stocks)
- Want quick feedback on your trades
- Can make fast decisions without panic
Day trading suits active, focused people who can treat it like a full-time job.
When Swing Trading Is a Better Choice
Choose swing trading if you:
- Have a full-time job or business
- Prefer lower stress and more thinking time
- Can be patient and wait days for results
- Want to start with smaller capital ($500-$1,000)
- Like analyzing markets deeply
- Want trading to fit around your life, not control it
Swing trading suits busy people who want trading as a side income or part-time pursuit.
Can Beginners Do Both?
Yes! Many traders start with swing trading to learn the basics without stress. Once comfortable, some add day trading.
You can also do both simultaneously – swing trade long-term positions while day trading with a small portion of your account.
But when starting, focus on one style. Master it before mixing styles.
Beginner Recommendation: Most experts suggest swing trading for beginners. It’s less stressful, requires less capital, and allows time to learn without pressure.

Swing Trading vs Day Trading: Real-Life Example
Let’s see both styles in action with a simple example!
The Stock: Imagine a stock called XYZ trading at $50.
Day Trader’s Approach: Monday morning, the day trader sees XYZ at $50. Good news comes out. The price jumps to $51 in 30 minutes. The day trader buys at $50.20 and sells at $50.80. Profit: $0.60 per share. With 100 shares, that’s $60 profit in 30 minutes! The trade is done before lunch.
Swing Trader’s Approach: The same Monday, the swing trader analyzes XYZ. The stock has been trending up for weeks. The trader buys at $50 and holds. Over the next two weeks, XYZ climbs to $55. The swing trader sells at $55. Profit: $5 per share. With 100 shares, that’s $500 profit in two weeks!
The Difference: The day trader made $60 in 30 minutes but needed to watch screens constantly. The swing trader made $500 in two weeks while checking once or twice daily.
Day trading: Small gains, frequent trades, constant attention. Swing trading: Bigger gains, fewer trades, minimal daily time.
Both made money. Different paths, different lifestyles!
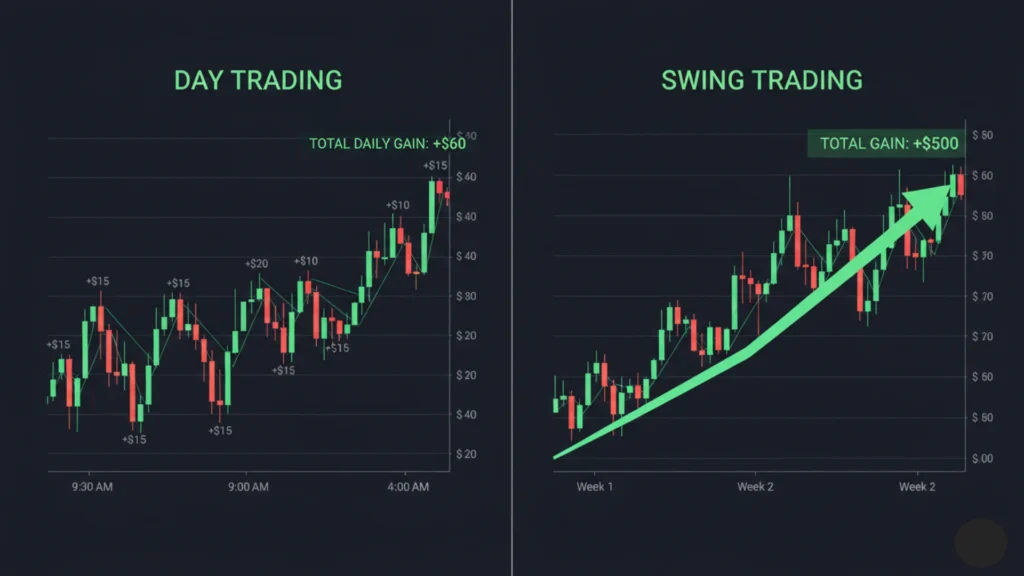
Profit Expectations: What’s Realistic?
Social media shows traders making millions. Is that real? Let’s talk truth.
Day Trading Profits: Realistic expectations: 1-3% monthly return for consistent traders. A $10,000 account might make $100-$300 monthly after fees. Top professional day traders might achieve 5-10% monthly, but they’re rare.
Many beginners lose money their first year. Day trading is hard!
Swing Trading Profits: Realistic expectations: 5-15% monthly return for good swing traders. A $10,000 account might make $500-$1,500 monthly. The returns are larger per trade but come less frequently.
The Truth: Most beginners don’t make money immediately. It takes months or years to become consistently profitable. Anyone promising “get rich quick” is lying.
Trading is a skill. Like learning piano or cooking, you get better with practice and time.
Avoid These Profit Myths:
- “Turn $100 into $10,000 in one month!” – Not realistic
- “I made $50,000 last week!” – Probably showing one lucky trade, not consistent results
- “My secret Asian strategy wins 95% of trades!” – No strategy wins that often
Focus on consistent small wins, not home runs. Protect your capital. Learn continuously. That’s real trading success.

Psychology of Trading (Simple Explanation)
Trading isn’t just about charts and numbers. Your mind matters most!
Fear: When trades go wrong, fear makes you sell too early or freeze completely. Fear is normal but must be controlled.
Greed: When trades go well, greed makes you hold too long or risk too much. Greed destroys accounts.
Discipline: This means following your plan even when emotions scream at you. Discipline separates winners from losers.
Patience: Especially for swing traders, patience means waiting for the right setup. Don’t force trades.
Emotional Control: Learn to stay calm whether winning or losing. Trading is a marathon, not one race.
Day Trading Psychology: The constant decision-making exhausts your brain. Day traders need strong mental endurance and quick emotional recovery.
Swing Trading Psychology: Holding overnight requires trust in your analysis. You must resist constantly checking prices and panicking over normal fluctuations.
Mental Tricks That Help:
- Trade small enough that losses don’t scare you
- Keep a trading journal to learn from mistakes
- Take breaks after big wins or losses
- Never trade when angry, tired, or emotional
- Celebrate small wins, learn from small losses
Your psychology determines your success more than any strategy. Work on your mind!

Common Beginner Mistakes to Avoid
Learn from others’ mistakes! Here are the biggest errors beginners make.
Day Trading Mistakes
Overtrading: Making too many trades because you’re bored or chasing losses. Quality over quantity!
No Trading Plan: Jumping into trades without clear entry and exit rules. Always have a plan.
Ignoring Fees: Commission and fees add up fast with many trades. Calculate costs!
Revenge Trading: Losing money, then immediately trading again to “get it back.” This usually makes losses worse.
Trading Without Practice: Starting with real money before practicing on demo accounts. Practice first!
Swing Trading Mistakes
Impatience: Closing winning trades too early because you can’t wait. Let winners run!
Not Setting Stop Losses: Hoping losing trades will recover. Always protect yourself.
Ignoring News: Major news can move swing trades significantly. Stay informed about your positions.
Checking Too Often: Looking at trades every hour defeats the purpose of swing trading. Check once or twice daily.
Poor Entry Timing: Entering trades randomly instead of waiting for good setups. Patience pays!
General Mistakes for Both:
- Trading with money you can’t afford to lose
- Not keeping a trading journal
- Listening to random internet “gurus”
- Giving up after first losses
- Not continuously learning
Avoid these mistakes and you’re ahead of 90% of beginners!

Frequently Asked Questions (People Also Ask)
Is day trading riskier than swing trading?
Yes, generally. Day trading is riskier because you make more trades, face more fees, and need quick decisions that can go wrong. Swing trading gives you time to think and research, reducing emotional mistakes. However, swing trading has overnight risk – news can gap prices while you sleep.
Is swing trading more profitable than day trading?
Not necessarily more profitable, but potentially more consistent for beginners. Swing traders aim for bigger gains per trade but trade less often. Day traders make smaller gains but trade more frequently. Your profitability depends on your skill, discipline, and which style fits your personality. Neither is “more profitable” automatically.
How much money do I need to start?
For day trading US stocks, you legally need $25,000 minimum (Pattern Day Trader rule). For swing trading, you can start with $500-$1,000, though $3,000-$5,000 gives you better flexibility. For crypto and forex, some brokers allow starting with even $100, but more capital gives better risk management options.
Can I switch from day trading to swing trading?
Absolutely! Many traders start with one style and switch later. You can also do both simultaneously. Some traders day trade in the mornings and swing trade longer positions. Start with one to learn properly, then experiment. Your trading style can evolve as your life, goals, and skills change.
Key Takeaways (Final Summary)
Let’s wrap up everything simply:
Day Trading:
- Fast-paced, exciting, but very demanding
- Requires full-time commitment and focus
- Higher stress, higher time requirement
- Can start seeing results daily
- Best for active, focused individuals with significant capital
Swing Trading:
- Slower, calmer, fits around your life
- Part-time friendly, lower stress
- Requires patience but smaller time commitment
- Results come over days or weeks
- Best for busy people or beginners
Key Differences: Time commitment, trade duration, stress levels, capital requirements, and lifestyle fit are the main differences between Swing Trading vs Day Trading
Which Should You Choose? Ask yourself:
- How much time do you have?
- How much stress can you handle?
- How much capital can you start with?
- Do you want trading as a full-time job or side income?
Your answers point to your best choice.
Final Advice: Start small, practice first, learn continuously, manage risk obsessively, and be patient with yourself. Trading success takes time. Whether you choose day trading or swing trading, respect the markets, protect your capital, and never stop learning.
Both styles can succeed. The best trading style is the one that fits YOUR life!

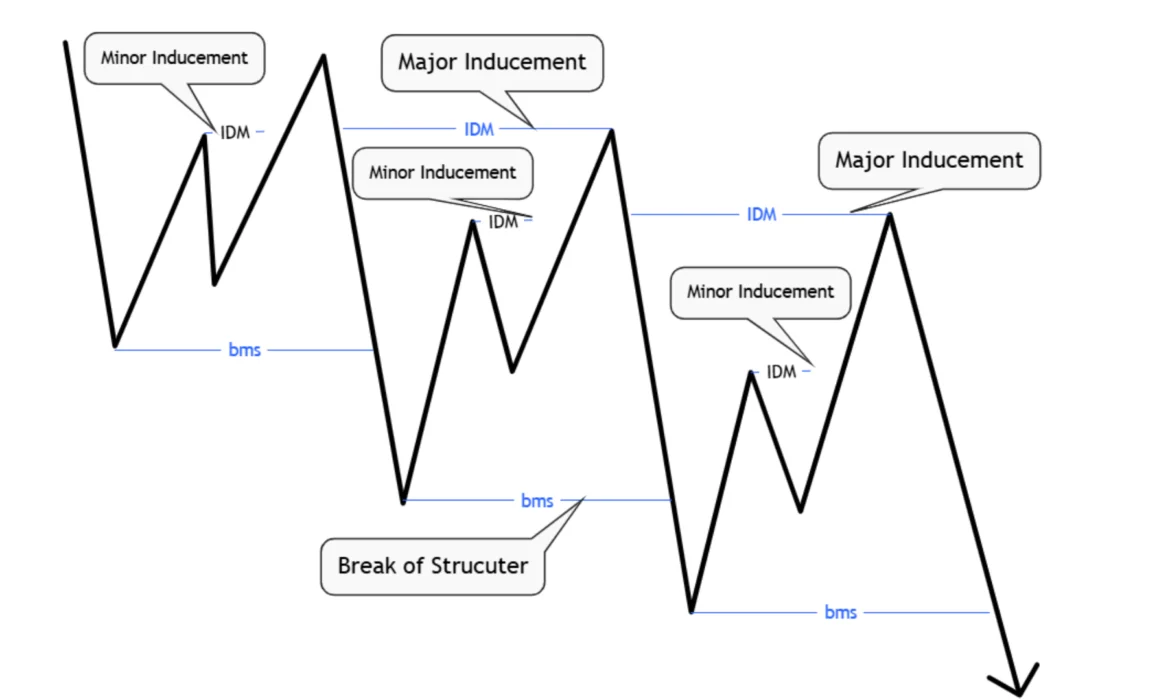
Major and Minor Inducement: The Ultimate Step-by-Step Guide
Markets are not random. They move with purpose. And one of the biggest secrets behind price movement is something called inducement. Whether you are new to trading or have been at it for a while, understanding major inducement and minor inducement can completely change how you read charts.
Let’s break it all down in simple, easy-to-follow language.
What is Major Inducement? (Simple Explanation)
Major inducement is when the market creates a fake move on a bigger timeframe — like the daily, weekly, or 4-hour chart. This move is designed to attract large traders, hedge funds, and institutions into bad positions.
Think of it like a big fish trap. The market shows what looks like a great opportunity. Traders jump in. Then the price reverses hard, grabbing all their stop losses.
Major inducement works because big traders and institutions need large amounts of money on the other side of their trades. To get that, they have to trick people into entering the wrong direction first. This is the heart of the inducement theory — price moves are engineered, not random.
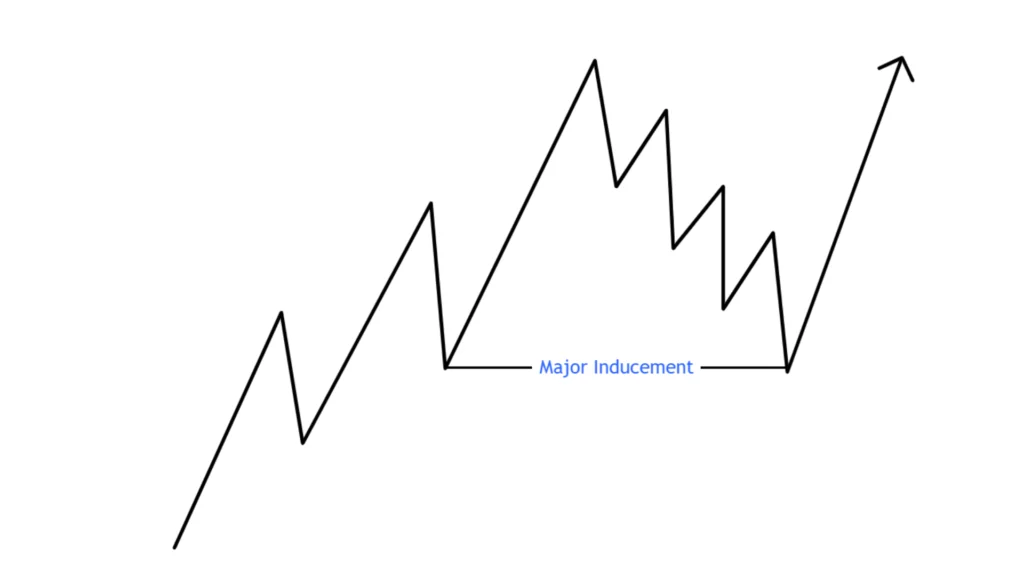
What is Minor Inducement? (Simple Explanation)
Minor inducement works the same way but on smaller timeframes — like the 15-minute, 5-minute, or 1-hour chart. It affects short-term traders and scalpers.
The minor inducement definition is simple: it is a small fake move that grabs liquidity before price continues in the real direction. It is a mini trap inside a bigger picture.
For example, price might dip slightly below a recent low on the 15-minute chart, grab stop losses from short-term buyers, and then shoot back up. That little dip? That is minor inducement.
Minor incentives in motivation terms are small nudges. In trading, minor inducement is a small nudge that tricks impatient traders.
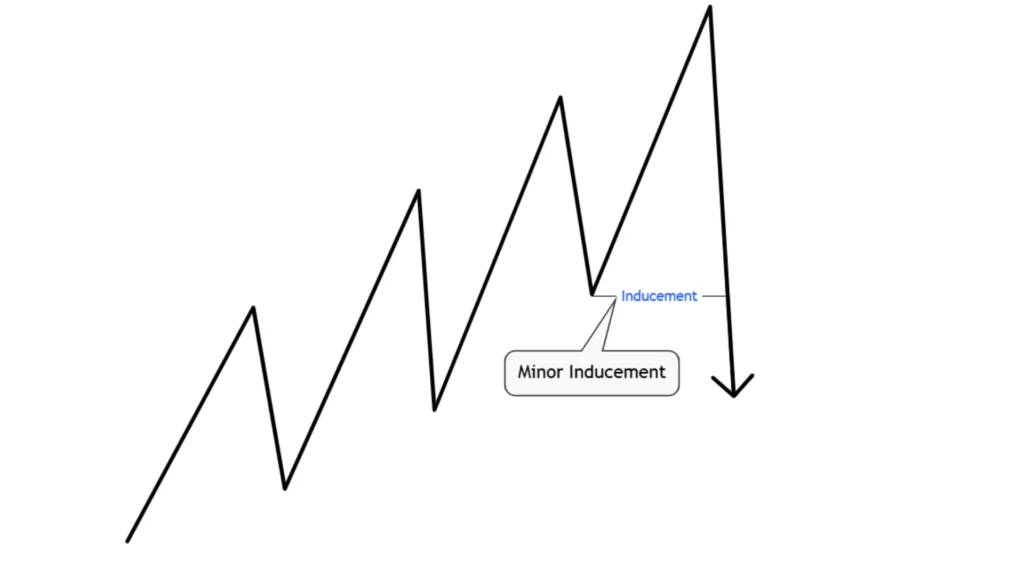
Major vs Minor Inducement: Key Differences Table
Here is a simple comparison so you can quickly spot the difference between major and minor inducement.
| Feature | Major Inducement | Minor Inducement |
| Timeframe | Daily, Weekly, 4H | 15M, 5M, 1H |
| Who it traps | Big traders, institutions | Retail scalpers |
| Size of move | Large price swing | Small price wiggle |
| Impact | Trend reversal or major shift | Short-term move |
| Risk level | Higher | Lower |
| Confirmation needed | Strong | Quick |
The difference between major and minor inducement is mainly about scale and timeframe. Same concept, different size.
Why Markets Create Inducement (The Real Reason)
Markets need liquidity to move. Without buyers and sellers on both sides, big institutions cannot fill their massive orders.
So what do they do? They engineer inducement.
This is the legal inducement concept in trading — using price action to attract traders into positions, then reversing against them. When traders place stop losses, those stops become liquidity. Institutions hunt that liquidity to fill their own trades.
This is also why the inducement and motivation relationship matters. Traders are motivated by what they see on the chart. The market uses that motivation against them.
External inducement motivation plays a huge role here. A breakout looks exciting. A new high looks bullish. But many times, these moves are traps.

How Timeframes Connect to Major and Minor Inducement
The timeframe rule is simple: higher timeframe equals major inducement, lower timeframe equals minor inducement.
Here is how it works:
- Weekly chart → major inducement signals
- Daily chart → major inducement confirmation
- 4H chart → transition zone
- 1H chart → minor inducement setup
- 15M / 5M → minor inducement entry
When you understand this structure, you stop trading randomly. You start seeing the market like a map. Major vs minor incentives in timeframes help you plan smarter trades.
Step-by-Step: How to Identify Major Inducement on a Chart
Follow these steps to spot major inducement on higher timeframes.
Step 1: Open a daily or weekly chart.
Step 2: Find a clear swing high or swing low.
Step 3: Look for price sweeping past that level briefly.
Step 4: Watch for a strong rejection candle after the sweep.
Step 5: Check if price then moves in the opposite direction.
Step 6: Confirm with structure — is there a break of structure after the sweep?
This is how behavioral inducement factors show up on charts. The sweep is the smart money trap. The reversal is the real move.
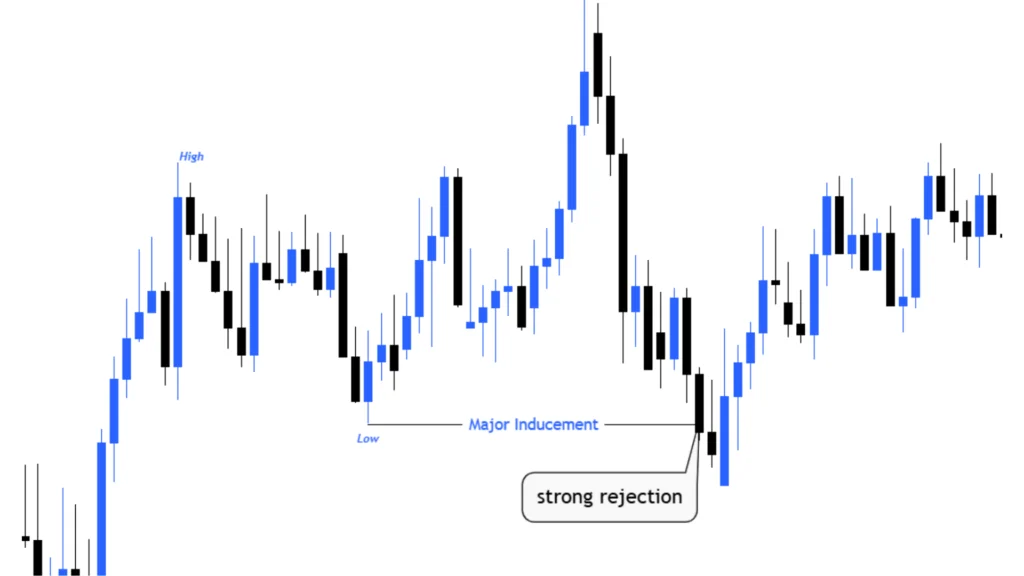
Step-by-Step: How to Identify Minor Inducement on a Chart
Now zoom into a smaller timeframe like 15 minutes or 1 hour.
Step 1: Identify the major inducement direction first.
Step 2: Drop to the 15M or 1H chart.
Step 3: Find a recent short-term high or low.
Step 4: Watch if price sweeps it briefly.
Step 5: Look for a fast reversal candle.
Step 6: Enter in the direction of the major timeframe trend.
Minor rewards vs major rewards in trading: major gives you the direction, minor gives you the entry.
How Major and Minor Inducement Work Together
This is where it gets powerful. When major and minor inducement align, you have a high-probability trade.
Here is the idea: major inducement tells you the direction. Minor inducement gives you the perfect entry point. Together, they act like a zoom lens — you see the big picture and the fine detail at the same time.
Performance inducement methods in trading always use this alignment strategy. Top traders never trade one timeframe alone. They use the higher timeframe for context and the lower timeframe for precision.
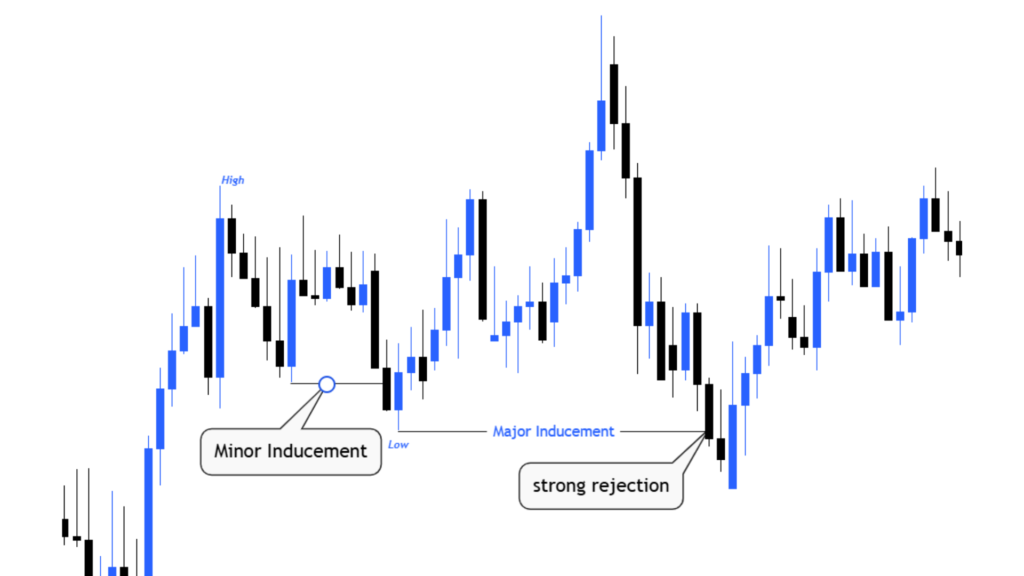
Best Entry Strategy Using Major + Minor Inducement
Here is a clean strategy using both types of inducement.
Step 1 — Find Major Inducement: Look at the daily chart. Is there a liquidity grab above or below a key level?
Step 2 — Confirm Direction: After the sweep, does price break structure in the opposite direction?
Step 3 — Drop to Lower Timeframe: Move to the 15M or 1H chart. Look for minor inducement forming.
Step 4 — Wait for Minor Sweep: Price should take out a short-term high or low.
Step 5 — Enter After Reversal: Once the minor sweep happens and price shows reversal, enter the trade.
This is one of the strongest sales inducement techniques adapted for trading — align the big picture with the small picture before committing.
Trading Checklist Before Entering a Trade
Before every trade, run through this quick checklist.
- ✅ Is the major trend clear on the daily chart?
- ✅ Has major inducement occurred?
- ✅ Has price broken structure after the major sweep?
- ✅ Is there minor inducement visible on the lower timeframe?
- ✅ Does the entry align with the major direction?
- ✅ Is there a clear stop loss level?
- ✅ Is the risk-to-reward ratio at least 1:2?
Inducement in decision making becomes easier when you have a checklist to follow. It removes emotion.
Risk Management When Trading Inducement
Even the best setup can lose. Risk management keeps you safe.
Stop Loss: Place it just beyond the inducement level — past the sweep point. This protects you if the setup fails.
Position Size: Risk only 1-2% of your account per trade. Never go all in.
Take Profit: Aim for the next key level on the major timeframe. Use a minimum 1:2 reward-to-risk ratio.
Emotional Control: Stick to your plan. Negative inducement meaning in behavior terms is when fear makes you exit too early or greed makes you hold too long.
Common Mistakes with Major Inducement
Avoid these errors on higher timeframes.
Entering too early: Waiting for confirmation is key. Do not jump in at the first sign of a sweep.
Wrong timeframe: Major inducement on a 1H chart is not the same as on a daily chart. Always check context.
Ignoring structure: A sweep without a break of structure is just noise. Structure is your confirmation signal.
Overconfidence: Even major inducement setups fail. Never skip your risk rules.
Common Mistakes with Minor Inducement
These errors are common on smaller timeframes.
Overtrading: Every small wiggle is not minor inducement. Be selective.
Chasing price: If you missed the entry, let it go. Chasing leads to bad fills and higher risk.
Misreading liquidity: Not every level has meaningful liquidity. Focus on levels where many stops are likely sitting.
Ignoring the bigger picture: Minor inducement only makes sense when it aligns with the major direction.
Real Trade Examples: Major and Minor Inducement in Action
Let’s walk through a full trade example.
Setup: EUR/USD on the daily chart shows a clean swing high. Price sweeps above it briefly, then closes back below. This is major inducement — a liquidity grab above old highs.
Confirmation: On the 4H chart, price breaks structure to the downside. Direction is now bearish.
Minor Inducement: On the 15M chart, price makes a small bounce, creating a short-term high. Then it sweeps that high briefly before reversing down again.
Entry: Short position entered after the minor sweep with stop above the sweep point.
Result: Price drops to the next major support level for a clean 1:3 reward.
This is reward-based inducement in action — patient, structured, and precise.
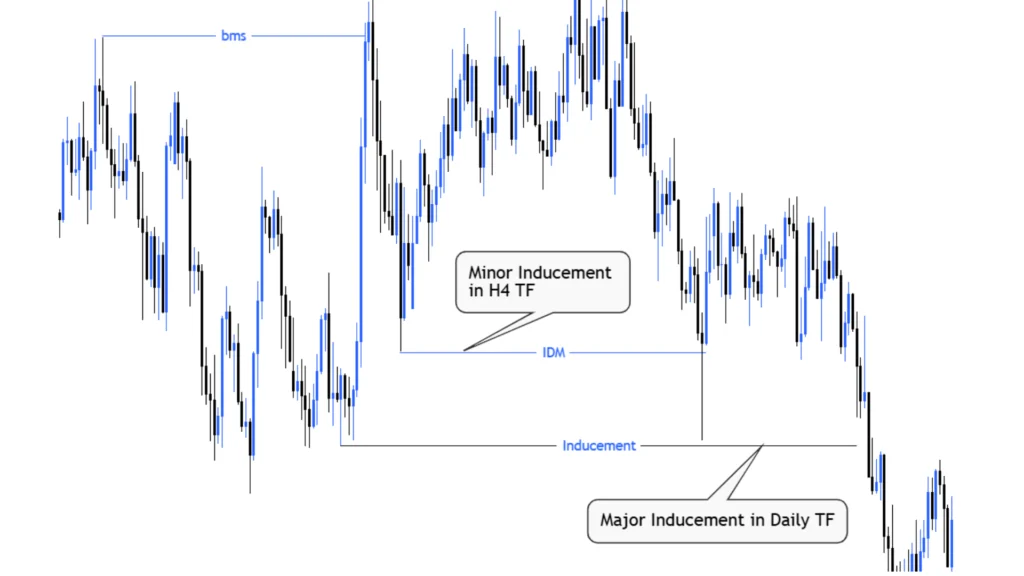
Psychology Behind Inducement (Why Traders Get Trapped)
Inducement works because of human emotions — mainly fear, greed, and impatience.
When price breaks a high, greedy traders jump in expecting more upside. When price dips, fearful traders panic and sell. These emotional reactions create the liquidity that institutions need.
Inducement psychology theory teaches us that the market is designed to exploit the average trader’s emotions. The good news? Once you understand this, you stop being the victim and start being the observer.
Impatience is the biggest enemy. Traders see a move and feel they must act now. Slow down. Wait for confirmation. That pause is what separates good traders from trapped ones.
How to Practice and Improve Your Inducement Skills
Practice is everything. Here is how to get better fast.
Backtesting: Go back through historical charts and find examples of major and minor inducement. Mark them. Study what happened next.
Replay Tools: Use platforms like TradingView’s replay feature to simulate live trading without real money.
Journaling: Write down every trade. Note whether inducement was present, what type, and whether your entry aligned.
Screen Time: The more charts you study, the faster you will recognize patterns. Aim for 30-60 minutes of chart study daily.
Consumer purchase inducements work because of repetition — people buy what they see often. In trading, repetition of practice builds a sharper eye.
Simple Rules to Remember Major and Minor Inducement
Keep these rules on your desk.
- Major = higher timeframe, bigger trap, bigger move
- Minor = lower timeframe, smaller trap, entry signal
- Always confirm major direction before looking for minor entry
- Sweep + reversal = inducement signal
- No structure break = no trade
- Emotion = the enemy, patience = the weapon
These simple memory rules keep you grounded when the market gets confusing.
Final Strategy Framework (Easy System to Follow)
Here is your daily system in clean steps.
- Check daily chart — Is there a major inducement setup forming or already complete?
- Confirm direction — Did price break structure after the sweep?
- Drop to 1H or 15M — Look for minor inducement forming.
- Wait for the minor sweep — Be patient. Let price take the short-term level.
- Enter on reversal confirmation — A strong candle in the right direction is your green light.
- Set stop and target — Protect your trade and aim for at least 1:2 reward.
- Review the trade — Win or lose, write it down and learn.
This framework applies the best of inducement in marketing strategies and economic inducement policies to real trading decisions. It is simple, repeatable, and effective.
The impact of inducements on behavior is powerful — whether in markets, life, or business. Once you understand that price is engineered to trap you, you stop getting trapped. That shift in thinking is worth more than any single trade.
Start slow. Practice daily. Trust the process.
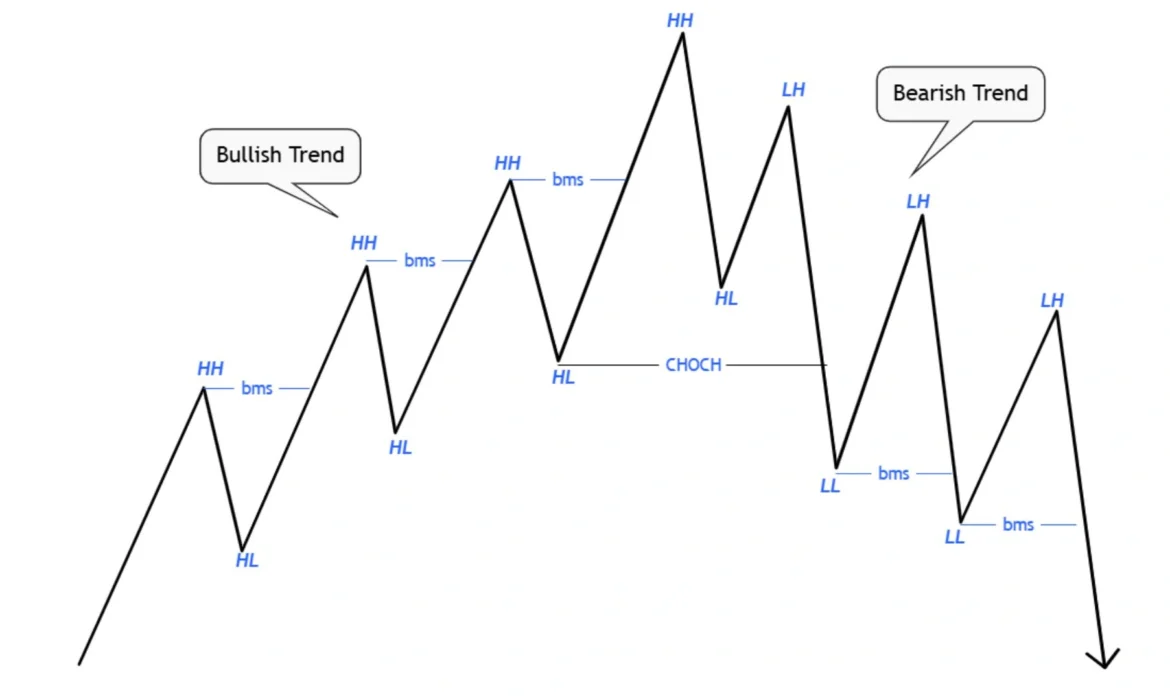
Change of Character in Forex Trading: Essential Blueprint for Explosive Profits
Imagine you’re watching a game where one team is winning for a long time. Suddenly, the other team starts scoring and takes control. That’s exactly what happens in forex trading when we see a change of character.
Change of character in forex trading, or Change of Character, is like a warning sign that tells traders the market might be changing direction.
When buyers have been pushing the price up for a while, and suddenly sellers start taking control, that’s a change of character.
Traders love this concept because it helps them spot trend changes early, before most people notice.
Instead of waiting until the trend has completely reversed, smart traders use CHoCH to get in at better prices and avoid getting trapped in old trends that are ending.
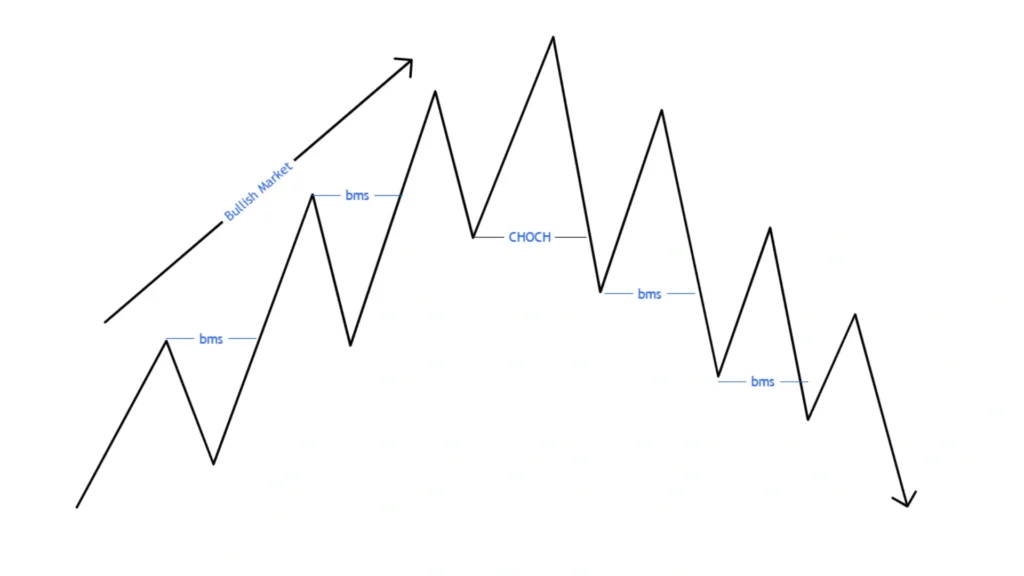
How Price Moves in the Forex Market (Very Simple)
Think of price movement like a staircase. When you walk up stairs, you go up, then maybe rest a bit, then up again. That’s how price moves when it’s going upward in forex.
Every time price goes up and makes a new high point, then pulls back a little, then goes up again to make an even higher point, we call this an uptrend.
The high points are called “highs” and the low points where it rests are called “lows.” In an uptrend, each new high is higher than the last one, and each new low is also higher than the previous low.
It’s like climbing stairs where each step is a bit higher.
Now, a downtrend is the opposite. It’s like walking down stairs. Price makes a low point, bounces up a little, then makes an even lower low point.
Each high is lower than the previous high, and each low is lower than the previous low.
Understanding this simple staircase pattern is super important because change of character happens when these stairs start going the opposite direction.
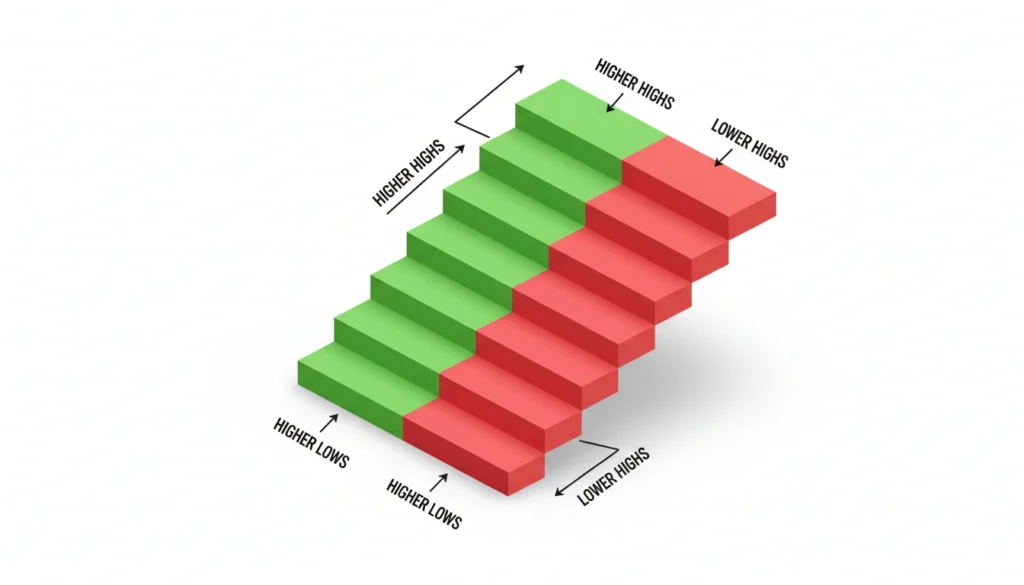
What Is Market Structure in Forex?
Market structure is simply the pattern that price makes as it moves up and down. Think of it like footprints in the sand. When someone walks, their footprints show which direction they went.
In forex, the market leaves “footprints” too. These footprints are the highs and lows we talked about earlier.
When we connect these highs and lows, we can see if the market is walking upward (uptrend), walking downward (downtrend), or just wandering around without clear direction (ranging).
Before you can understand change of character forex concepts, you need to see these footprints clearly. Market structure change forex happens when these footprints suddenly change direction.
It’s like someone walking north who suddenly turns around and starts walking south. That change in the footprint pattern is what we’re looking for.
What Is Change of Character (CHoCH) in Forex Trading?
A change of character in forex trading is the exact moment when the market structure breaks in a way that suggests the trend might be reversing. Let me make this super simple.
Imagine price has been making higher highs and higher lows (going up like stairs). A CHoCH happens when price breaks below a previous higher low.
This is important because it means the upward staircase pattern is broken. The market’s “character” has changed.
It’s no longer behaving like a healthy uptrend. Similarly, in a downtrend, CHoCH occurs when price breaks above a previous lower high.
The forex change of character strategy is all about catching this exact moment when the old trend’s structure breaks.
This gives traders an early warning that the trend might be changing direction, allowing them to prepare for new opportunities or protect their existing trades.
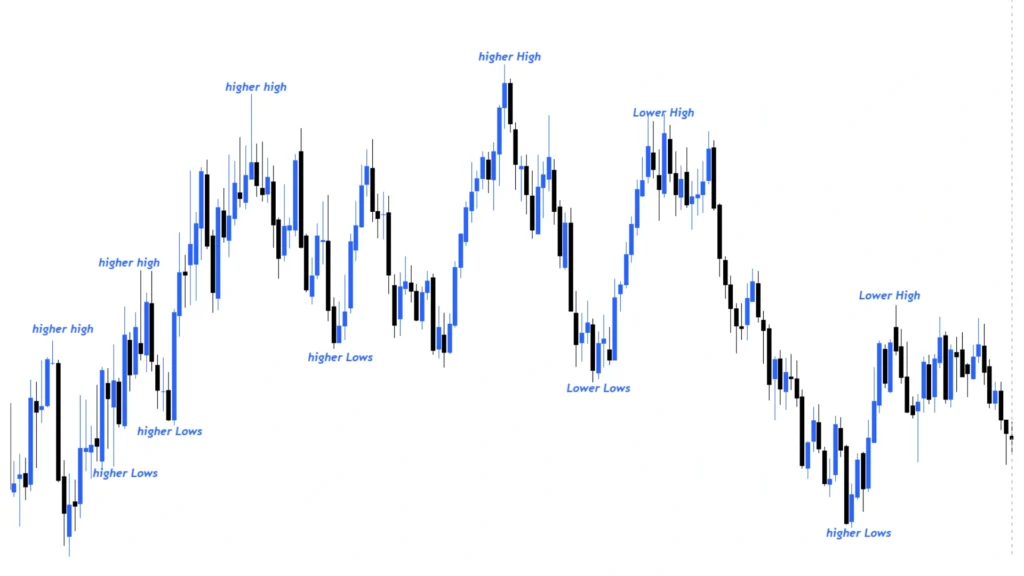
Why Is It Called a Change of Character?
Think about a person’s character or personality. When someone is usually happy and suddenly becomes sad, we notice the change in their character or mood, right?
The market has a character too.
When buyers are in control, the market’s character is bullish—it wants to go up. It acts happy and energetic, making higher highs and higher lows.
When sellers are in control, the market’s character is bearish—it wants to go down. It acts heavy and weak, making lower lows and lower highs.
A change of character happens when this personality shift occurs. The market was acting like buyers were in charge, but suddenly it starts acting like sellers are taking over. Or vice versa.
This change in behavior, this shift from one personality to another, is why we call it a “change of character.” It’s the market telling us, “Hey, I’m not the same anymore. I’m changing my behavior.”
The Theory Behind Change of Character (Smart Money View)
Big banks, institutions, and professional traders (we call them “smart money”) move huge amounts of money in the forex market.
They can’t just buy or sell whenever they want because their orders are so big.
Here’s what they do: First, they let the regular traders (retail traders like beginners) think the trend is continuing. While everyone is buying in an uptrend, smart money is actually preparing to sell.
They need all those buyers so they have someone to sell to. Once enough regular traders are trapped in the wrong direction, smart money makes their move.
This creates the smart money change of character. The price suddenly breaks the structure because big players just entered in the opposite direction with massive orders.
Understanding this helps explain why change of character forex setups work. We’re essentially watching for signs that institutional market structure forex is shifting, that the big players are changing their position.

Break of Structure (BoS) Explained Simply
While CHoCH signals a possible reversal, Break of Structure (BoS) signals continuation. Let me explain the difference clearly.
When you’re in an uptrend and price keeps making higher highs, each time it makes a new higher high, that’s a Break of Structure upward.
It means the trend is continuing strong. The market is saying, “I’m still going up, everything is fine.” In a downtrend, when price makes a new lower low, that’s a BoS downward, confirming the downtrend is still in control.
Think of BoS like a green light that says “keep going, the trend is healthy.” The market structure is breaking in the direction of the existing trend, which is good news if you’re already in that trade.
Understanding BoS helps you stay in good trades longer instead of exiting too early.
Change of Character vs Break of Structure (CHoCH vs BoS)
This is where many traders get confused, so let’s make it crystal clear with a simple rule.
CHoCH vs break of structure comes down to one thing: direction.
CHoCH breaks structure AGAINST the current trend (possible reversal), while BoS breaks structure WITH the current trend (continuation).
In an uptrend, if price breaks below the previous higher low, that’s CHoCH (warning sign). If price breaks above the previous higher high, that’s BoS (continuation signal).
In a downtrend, breaking above the previous lower high is CHoCH, while breaking below the previous lower low is BoS.
Remember this: BoS = trend continues (good), CHoCH = trend might reverse (warning). This simple distinction is crucial for the change of character trading concept and knowing whether to stay in trades or prepare for reversals.
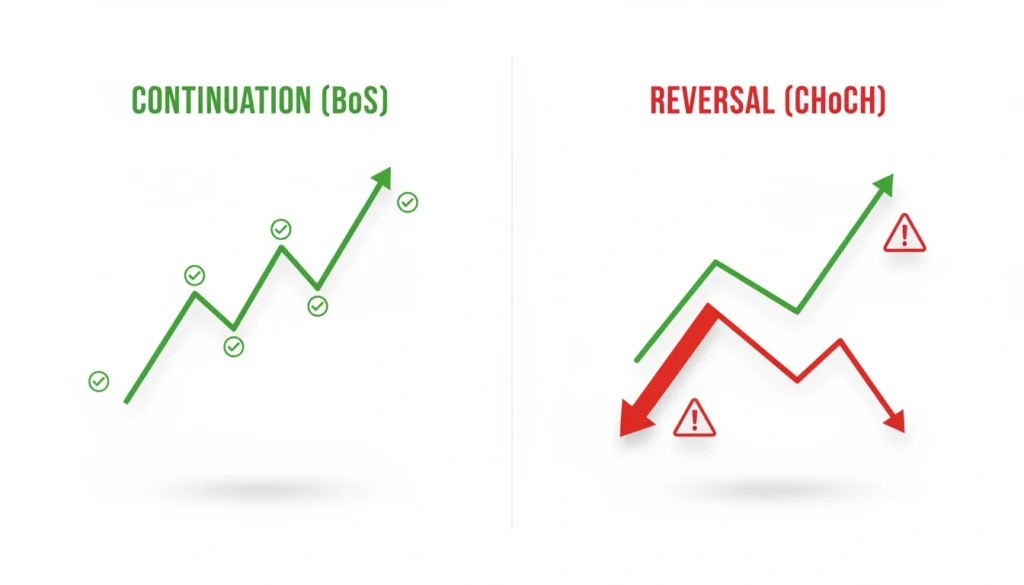
Change of Character vs Market Structure Shift (MSS)
Many traders use CHoCH and MSS (Market Structure Shift) interchangeably, but technically they’re describing the same thing from different perspectives.
Some traders say “change of character” while others say “market structure shift.” Both terms mean the market structure has broken in a way that suggests a possible reversal.
The confusion happens because different educators use different names for the same concept. In practical trading, what matters is recognizing when the structure breaks against the trend.
Whether you call it CHoCH or MSS doesn’t change what you’re looking for on the chart. Don’t let terminology confuse you.
Focus on understanding the concept: when an uptrend breaks below a previous low, or when a downtrend breaks above a previous high, that’s your signal.
The name is less important than recognizing the pattern and what it means for your trading decisions.
Internal vs External Highs and Lows (Important Concept)
Not all highs and lows are created equal, and this is a game-changer for improving your change of character accuracy.
External highs and lows are the obvious ones—the big turning points that are clearly visible. Internal highs and lows are smaller swings that happen inside the bigger moves.
Think of external points as the big peaks and valleys you’d see from far away, and internal points as the smaller bumps you’d only notice if you looked closely.
For reliable CHoCH signals, you should focus on external structure, not internal. If you mark every tiny movement as a high or low, you’ll see fake CHoCH signals everywhere and get confused.
Experienced traders learn to filter out the noise and focus on significant structure points. This is why the same chart can look completely different to a beginner versus a professional—they’re seeing different structural levels.
Types of Change of Character in Forex Trading
Bullish Change of Character
A bullish change of character happens when sellers have been in control, pushing price down, but suddenly lose their power and buyers take over.
Picture a downtrend where price is making lower lows and lower highs like steps going downward. Everything looks bearish.
Then something happens: price breaks above a previous lower high. This break is important because it means the downward staircase is broken.
Sellers tried to push price down again but couldn’t. Buyers stepped in with enough force to break the structure. This is your bullish change of character signal.
It doesn’t guarantee price will go up forever, but it’s a strong warning that the downtrend might be ending and an uptrend might be starting.
Traders who recognize this early can position themselves for the potential upward move before most people notice the trend change.
Bearish Change of Character
A bearish change of character is the opposite. It happens when buyers have been in control, but suddenly sellers take over and break the upward structure.
Imagine an uptrend with price making beautiful higher highs and higher lows, climbing like stairs. Everyone is excited, thinking the uptrend will continue forever.
Then price breaks below a previous higher low. This is significant because the upward staircase pattern just broke. Buyers tried to keep pushing up but failed.
Sellers came in strong enough to break the structure. This bearish CHoCH warns that the uptrend might be ending.
Smart traders use this signal to either take profits on their long trades, avoid entering new long positions, or prepare for potential short (sell) opportunities.
Recognizing bearish change of character early helps protect your account from being caught in a reversing trend.
Fake Change of Character
Not every CHoCH leads to a real trend reversal, and this is where many traders lose money. Fake change of character setups are SMC traps.
Sometimes price will break structure, make everyone think the trend is reversing, then quickly return to the original trend direction.
This happens especially in ranging markets or when big players are manipulating price to trigger stop losses.
A fake CHoCH might break a low or high by just a few pips, grab liquidity (stop hunters at work), then reverse immediately.
This is why confirmation is so important. Just seeing a structure break isn’t enough. You need additional evidence like strong momentum, order block reactions, or higher timeframe alignment.
Traders who jump into every CHoCH without confirmation get trapped repeatedly. Patience and waiting for proper validation separate successful traders from those who keep losing on false signals.

How to Identify a Change of Character on a Price Chart
Let me give you a simple step-by-step process to spot CHoCH visually on any chart, even if you’re a complete beginner.
First, zoom out and identify the current trend. Is price making higher highs and higher lows (uptrend) or lower highs and lower lows (downtrend)? Second, mark the most recent significant high and low points.
Don’t mark every tiny movement—focus on the obvious turning points. Third, watch what price does next. In an uptrend, you’re watching to see if price breaks below the most recent higher low.
In a downtrend, you’re watching to see if price breaks above the most recent lower high. Fourth, when that break happens, mark it as a potential CHoCH.
Draw a horizontal line at that broken level so you can see it clearly. Finally, wait for price to close beyond that level, not just touch it briefly.
A proper break means the candle fully closes on the other side. This visual process, when practiced repeatedly, becomes automatic and helps you catch change of character in forex trading setups in real-time.
How to Confirm a Real CHoCH (Avoid Fake Signals)
Spotting a CHoCH is one thing; confirming it’s real and not a fake is what separates profitable traders from struggling ones.
Here’s your simple confirmation checklist: First, check if the CHoCH happened with strong momentum (big candles, not small hesitant ones).
Second, see if price pulled back to an order block or imbalance area and rejected from there—this shows institutional involvement.
Third, check the higher timeframe to ensure it agrees with your CHoCH signal; never trade against higher timeframe structure.
Fourth, wait for price to retest the broken level and hold—if it breaks back immediately, it’s likely fake.
Fifth, look for volume increase if you have volume data; real CHoCH usually comes with higher volume.
Not every CHoCH will show all these confirmations, but the more boxes you can check, the higher your probability of success. Patience in waiting for confirmation is the price you pay for avoiding false signals and protecting your capital.
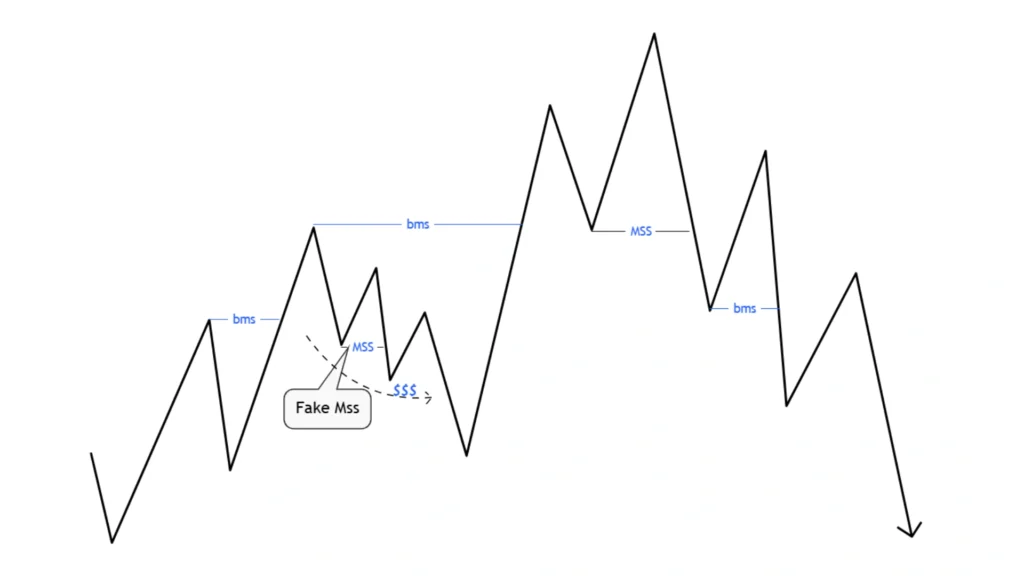
Best Timeframe for Change of Character in Forex Trading
Choosing the right timeframe can make the difference between consistent profits and constant confusion in your CHoCH trading.
For beginners, the 1-hour and 4-hour timeframes work best. Why? Because they filter out a lot of the noise and fake moves you see on smaller timeframes like 1-minute or 5-minute charts.
On the 1-hour chart, you can clearly see market structure without getting overwhelmed by every tiny price movement.
The 4-hour chart is even cleaner and shows stronger, more reliable structure. Day traders might use 15-minute or 30-minute charts, but they need more experience to filter fake signals.
Swing traders often use 4-hour and daily charts for the clearest picture. As you gain experience, you can adjust timeframes based on your trading style.
But if you’re just starting with change of character forex trading, stick to 1-hour or 4-hour charts until you consistently recognize valid structure and CHoCH setups.
Multi-Timeframe Importance of CHoCH
Understanding how different timeframes work together is like having a superpower in forex trading that most beginners don’t know about.
Here’s the secret: a CHoCH on a higher timeframe (like 4-hour or daily) is much more powerful than a CHoCH on a lower timeframe (like 5-minute).
Think of it like this: the daily chart is the boss, the 4-hour chart is the manager, and the 15-minute chart is the employee.
The employee can’t overrule the boss. If the daily chart shows a strong uptrend, a CHoCH on the 5-minute chart won’t change that—it might just be a small pullback.
But if the daily chart itself shows a CHoCH, that’s a major signal affecting all lower timeframes. Smart traders check higher timeframes first to see the big picture, then drop to lower timeframes to find precise entry points.
This multi-timeframe approach dramatically improves your success rate because you’re trading with the bigger forces, not against them.
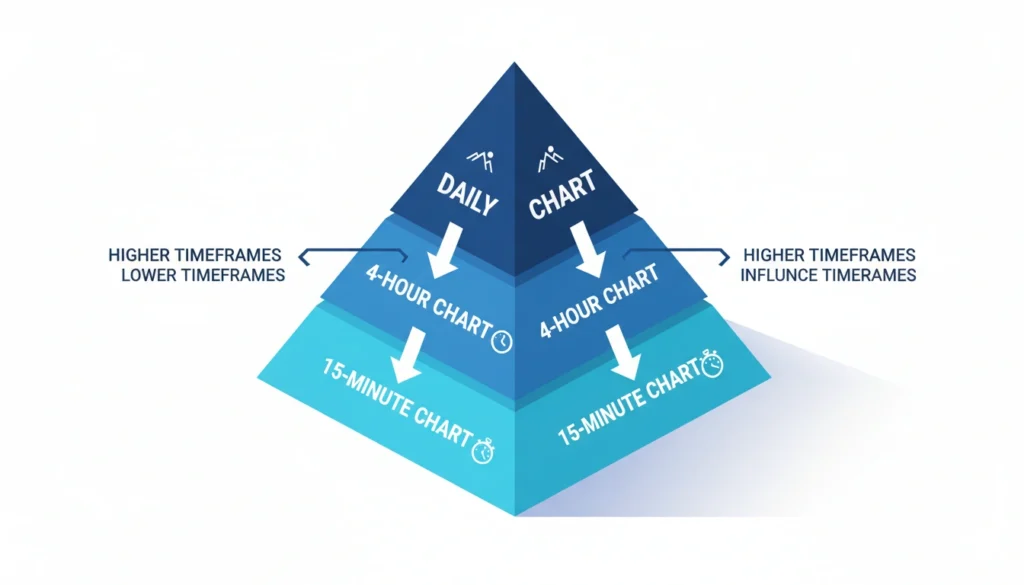
Change of Character and Liquidity (Explained Like You’re 7)
Liquidity is just a fancy word for “stop losses.” Let me explain why price often grabs liquidity before showing a real CHoCH.
Imagine you and your friends are playing hide and seek. Before you start seeking, you want to make sure everyone is hiding first, right?
The forex market does something similar. Before making a big move, it often “hunts” for stop losses. Many traders place their stop losses at obvious levels, like just below a recent low in an uptrend.
Smart money knows this. So before creating a real CHoCH and reversing the trend, they push price briefly to those stop loss levels, trigger everyone’s stops (grabbing liquidity), and THEN reverse in the intended direction.
This is why you often see price make a quick spike below a level, grab stops, then shoot back up for a real bullish CHoCH.
Understanding liquidity grab and change of character together helps you avoid getting stopped out right before the market goes in your anticipated direction.
Role of Order Blocks and Imbalances in CHoCH
After a CHoCH happens, price doesn’t just run forever. It usually comes back to test specific areas before continuing. These areas are called order blocks and imbalances.
An order block is where smart money placed their last orders before the trend changed. Think of it as the place where big players made their move.
After a CHoCH, price often pulls back to retest this area. Why? Because more smart money wants to enter at the same level, or early traders want to add to their positions.
An imbalance (or fair value gap) is an area where price moved so fast that it left a gap on the chart—not enough trading happened there.
Price often returns to “fill” these gaps. When you combine order block with change of character, you get high-probability entries.
The CHoCH tells you the trend might be reversing, and the order block or imbalance tells you where to enter with good risk-reward. This is how professional traders find precise entry points instead of just guessing.
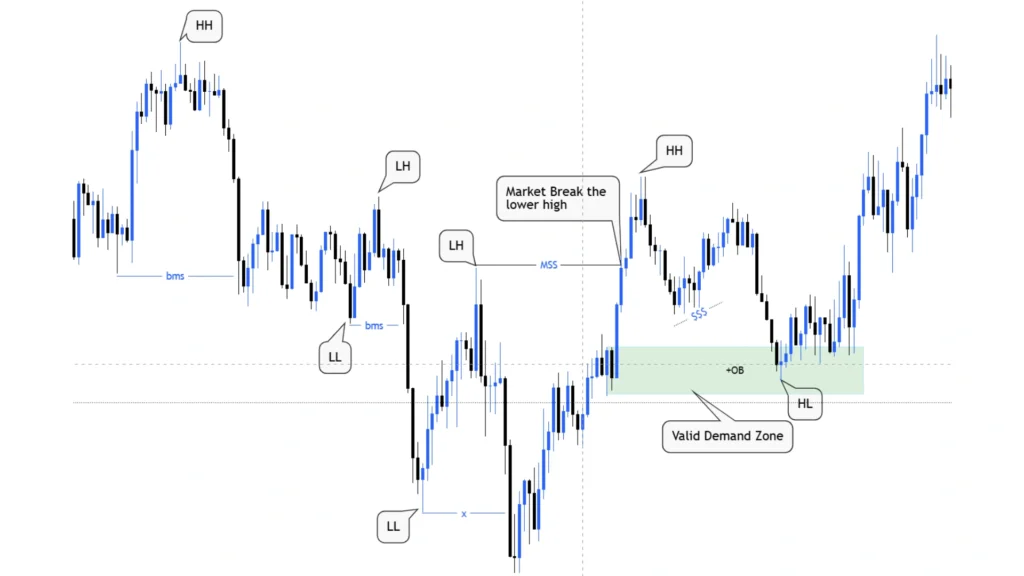
How to Trade Change of Character in Forex (Step-by-Step)
Step 1 – Identify the Trend
Before you can spot a change of character, you must know what the current trend is. Open your chart and zoom out to see the bigger picture clearly.
Is price making higher highs and higher lows? That’s an uptrend. Is it making lower highs and lower lows? That’s a downtrend.
Is it bouncing between the same high and low levels without clear direction? That’s ranging, and you should wait.
You can only identify a CHoCH if you first know what trend might be changing. This might seem obvious, but many traders skip this step and get confused.
Spend time simply observing how price moves. Draw trend lines connecting the highs or lows if it helps you visualize the trend. Once you’re confident about the trend direction, you’re ready for step two.
Step 2 – Mark Key Highs and Lows
Now that you know the trend, mark the important structural points on your chart. These are your reference points for identifying CHoCH.
Use horizontal lines or small marks to highlight the most recent significant higher high and higher low in an uptrend, or lower high and lower low in a downtrend.
Don’t mark every single tiny movement—focus on the obvious swings that are clearly visible. These marks will serve as your alert levels.
When price approaches these levels, you’ll pay closer attention. Some traders use different colors for highs (maybe red) and lows (maybe green) to make them stand out.
The goal is to have a clean chart that clearly shows you where structure could potentially break.
Step 3 – Wait for CHoCH
This is where patience becomes your greatest asset. You’ve identified the trend and marked key levels. Now you wait for price to break structure.
In an uptrend, you’re waiting for price to break below your marked higher low. In a downtrend, you’re waiting for price to break above your marked lower high.
Don’t predict or guess when this will happen. Let the market show you. Some traders wait days or even weeks for proper CHoCH setups because they refuse to force trades.
When that break happens and a candle closes beyond your marked level, that’s your potential CHoCH. But don’t jump in yet—you need confirmation first.
Step 4 – Look for Confirmation
This is the step that protects your money. A structure break alone isn’t enough to enter a trade—you need additional confirmation signals.
Check if the break happened with strong momentum (larger candles showing conviction). Look for a pullback to an order block or imbalance—this is often where you’ll enter.
Check your higher timeframe to ensure it supports this CHoCH. Wait for price behavior at the order block—you want to see rejection (the price bounces from that area).
The more confirmation signals align, the better your setup. If price breaks structure weakly with small candles and no clear order block to test, skip that trade.
There will always be another opportunity. Quality over quantity is the rule with the change of character entry model.
Step 5 – Plan Entry
Once you have confirmation, it’s time to plan your exact entry, stop loss, and take profit before placing the trade.
Your entry is typically at the order block or imbalance after the CHoCH, when price shows rejection. Your stop loss goes just beyond the order block—if price fully breaks through it, your idea is wrong and you exit.
Your take profit can be at the next significant structural level in your anticipated direction, or at a previous high/low that price might target.
Calculate your risk-reward ratio before entering. If you’re risking $100, you should aim to make at least $200 or more.
A good rule is minimum 1:2 risk-reward ratio. Write down your plan, then execute it exactly. No changing your mind mid-trade based on emotions.
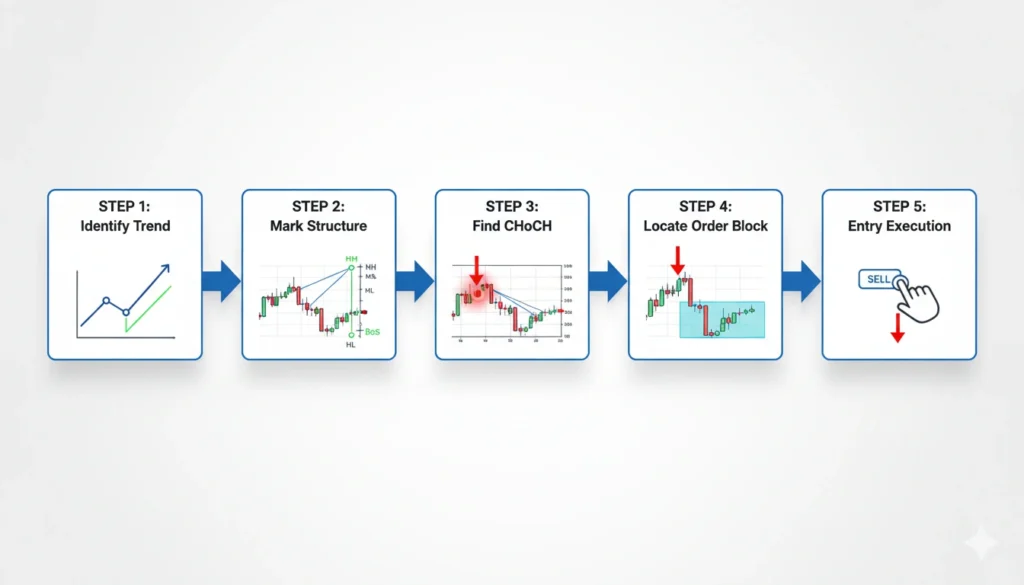
Stop Loss and Take Profit in CHoCH Trades
Knowing where to place your stop loss and take profit is just as important as identifying the CHoCH itself.
For stop loss placement, the safest spot is just beyond the order block or imbalance you’re trading from. If you’re entering a bullish trade from an order block after a bullish CHoCH, place your stop loss a few pips below that order block.
Why? Because if price completely breaks through the order block, it means your analysis was wrong and the CHoCH was likely fake.
You want to exit before losing too much. For take profit, look at the next major structural level. If you’re trading bullish after a bullish CHoCH, your target might be the previous high that price is now trying to reclaim.
Or you might target a liquidity level above. Always aim for at least 2 times your risk—if you risk 20 pips, target at least 40 pips.
This ensures that even if you’re only right 50% of the time, you’ll still be profitable overall.
When NOT to Trade a Change of Character
Knowing when to stay out of the market is as important as knowing when to enter. Here are situations where you should avoid trading CHoCH.
First, don’t trade CHoCH in ranging markets. When price is bouncing between the same high and low levels without clear trend, CHoCH signals are unreliable and often fake. Wait for a clear trend first.
Second, avoid trading during major news events. News can cause wild, unpredictable price movements that ignore technical structure. Even a perfect CHoCH setup can fail during news.
Third, if the CHoCH happened with very small candles and weak momentum, skip it. Real reversals have conviction.
Fourth, if higher timeframes completely contradict your CHoCH, don’t trade it. A 5-minute CHoCH means nothing if the daily chart is in a strong opposite trend.
Fifth, if you can’t clearly identify an order block or quality entry point, don’t force the trade. Being selective is how you protect your capital.
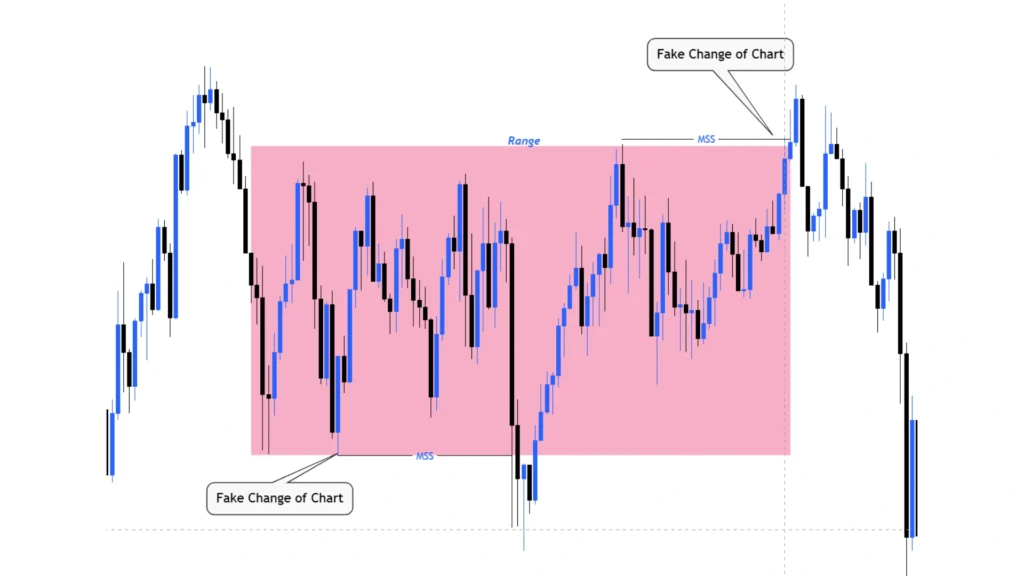
Common Mistakes Traders Make with CHoCH
Learning from common mistakes can save you months of losses and frustration. Here are the biggest errors traders make with change of character trading.
Mistake one: Trading every CHoCH they see without confirmation. Not every structure break leads to reversal. Wait for additional signals.
Mistake two: Using timeframes that are too small. The 1-minute chart is full of noise and fake CHoCH signals. Stick to higher timeframes.
Mistake three: Ignoring higher timeframe structure. Your 15-minute CHoCH doesn’t matter if the 4-hour chart is trending strongly against it.
Mistake four: Placing stop losses too tight. Give your trade room to breathe. Stop losses just a few pips away get hit by normal market noise.
Mistake five: Not having a trading plan. They see CHoCH and jump in without knowing their entry, stop loss, or target.
Mistake six: Overtrading. Not every day has quality CHoCH setups. Sometimes the best trade is no trade. Avoiding these mistakes will immediately improve your results.
Emotional Control While Trading CHoCH
Your emotions can destroy even the best trading strategy if you don’t manage them properly. Here’s what you need to control.
Fear is the first enemy. When you see a perfect CHoCH setup but you’re afraid to enter because your last trade lost, fear is controlling you.
You miss good opportunities. Solution: Follow your trading plan mechanically, regardless of how you feel. Greed is the second enemy.
After a CHoCH trade works and you make profit, greed tells you to enter the next CHoCH immediately without proper confirmation. You start forcing trades. Solution: Stick to your rules, even after wins.
Impatience is the third enemy. Waiting for proper CHoCH confirmation is boring. Impatience makes you enter early without full confirmation.
Solution: Remember that protecting capital is more important than catching every move. Discipline is the solution to all these emotional challenges.
Create rules, write them down, and follow them even when emotions scream at you to do otherwise.
Practical Examples of Change of Character in Forex
Let me walk you through a real-world example story so you can see how change of character forex works in practice.
Imagine EUR/USD has been in a strong downtrend for two weeks, making lower lows and lower highs beautifully. Most traders are looking for selling opportunities, expecting the downtrend to continue.
Then one day, price approaches a previous lower high level at 1.0850. Instead of respecting that level and falling back down like in a healthy downtrend, price breaks above it with a strong bullish candle.
That’s your CHoCH signal—the downtrend structure just broke. But smart traders don’t rush in. They wait.
Price continues up a bit, then pulls back to 1.0870 where an order block is located (the area where price last showed bearish pressure before breaking up).
At the order block, price shows rejection with a bullish pin bar. That’s confirmation. A trader enters long at 1.0875 with a stop loss at 1.0855 (just below the order block) and targets 1.0950 (previous structural high).
Price moves up as expected, and the trader closes with profit. This is how high probability change of character setup works when you combine structure, CHoCH, order blocks, and patience.
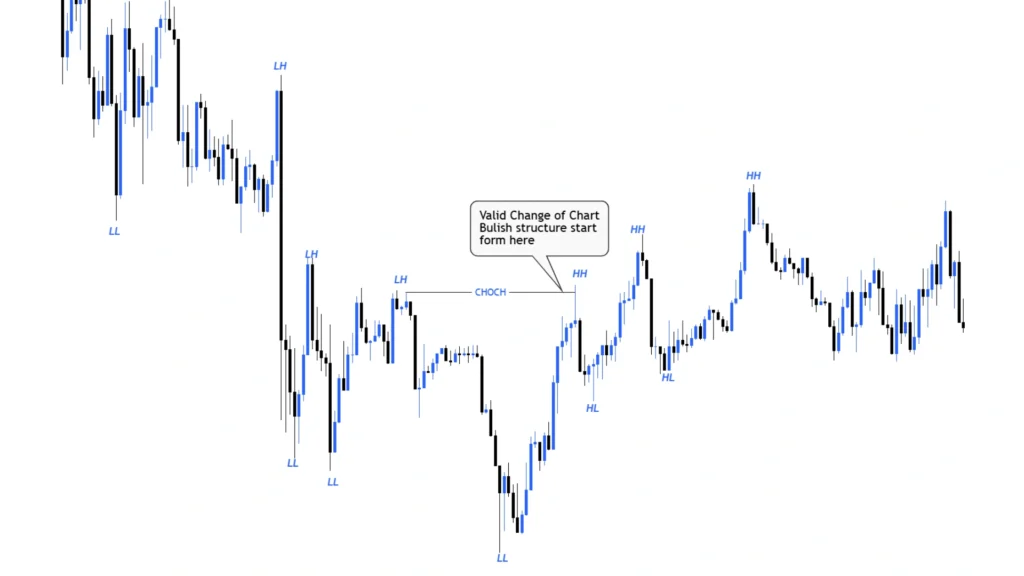
Beginner-Friendly CHoCH Trading Strategy
Here’s one complete, simple strategy you can start using immediately, even if you’re a total beginner to forex smart money confirmation methods.
Rules: Only trade on 1-hour or 4-hour charts to avoid noise.
Step one: Identify a clear trend (higher highs and higher lows, or lower highs and lower lows).
Step two: Wait for a CHoCH—price breaking the most recent higher low in uptrend, or lower high in downtrend.
Step three: Wait for price to pull back to the nearest order block or imbalance zone.
Step four: Wait for a rejection candle at that zone (like a pin bar or engulfing candle).
Step five: Enter on the next candle in the direction of the new trend.
Step six: Place stop loss 10 pips beyond the order block.
Step seven: Target the next major structural level with minimum 1:2 risk-reward. Only take one trade per day maximum. Review your trades weekly.
This simple strategy, followed with discipline, can be profitable. Don’t complicate it or add indicators. Structure and price action are enough.
Advanced Change of Character Trading Techniques
Once you master the basics, these advanced techniques can take your CHoCH trading to the next level for early trend reversal forex identification.
First technique: Multi-timeframe confluence. Identify CHoCH on the daily chart, then drop to 4-hour for confirmation, then drop to 1-hour for precise entry at an order block. This triple alignment creates extremely high-probability setups.
Second technique: Volume analysis. If available, watch for volume spikes during CHoCH. Higher volume confirms institutional involvement. Low volume CHoCH is often fake.
Third technique: Change of character on lower timeframe before higher timeframe. Sometimes the 15-minute chart shows CHoCH before the 1-hour chart does. This gives you earlier entry, but requires more experience to avoid fakes.
Fourth technique: Combining CHoCH with liquidity sweeps. The best CHoCH setups often happen after price sweeps liquidity first (stop hunt), then reverses.
Fifth technique: Intraday choch forex timing—trading CHoCH that forms during specific market sessions when volume is highest (London or New York open).
Why Most Traders Misread Change of Character
Understanding why people fail helps you avoid the same traps and improve your success rate with market manipulation and choch concepts.
The biggest reason traders misread Change of Character is impatience. They see structure starting to break and jump in before the break actually completes and gets confirmed. They want to catch the very beginning of the move and end up catching fake moves instead.
Second reason: They don’t understand the difference between internal and external structure. They mark every tiny swing as a high or low, so they see CHoCH signals everywhere, most of which are meaningless noise.
Third reason: They ignore higher timeframes. Their 5-minute CHoCH excites them, but they don’t check that the 4-hour chart is still in a strong opposite trend.
Fourth reason: They lack understanding of smart money concepts. They don’t know about liquidity, order blocks, or why price behaves the way it does.
Fifth reason: They expect CHoCH to work every time. Even perfect setups sometimes fail. Trading is about probabilities, not guarantees.
Building Your Change of Character Trading Plan
A written trading plan is the difference between random gambling and systematic trading. Here’s how to build yours for choch trading setup forex.
First section: Your rules for identifying trends. Write exactly how you determine if a market is trending or ranging.
Second section: Your CHoCH identification rules. What exactly counts as a valid CHoCH in your system? Be specific.
Third section: Your confirmation requirements. List all the things you need to see before entering (order block, rejection candle, higher timeframe alignment, etc.).
Fourth section: Your entry rules. Exactly where do you enter, and what type of order do you use?
Fifth section: Your risk management. What percentage of your account will you risk per trade? Where do you place stops? How do you calculate position size?
Sixth section: Your targets and exit strategy. Where do you take profit? Do you move stops to breakeven?
Seventh section: Your review process. Will you review trades daily, weekly, or monthly? Write all this down and follow it like a rulebook.
One-Minute Change of Character Checklist
Before entering any CHoCH trade, run through this quick checklist. If you can’t answer “yes” to most items, skip the trade.
- Is there a clear trend that could be changing? Yes or No.
- Has price broken the structure (previous higher low or lower high)? Yes or No.
- Did the break happen with strong momentum candles? Yes or No.
- Is there a clear order block or imbalance to trade from? Yes or No.
- Has price pulled back to that zone? Yes or No.
- Is there a rejection candle or price action showing the zone is holding? Yes or No.
- Does the higher timeframe support this trade or at least not oppose it? Yes or No.
- Is the risk-reward ratio at least 1:2? Yes or No.
- Are you trading during a good market session (avoiding news times)? Yes or No.
- Do you have your entry, stop loss, and take profit clearly planned? Yes or No.
If you answered “no” to more than three questions, seriously reconsider the trade. This checklist prevents emotional trading and keeps you disciplined.

Frequently Asked Questions About Change of Character in Forex Trading
Question: What is change of character in forex trading?
Answer: Change of character (CHoCH) is when the market structure breaks in a way that suggests the trend might be reversing, such as when an uptrend breaks below a higher low or a downtrend breaks above a lower high.
Question: Is CHoCH the same as Market Structure Shift (MSS)?
Answer: Yes, most traders use these terms interchangeably. Both refer to the same concept of structure breaking against the current trend.
Question: What’s the difference between CHoCH and Break of Structure?
Answer: Change of Character signals a possible reversal (breaking against the trend), while Break of Structure signals continuation (breaking with the trend).
Question: What timeframe is best for trading CHoCH?
Answer: For beginners, the 1-hour and 4-hour timeframes work best as they filter out noise and show clearer structure.
Question: How do I avoid fake CHoCH signals?
Answer: Wait for confirmation: strong momentum, order block reaction, higher timeframe alignment, and rejection candles before entering.
Question: Can I trade CHoCH on all currency pairs?
Answer: Yes, CHoCH works on any currency pair, but it’s best to focus on major pairs with good liquidity like EUR/USD, GBP/USD, or USD/JPY.
Question: Do I need indicators to trade CHoCH?
Answer: No, Change of Character is a pure price action concept. You only need to read structure, highs, lows, and order blocks. Indicators can help but aren’t necessary.
Question: How long does it take to master CHoCH trading?
Answer: With consistent practice and proper education, most traders can understand the basics in a few weeks, but mastery takes several months of real trading experience.
Key Takeaways
Let’s summarize the most important points you need to remember about change of character in forex trading.
CHoCH signals potential trend reversal when price breaks structure against the current trend. It’s different from Break of Structure, which signals continuation.
Not every CHoCH is real—you need confirmation through order blocks, momentum, and higher timeframe agreement.
The best timeframes for beginners are 1-hour and 4-hour charts. Always check higher timeframes before trading lower timeframe CHoCH.
Combine CHoCH with supply and demand change of character concepts like order blocks and imbalances for better entries.
Use proper risk management with stops beyond order blocks and targets at structural levels. Avoid trading CHoCH in ranging markets or during high-impact news.
Emotional control and discipline are as important as technical knowledge. Build a written trading plan and follow it consistently. Quality over quantity—wait for perfect setups rather than forcing trades.
Final Thoughts on Change of Character in Forex Trading
Change of character in forex trading is a powerful concept that can transform your trading if you approach it with the right mindset and discipline.
Remember, Change of Character is not a magic button that prints money. It’s a tool that helps you read market structure and identify potential reversals early.
But like any tool, its effectiveness depends on how you use it. You need patience to wait for quality setups, discipline to follow your rules, and humility to accept losses when they happen.
The traders who succeed with choch trading psychology are those who focus on process over profits. They don’t count how many trades they can take in a day; they count how many rules they followed correctly.
They don’t get excited about big winners or devastated by losses; they stay emotionally neutral and trust their system.
Start small, practice on demo accounts or with tiny real positions until you’re consistently profitable, then slowly increase size.
Give yourself time to learn. Most traders give up too early, right before they would have succeeded.
Stay committed, keep learning, stay disciplined, and remember that forex trading is a marathon, not a sprint. You’re building a skill that can serve you for years to come.
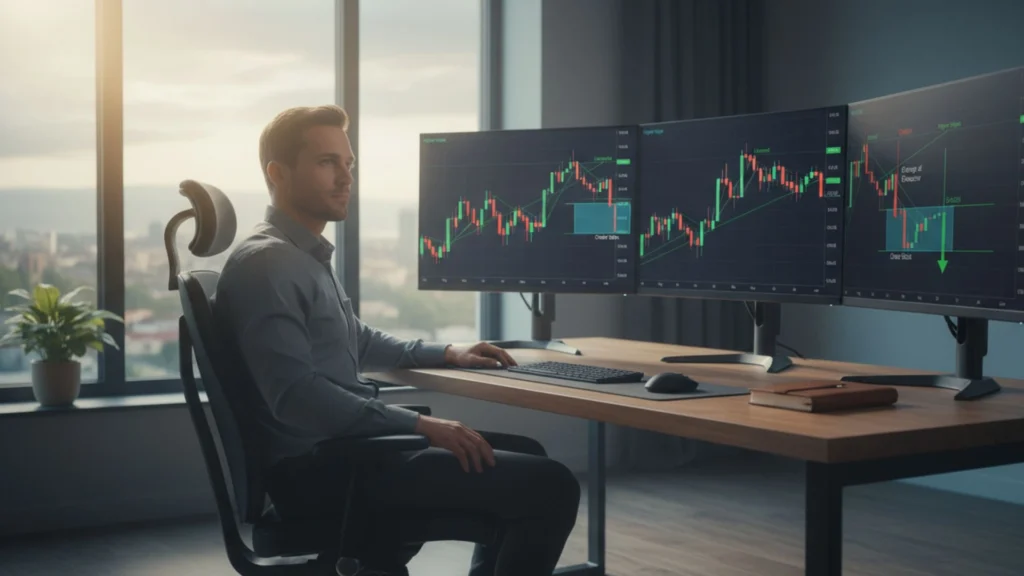
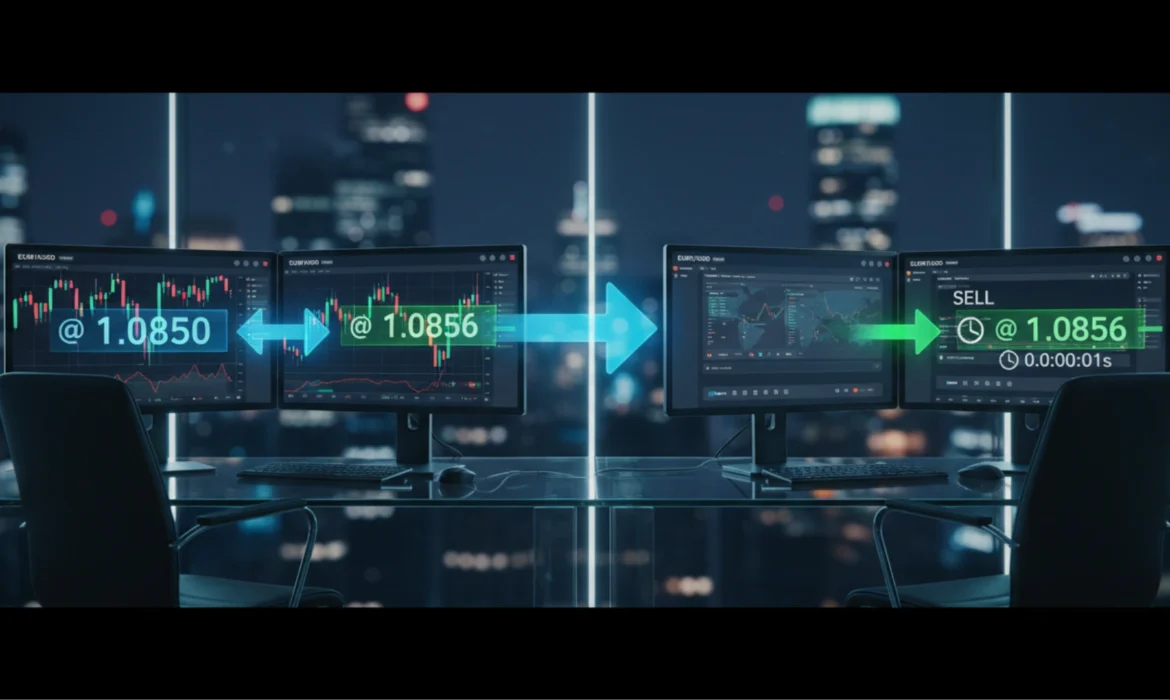
How Arbitrage Forex Works -Beginner’s Guide
Imagine you see the same chocolate bar costs $1 at Store A but $1.20 at Store B. If you buy from Store A and sell to Store B at the same time, you make 20 cents instantly. That’s arbitrage forex in its simplest form!
In currency markets, arbitrage forex means buying and selling the same currency pair when prices don’t match across different places. The price difference becomes your profit without waiting or guessing which way the market moves.
Unlike normal trading where you hope prices go up or down, arbitrage forex trading looks for existing gaps between prices right now. You’re not predicting the future—you’re catching mistakes in pricing that happen in real time.
This works because the forex market is massive and spreads across different countries and brokers. Sometimes prices take a few seconds to match everywhere, creating forex price discrepancies that quick traders can capture.
The goal is simple: buy low somewhere, sell high somewhere else, keep the difference. When done right, it feels almost magical because the profit appears without market risk.

Arbitrage Forex vs Normal Forex Trading
Regular forex trading is like guessing if it will rain tomorrow. You buy if you think prices go up. You sell if you think they’ll drop. You might be right or wrong.
Arbitrage forex works totally differently. You don’t guess at all. You simply find the same currency pair showing different prices in two places and trade both sides instantly.
Normal traders might hold positions for hours or even weeks. Those doing arbitrage forex trading usually close everything within seconds or minutes. Speed matters more than patience here.
Risk levels are completely different too. Traditional trading carries market risk—prices can move against you and cause losses. A currency arbitrage strategy aims to lock in profit immediately with matching trades.
Think of it this way: regular trading is sailing a boat where wind direction matters. Arbitrage forex is like standing on two boats moving apart and keeping the rope between them—you profit from the gap without caring about wind.
However, calling it risk-free forex arbitrage isn’t completely accurate in real life. Technology delays, broker rules, and fees can still create problems.

Why Price Differences Exist in Forex
You might ask: why aren’t prices exactly the same everywhere? Good question!
First, information moves fast but not instantly. Even tiny delays of milliseconds create opportunities for high-frequency arbitrage forex traders with super-fast computers.
Second, different brokers connect to different banks for prices. One broker gets quotes from Deutsche Bank while another uses Citibank. These sources might differ slightly.
Third, each broker adds their own spread to make money. These markups vary between companies, creating small forex market inefficiencies.
Fourth, trading volume affects pricing speed. When thousands of traders suddenly buy EUR/USD on one platform, that broker’s price might jump before others catch up.
Fifth, some brokers use market maker models where they set their own prices. Others use ECN models showing real interbank rates. This difference creates broker arbitrage opportunities.
Network speed also plays a role. A broker with servers in London might update EUR prices faster than one with servers in Asia during European trading hours.
These tiny gaps—often just a few pips—disappear within seconds as the market corrects itself. That’s why spotting and acting on forex price discrepancies requires lightning-fast execution.
Types of Arbitrage Forex (Easy Breakdown)
Let’s break down the main types you’ll encounter:
Triangular Arbitrage Forex
This method uses three different currency pairs to complete a circle. For example, you trade EUR/USD, then USD/JPY, then EUR/JPY back to where you started.
If the math between these three pairs doesn’t add up perfectly, there’s profit hiding in the middle. It’s like exchanging dollars for euros, euros for yen, then yen back to dollars and somehow ending with more dollars than you started.
This requires fast calculations and even faster execution. Most retail traders find triangular arbitrage forex too complex without special software.
Broker Price Arbitrage
This is the easiest type to understand. You open accounts with two different brokers and watch for moments when they show different prices for the same currency pair.
When Broker A shows EUR/USD at 1.0850 and Broker B shows 1.0855, you buy from A and sell to B simultaneously. The 5-pip difference is yours to keep.
This multi-broker arbitrage forex sounds simple but requires careful attention to spreads and fees, which we’ll cover later.
Swap Arbitrage
Some brokers pay you interest for holding certain positions overnight. Others charge you interest. If you find a pair where one broker pays more than another charges, you can profit from the interest difference.
This works on longer timeframes compared to other arbitrage methods. It’s less about speed and more about finding the right broker combinations.
Latency Arbitrage Forex
This controversial method uses technology speed advantages. Some traders place their servers right next to broker data centers to get price information microseconds faster than others.
They see price changes before slower traders and jump on opportunities. However, many brokers consider this unfair and will ban accounts using latency arbitrage forex tactics.
It requires expensive technology and often violates broker terms of service. Most beginners should avoid this path entirely.
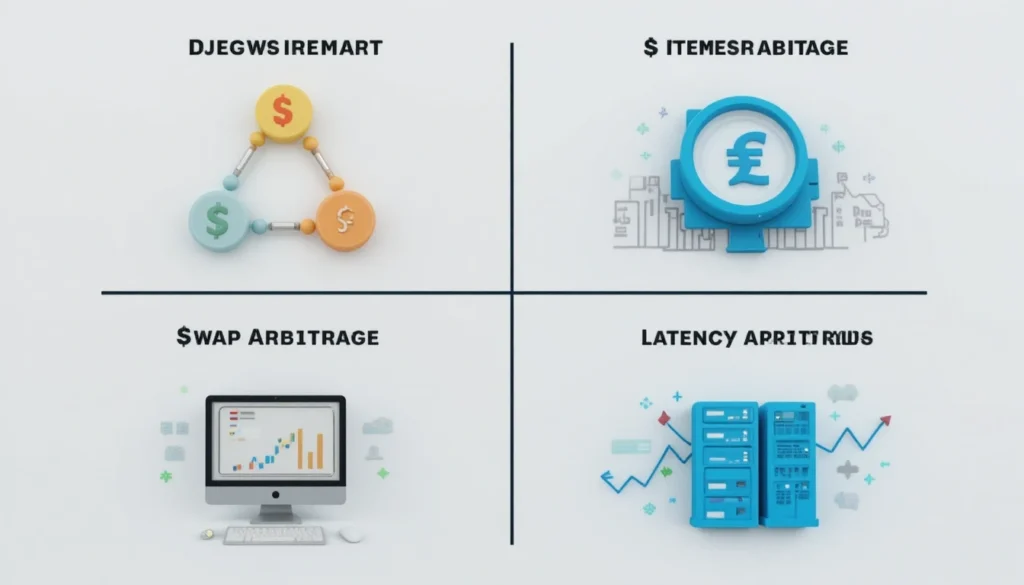
Step-by-Step Forex Arbitrage Example (Beginner Friendly)
Let’s walk through a simple broker arbitrage example that shows how forex arbitrage works in real trading:
Step 1: Find the Price Difference
You’re watching EUR/USD on two broker platforms. Broker A shows 1.0850 and Broker B shows 1.0856. That’s a 6-pip gap—perfect for arbitrage.
Step 2: Open Both Trades Instantly
On Broker A, you buy 1 lot of EUR/USD at 1.0850. At the exact same moment, you sell 1 lot of EUR/USD on Broker B at 1.0856.
Step 3: Wait for Prices to Match
Within seconds, both brokers update and show 1.0853. The gap has closed—this is your exit moment.
Step 4: Close Both Positions
You close the buy trade on Broker A at 1.0853 (3 pips profit). You close the sell trade on Broker B at 1.0853 (3 pips profit).
Step 5: Count Your Profit
With standard lot sizing, each pip equals about $10. You made 3 pips on Broker A ($30) and 3 pips on Broker B ($30), totaling $60 before fees.
This example shows arbitrage forex explained in the simplest way possible. Real execution happens much faster and requires automated systems for best results.
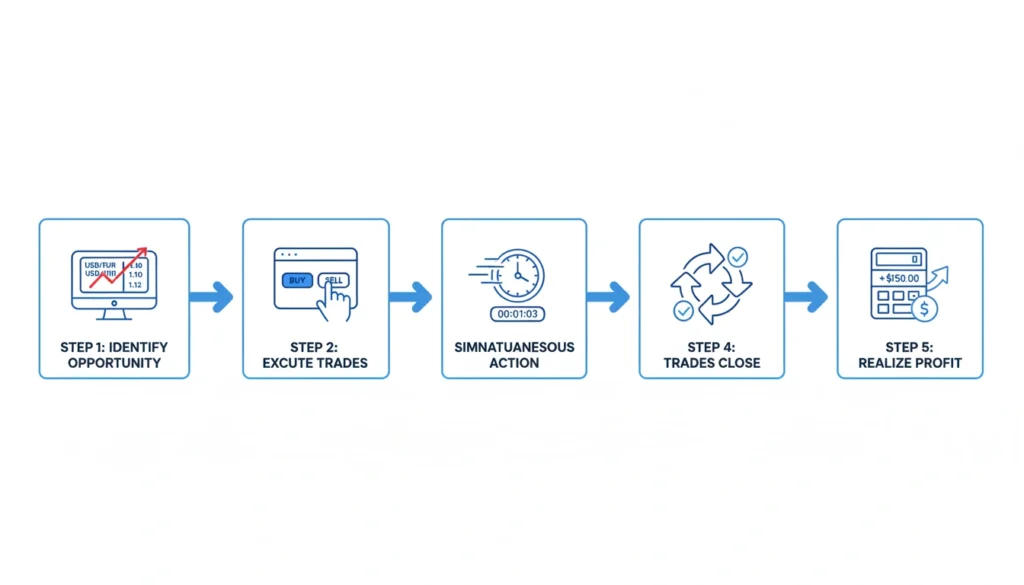
Tools You Need for Forex Arbitrage
Success in arbitrage forex requires specific tools that help you spot and execute opportunities faster than competition:
Trading Platforms
You need accounts with multiple brokers that allow simultaneous trading. MetaTrader 4 and MetaTrader 5 are popular because many brokers support them, making comparison easier.
Some traders use specialized platforms designed specifically for arbitrage forex software needs. These connect to multiple brokers through one interface.
Arbitrage Scanners
These programs constantly monitor prices across different brokers and alert you when profitable gaps appear. Manual watching is nearly impossible—opportunities disappear too quickly.
Quality scanners check dozens of currency pairs across multiple platforms every second, identifying real-time forex arbitrage chances before they vanish.
Calculators
You need these forex tools that instantly calculate if a price difference is large enough to profit after spreads and fees. Speed matters—hesitating even one second can erase opportunities.
Automated forex arbitrage systems often include built-in calculators that factor in all costs automatically before executing trades.
VPS (Virtual Private Server)
Think of VPS as a super-fast computer that lives in a data center and runs 24/7. It keeps your trading software active even when your home computer is off.
Location matters for execution speed in forex arbitrage. A VPS near your broker’s servers executes trades microseconds faster, which can mean the difference between profit and loss.
Many serious arbitrage traders consider VPS essential, not optional. The monthly cost (usually $20-50) pays for itself through better execution quality.
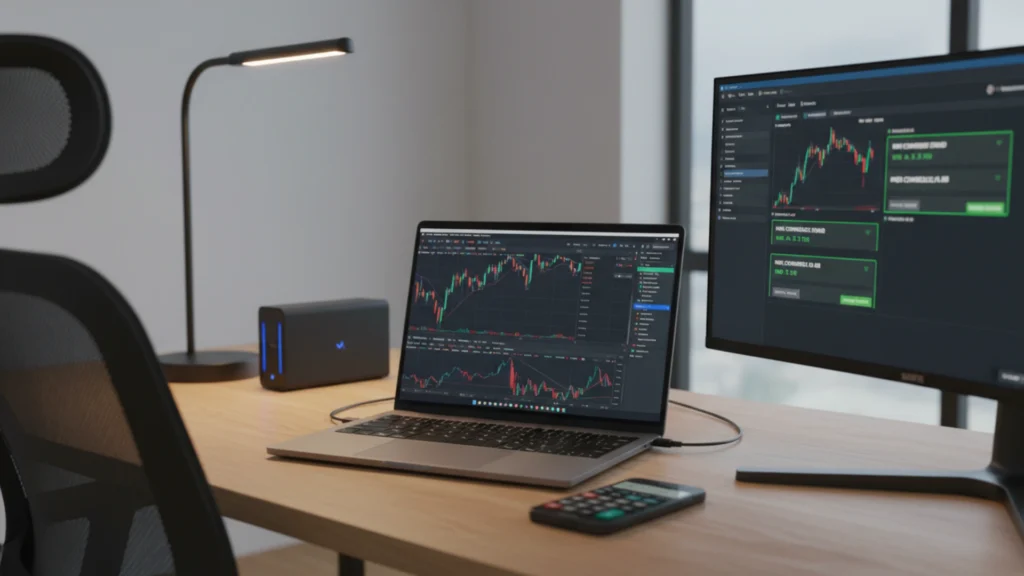
How Much Money Do You Need to Start Forex Arbitrage?
Many beginners ask how much capital they need for arbitrage forex trading. Let’s be honest about the numbers.
Technically, you could start with $100 on some brokers. But here’s the reality: small accounts face huge disadvantages in arbitrage forex.
Price differences are tiny—usually 2-5 pips. On a $100 account trading micro lots, a 5-pip profit equals about 50 cents. After spreads and fees, you might make 20 cents per opportunity.
Finding even 10 opportunities per day would earn just $2. That’s not worth the time, tools, and effort required for successful currency arbitrage strategy execution.
Most experienced arbitrage forex traders suggest starting with at least $1,000-$5,000. This allows standard lot or mini lot trading where each pip movement creates meaningful profit.
With $5,000, a 5-pip arbitrage opportunity could generate $25-50 after costs. Catching several of these daily makes the strategy worthwhile.
Remember that you need capital split across multiple brokers. If you have $5,000 total, you might put $2,500 in Broker A and $2,500 in Broker B to execute both sides of arbitrage trades.
Institutional arbitrage forex operations run millions of dollars because their edge is incredibly small. They make money through massive volume, not large percentage gains.
Set realistic expectations based on your capital size. Arbitrage isn’t a magic money machine for tiny accounts.
Spreads, Fees, and Hidden Costs (Very Important)
This section could save you from painful losses. Understanding costs is absolutely critical in arbitrage forex because profit margins are razor-thin.
Every broker charges a spread—the difference between buy and sell price. If EUR/USD has a 2-pip spread on both brokers, you’re paying 4 pips total cost just to enter trades.
If your price discrepancy is 5 pips but costs are 4 pips, your real profit is only 1 pip. That’s hardly worth the risk and effort.
Commissions add another layer. ECN brokers often charge $3-7 per lot traded. With trades on two brokers, that’s $6-14 in commissions per round trip.
Slippage happens when your order fills at a different price than expected. In fast-moving markets, you might click “buy at 1.0850” but actually get filled at 1.0852.
Even 1-2 pips of slippage on both sides can completely erase your arbitrage profit. This makes execution speed crucial for any currency pair arbitrage strategy.
Swap fees (overnight interest) matter if positions stay open past 5 PM EST. Some brokers charge significant swap costs that eat into profits on positions held longer than intended.
Withdrawal fees also reduce profits. Some brokers charge $25-40 per withdrawal. If you’re making $50 per day in arbitrage profits, losing $40 to withdrawal fees hurts.
Always calculate total costs before executing any arbitrage opportunity. Many beginners ignore fees and wonder why they lose money despite finding price differences.
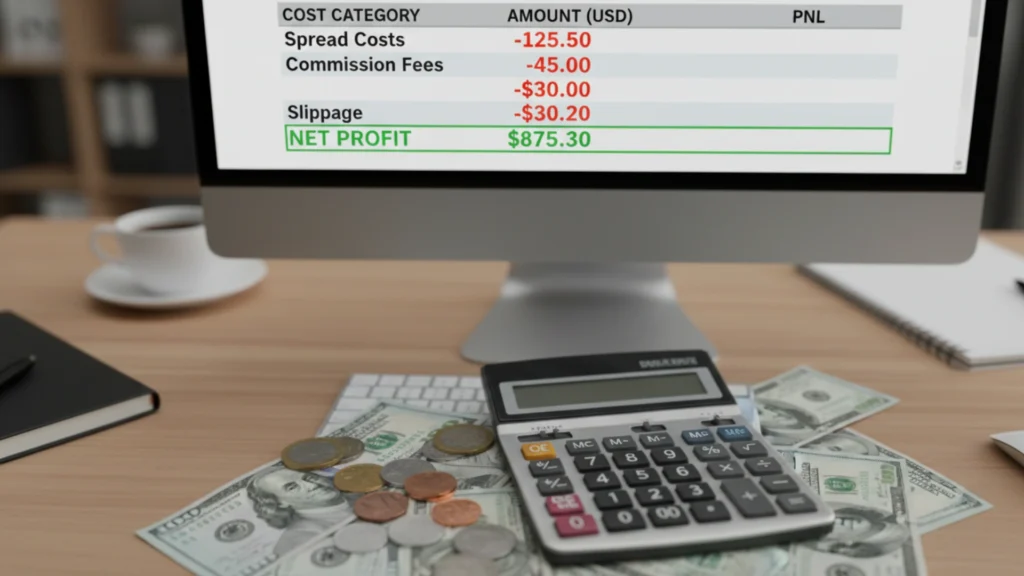
Which Brokers Allow Forex Arbitrage?
Not all brokers welcome arbitrage traders. Understanding broker types helps you choose wisely for arbitrage forex trading strategies.
ECN vs Market Maker
ECN (Electronic Communication Network) brokers connect you directly to the interbank market. They typically allow arbitrage because they profit from commissions, not your losses.
Market maker brokers set their own prices and often take the opposite side of your trades. They usually ban arbitrage forex in their terms of service because it reduces their profit.
Why Some Brokers Ban It
Brokers that quote their own prices can lose money when you exploit their pricing errors. They see arbitrage as taking advantage of their systems rather than fair trading.
Many brokers explicitly state “no arbitrage trading” in account agreements. Violating this can result in profit deletion, account closure, or withdrawal denials.
Some brokers allow arbitrage between different currency pairs but ban it between multiple brokers using their platform. Read the fine print carefully.
What to Check Before Opening Accounts
Always read the broker’s terms of service completely. Look for phrases like “prohibited trading strategies” or “arbitrage restrictions.”
Contact customer support directly and ask: “Does your company allow arbitrage trading between multiple brokers?” Get the answer in writing via email.
Check broker reviews on forex forums. Other arbitrage traders share which companies actually allow the strategy versus those who ban accounts despite unclear policies.
Look for brokers with fast execution, low spreads, and minimal slippage. These factors matter more in arbitrage forex than fancy trading tools or bonus offers.
Consider broker regulation too. Regulated brokers in the US, UK, or Australia follow stricter rules and are less likely to unfairly close profitable accounts.
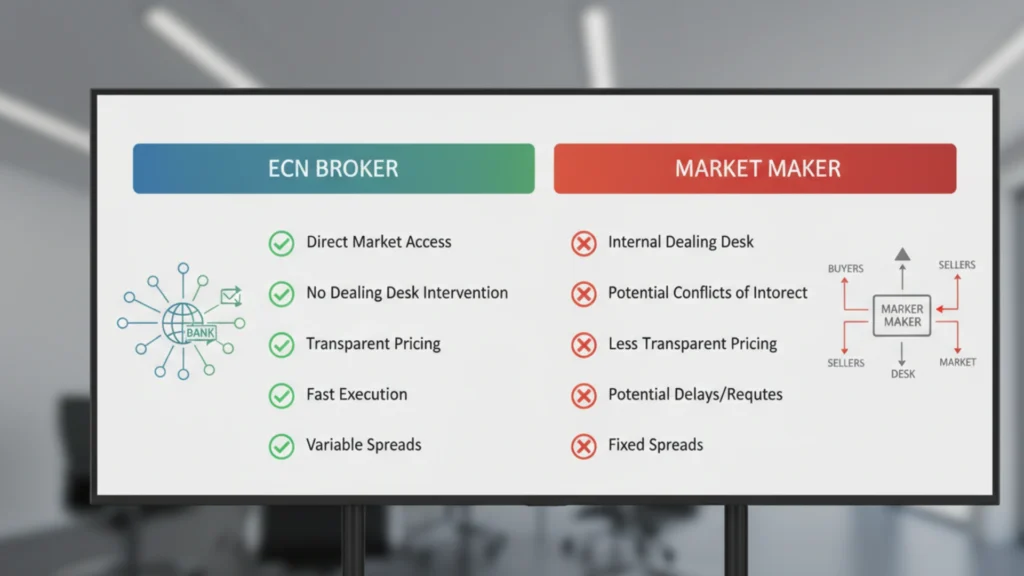
Common Forex Arbitrage Mistakes Beginners Make
Learning from others’ errors saves time and money. Here are the biggest mistakes new arbitrage traders make:
Slow Execution
Beginners try manual arbitrage—watching prices and clicking buttons themselves. By the time you spot a gap and place trades, the opportunity vanishes.
Forex arbitrage execution speed must be measured in milliseconds, not seconds. Automated forex arbitrage systems execute trades hundreds of times faster than human hands.
Ignoring Spreads
New traders see a 5-pip price difference and get excited. They forget that combined spreads might be 4-5 pips, leaving zero or negative profit.
Always subtract total costs from the price gap before deciding if an opportunity is real. Most apparent chances disappear once you account for spreads properly.
Using the Wrong Broker
Opening accounts with market makers that ban arbitrage is a recipe for account closure. Your first few profitable trades might work, then suddenly your account gets restricted.
Do research upfront. Only use brokers that explicitly allow arbitrage forex or have strong reputations for permitting all legal trading strategies.
Over-Leveraging
Some traders use maximum leverage thinking arbitrage is risk-free. They forget about execution risk—what happens if one trade fills but the other doesn’t?
If your buy order fills but the sell order fails, you’re left with a directional position that could lose money. Conservative leverage protects you when technology fails.
Not Testing First
Jumping into live trading without testing systems on demo accounts is dangerous. Demo testing reveals execution speeds, spread costs, and platform reliability before risking real money.
Spend at least 2-3 weeks practicing any currency arbitrage strategy on demo accounts. Track every trade, calculate actual costs, and ensure consistent profitability before going live.

Is Arbitrage Forex Safe?
Let’s address safety honestly without sugar-coating or fear-mongering about arbitrage forex.
The strategy itself carries less market risk than directional trading because you’re not betting on price movement. Both sides of your trade protect each other.
However, execution risk is real. Technology failures, internet disconnections, or platform crashes can leave you with unmatched positions that lose money.
Broker risk exists too. Even if arbitrage is technically legal, brokers can close accounts, delay withdrawals, or claim you violated unclear terms of service.
Regulatory risk matters in some countries. While forex arbitrage trading is legal in most places, some jurisdictions restrict certain trading strategies or broker types.
Capital risk comes from fees and costs. If your strategy isn’t genuinely profitable after all expenses, you’ll slowly lose money despite winning individual trades.
Competition risk grows constantly. More traders using automated forex arbitrage systems mean opportunities become scarcer and disappear faster.
The “risk-free forex arbitrage” label is misleading. Lower risk than directional trading? Yes. Completely risk-free? No.
Think of it like driving a car carefully versus recklessly. Careful driving is safer than speeding, but accidents can still happen even when you follow all rules.
With proper tools, reliable brokers, realistic expectations, and good risk management, arbitrage forex can be relatively safe. But “safe” doesn’t mean “guaranteed profits with zero risk.”
Who Should Avoid Forex Arbitrage Trading
Honesty about who this strategy fits helps everyone. Arbitrage forex isn’t for everyone, and that’s perfectly okay.
Beginners Without Tools
If you’re brand new to forex and don’t have forex arbitrage software, scanners, or VPS setup, this strategy will frustrate you.
Start with learning basic forex concepts first. Understand how currency pairs work, what spreads are, and how brokers operate before attempting arbitrage.
Traders With Small Capital
If you have less than $1,000 to invest across multiple broker accounts, your returns won’t justify the effort required for successful currency arbitrage strategy execution.
The math simply doesn’t work with tiny accounts. Focus on building capital through other methods before exploring arbitrage opportunities.
Those Expecting Easy Money
Some people hear “risk-free” and imagine printing money without effort. Real arbitrage forex requires constant monitoring, fast technology, and significant upfront investment in tools.
It’s technical, detail-oriented work that demands precision. If you want passive income or get-rich-quick schemes, look elsewhere.
People Without Technical Skills
Setting up VPS servers, connecting multiple broker platforms, configuring arbitrage scanners, and troubleshooting technical issues requires computer literacy.
If technology frustrates you or you struggle with software setup, retail forex arbitrage trading will create more headaches than profits.
Impatient Personalities
Arbitrage involves lots of small wins adding up over time. You might execute 50 trades to make $200. If you need excitement and big wins, this grinding style won’t satisfy you.
Know yourself honestly. There’s no shame in recognizing that forex arbitrage trading strategies don’t match your personality, skills, or financial situation.

Can Retail Traders Really Compete With Big Firms?
This question deserves a straight answer about institutional forex arbitrage versus what retail traders can achieve.
Big financial institutions have enormous advantages. They operate with millions or billions of dollars, getting better spreads and lower fees than retail traders ever will.
Their technology costs millions. Direct market access, co-located servers next to exchange data centers, and custom-built forex arbitrage bots operate at speeds retail traders cannot match.
High-frequency forex arbitrage dominated by institutions happens in microseconds. They capture opportunities so fast that retail traders never even see them appear.
However, retail traders aren’t completely locked out. Different types of opportunities exist at different speed levels.
Ultra-fast latency arbitrage? You can’t compete. But slower broker arbitrage opportunities that last several seconds? These are still accessible to well-prepared retail traders.
Institutions ignore tiny profit amounts that matter to individuals. A $50 profit per trade means nothing to a bank but could be meaningful passive income for someone with a $10,000 account.
Some retail traders succeed by focusing on less competitive niches like swap arbitrage or specific exotic currency pairs that big institutions ignore.
The honest truth: you won’t beat institutional players at their own game. But you can find different games where your advantages—flexibility, lower overhead, and smaller profit needs—create viable opportunities.
Competition has definitely increased. Profit from forex arbitrage opportunities today is harder than it was 10 years ago. But “harder” doesn’t mean “impossible” for dedicated retail traders with proper tools and realistic expectations.
Is Forex Arbitrage Still Profitable in 2025 and Beyond?
Looking at the future of arbitrage forex requires examining current trends and likely developments.
Automation Growth
More traders now use automated arbitrage forex systems than ever before. This increases competition for every opportunity, making gaps smaller and shorter-lived.
As technology improves and becomes cheaper, even more traders will adopt automation. This trend will likely continue, further compressing profit margins.
Broker Restrictions
Many brokers have tightened policies against certain arbitrage methods, especially latency arbitrage forex tactics. Terms of service increasingly include anti-arbitrage clauses.
This trend will probably continue as brokers protect themselves from strategies they consider exploitative. Finding arbitrage-friendly brokers may become harder.
Competition Increase
Every year, more sophisticated traders enter the market with better tools. Statistical arbitrage forex methods using AI and machine learning are becoming more common.
The edge that simple broker arbitrage provided in 2015 has shrunk significantly by 2025. Future years will likely see even more competition.
Regulatory Changes
Some regulators might introduce rules affecting high-frequency trading or certain arbitrage methods. While unlikely to ban the practice entirely, new regulations could create additional compliance costs.
Technology Advances
Better internet speeds and cheaper VPS hosting help retail traders. Cloud computing makes powerful tools more accessible than ever before.
Blockchain and decentralized finance might create new types of forex arbitrage opportunities today that didn’t exist previously.
Realistic Outlook
Will arbitrage forex remain profitable in 2025 and beyond? Yes, but with shrinking margins and higher requirements.
Successful traders will need better technology, more capital, and greater sophistication than predecessors. The “easy era” of arbitrage has passed.
However, as long as markets have multiple participants and information takes time to spread, some form of arbitrage will always exist. The question isn’t whether opportunities exist—it’s whether you can capture them profitably given your resources.
Low-risk forex trading methods like arbitrage will continue attracting traders seeking alternatives to directional speculation. That demand ensures the strategy remains relevant even as competition intensifies.

Arbitrage Forex: Key Takeaways (Simple Summary)
Let’s recap everything in simple points anyone can understand:
- Arbitrage forex means buying and selling the same currency at different prices to catch the gap
- It’s different from normal trading because you don’t guess price direction—you spot existing differences
- Price gaps exist because of broker differences, speed delays, and market inefficiencies
- Main types include triangular arbitrage, broker arbitrage, swap arbitrage, and latency arbitrage
- You need special tools: trading platforms, scanners, calculators, and VPS for speed
- Small accounts struggle because profit per trade is tiny—start with at least $1,000-$5,000
- Spreads and fees can erase profits, so always calculate total costs before trading
- Choose ECN brokers that allow arbitrage; avoid market makers that ban the strategy
- Common mistakes include slow execution, ignoring costs, and using wrong brokers
- It’s lower risk than directional trading but not completely risk-free
- Beginners without tools, people with small capital, and those wanting easy money should avoid it
- Retail traders can compete but not at the ultra-high-frequency level of big institutions
- The strategy remains profitable in 2025 but with tighter margins and more competition
- Success requires realistic expectations, proper tools, sufficient capital, and continuous learning
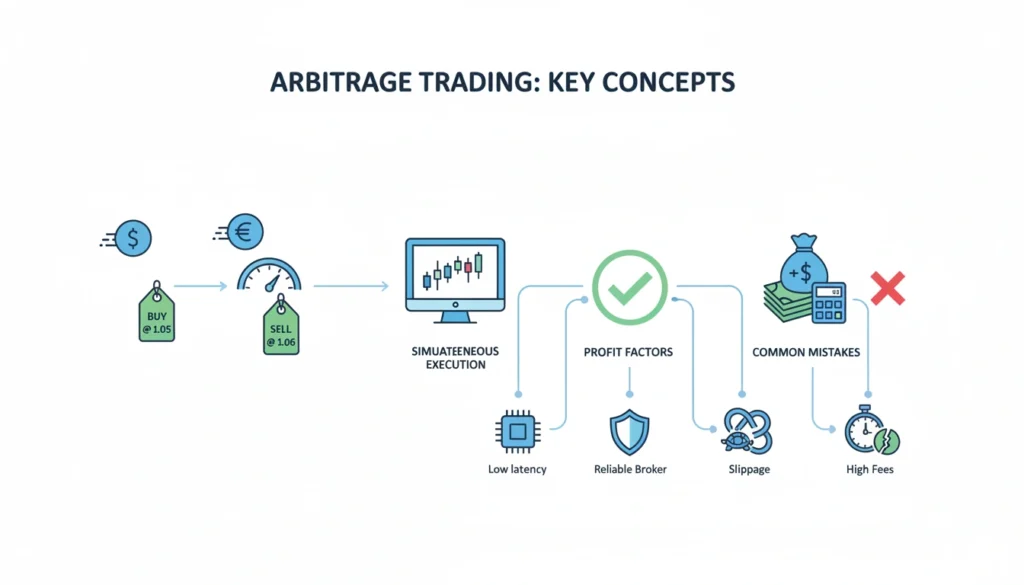
Beginner FAQ (Short & Clear)
Is it legal?
Yes, forex arbitrage trading is legal in most countries. However, some brokers ban it in their terms of service. Always check broker rules before trading. The strategy itself isn’t illegal—it’s about whether specific brokers allow it.
Is it guaranteed profit?
No. While often called “risk-free forex arbitrage,” execution problems, fees, and technical failures can cause losses. Profit margins are small, and costs can exceed gains. It’s lower risk, not zero risk.
Can I automate it?
Yes. In fact, automation is almost essential. Manual trading is too slow to catch opportunities before they disappear. Most successful arbitrage traders use forex arbitrage software or automated systems to scan and execute trades.
Can I lose money?
Yes. If one trade fills but the other doesn’t, you’re left with market risk. High spreads and fees can turn profits into losses. Broker account closures can trap funds. Technology failures create unmatched positions. Capital management matters greatly.
How fast must I execute trades?
Very fast—usually within 1-3 seconds for broker arbitrage, and milliseconds for high-frequency methods. This is why automated forex arbitrage bots are necessary. Human reaction time simply can’t compete with modern market speeds.
Do I need accounts with multiple brokers?
For broker price arbitrage, yes. You need at least two brokers showing different prices. For triangular arbitrage forex, you might only need one broker with multiple currency pairs available.

Final Word:
Arbitrage forex offers a unique approach to currency markets that differs from traditional trading. While it sounds appealing in theory, success requires significant preparation, proper tools, adequate capital, and realistic expectations. If you have the resources and technical ability, it can become part of a diversified trading strategy. But remember—no trading method eliminates risk entirely. Always trade responsibly and never risk money you cannot afford to lose.
Penny Stock Trading App Guide: Features, Tools, Pros & Cons
What Are Penny Stocks?
Imagine you have a few coins in your piggy bank. You want to buy something special, but most toys in the store cost too much money. Then you find a small shop where toys cost just pennies. That’s kind of what penny stocks are like!
Penny stocks are shares of very small companies that cost very little money. Most times, they cost less than five dollars per share. Some might even cost just a few cents! These are not big famous companies like the ones you see on TV. Instead, they’re tiny businesses just starting out or trying to grow.
Because penny stocks are so cheap, many people think they can buy lots of them without spending much money. But remember, cheap doesn’t always mean good. These little stocks can be tricky and risky, just like buying a toy from an unknown store.
What Is a Penny Stock Trading App?
A penny stock trading app is like a special tool on your phone or tablet that lets you buy and sell these tiny, cheap stocks. Think of it as a magic window that shows you all the small companies and their prices.
When you open one of these penny stock trading apps, you can see numbers going up and down. These numbers show how much each stock costs right now. The app also shows colorful charts that look like mountains and valleys. These charts help you understand if a stock is getting more expensive or cheaper.
These mobile penny stock trading apps for low-priced stocks make everything simple. You don’t need to call anyone or visit an office. You just tap buttons on your screen, and you can buy or sell stocks in seconds. The app keeps all your information safe and shows you how much money you have.

Who Should Use a Penny Stock Trading App?
Not everyone needs a penny stock trading app, but some people find them very helpful. Let me explain who these people are.
First, if you’re just learning about stocks and don’t have much money to start, these apps for micro-cap stock trading might be perfect for you. You can practice with small amounts without worrying about losing big money.
Second, beginner-friendly penny stock trading apps work great for curious people who want to learn how the stock market works. You can watch prices change, read news, and understand patterns without feeling overwhelmed.
Third, people with a small budget who still want to try investing can use these low-budget stock trading apps. Instead of needing thousands of dollars, you might start with just fifty or one hundred dollars.
But remember, these penny stock trading apps aren’t toys. Even though the stocks are cheap, you can still lose your money if you’re not careful.
Features You Must Look for in a Penny Stock Trading App
When choosing a penny stock trading app, you need to look for special features that make trading easier and safer. Let me tell you about the most important ones.
Real-Time Charts and Data
The penny stock trading app should show you what’s happening right now, not from yesterday or last week. Real-time penny stock alerts app features help you see price changes as they happen. This is super important because penny stocks can change very quickly.
Low Fees and Commissions
Some penny stock trading apps charge you money every time you buy or sell a stock. Look for commission-free penny stock trading options or apps with very small fees. If the fees are too high, you might lose money even when your stocks go up!
Easy-to-Use Design
The best apps for penny stocks should be simple to understand. Even if you’ve never traded before, you should be able to find buttons easily and understand what everything means.
News and Alerts
Good penny stock investing platforms send you messages when something important happens. Maybe a stock you’re watching suddenly goes up or down. The penny stock trading app should tell you right away.
H3: Demo or Practice Mode
Some trusted penny stock trading apps for beginners let you practice with fake money first. This is like playing a video game before playing for real. You can learn without risking your actual money.

How to Choose the Best Penny Stock Trading App (Step-by-Step Guide)
Picking the right penny stock trading app doesn’t have to be confusing. Just follow these simple steps, and you’ll find a good one.
Step 1: Check if the penny stock trading app is safe and real. Make sure it’s from a trusted company that follows the rules. Look for reviews from other people who used it.
Step 2: See if the penny stock trading app charges fees. Compare different apps to find one with the lowest costs. Remember, every dollar you save on fees is a dollar you keep!
Step 3: Try the penny stock trading app before putting real money in it. Many top-rated penny stock brokers offer demo accounts where you can practice.
Step 4: Check if the penny stock trading app is easy to use. Open it and look around. Can you understand the buttons? Does it feel comfortable?
Step 5: Make sure the app shows OTC stocks and pink sheet stocks. These are the types of penny stocks you’ll want to trade.
Step 6: Look for helpful tools like penny stock charting tools app features, watchlists, and stock scanners.
Top Penny Stock Trading Apps
Many apps let you trade penny stocks. Here are some types of penny stock trading platforms people commonly use:
Some penny stock trading apps focus on commission-free trading and work well for beginners. Others offer advanced penny stock screener apps with lots of data and research tools. There are also apps that specialize in apps to trade OTC stocks and pink sheet companies.
Some US penny stock trading apps only work in America, while international penny stock trading apps let people from different countries trade together.
When researching, look for apps that have good reviews, strong security, and helpful customer support. Remember, the best app for someone else might not be the best app for you. It depends on what you need and how you like to trade.
E*TRADE — Best Overall
- E*TRADE is a solid all-around trading platform with many features. It allows you to trade many kinds of stocks, ETFs, and even more advanced tools.
- If the penny stock is listed normally (not OTC / Pink Sheets), you might pay zero commission.
- For some very cheap or over-the-counter stocks, E*TRADE charges a commission (e.g. around $6.95 per trade).
- They support easy account types (regular, retirement, etc.) and multiple funding methods like bank transfer.
- To open an account: Visit E*TRADE’s website → fill out signup form → link your bank / funding method. They usually don’t need a big minimum deposit.
Good For: beginners and intermediate traders who want a reliable, full-featured platform.
Watch Out: OTC / ultra-cheap stocks may have higher fees — so check before you buy.
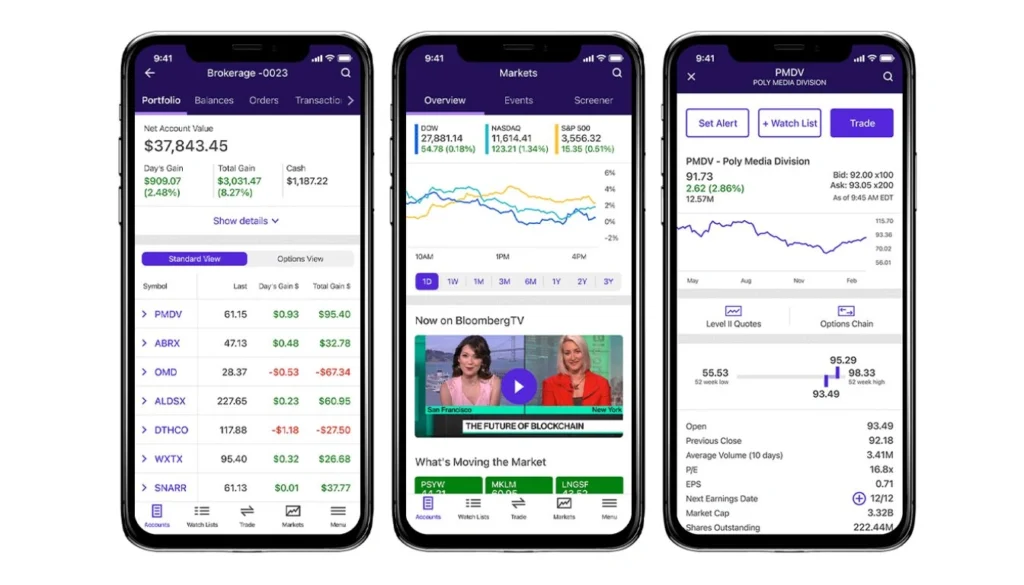
Fidelity — Best for Low Costs & Simplicity
- Fidelity is famous for offering penny stock trades often with no extra fees (or very low fees). That’s good if your budget is small.
- The platform gives good tools: research, stock info, and trading tools — helpful if you want to make informed choices.
- There is no complicated minimum deposit needed, so almost anyone can start trading with small amounts.
- To open an account: Go to Fidelity’s official website → choose account type → complete registration and link bank. Because there’s no minimum deposit, you can start small.
Good For: people who don’t want to spend much money and want simple, low-cost trading.
Watch Out: Platform tools are good — but sometimes new traders find it a little overwhelming at first.
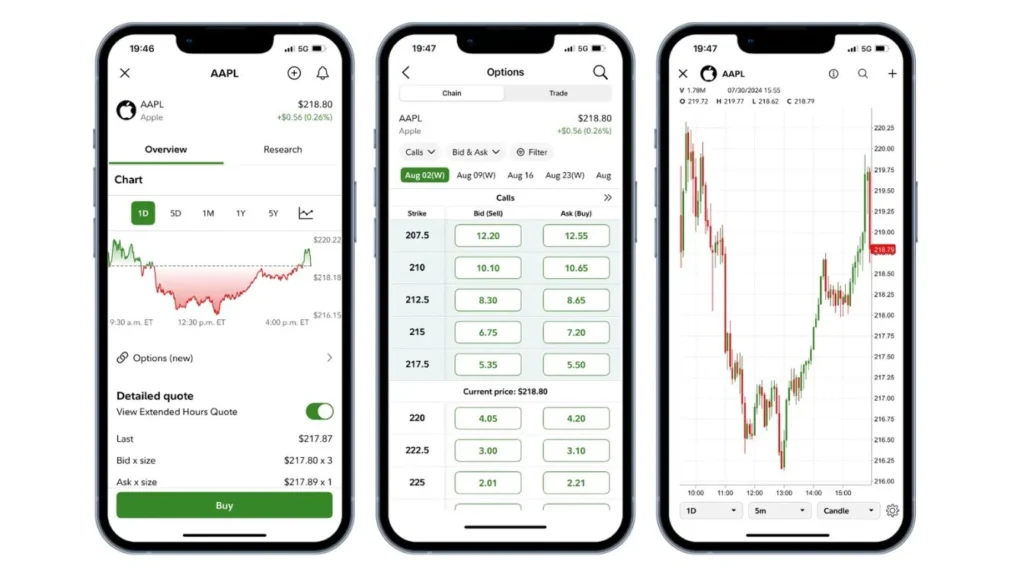
Interactive Brokers (IBKR) — Best for Risk Management & Experienced Traders
- Interactive Brokers offers very low trading costs — sometimes per-share pricing starting at tiny amounts (good if you trade many shares).
- It has many international and US-stocks access, good tools for analysis, and wide options if you want to grow beyond penny stocks.
- Minimum deposit is often $0 (or very low) — so you don’t need big money to start.
- To open an account: Visit Interactive Brokers site → sign up → choose account type → verify identity — many users say setup completes in 1–3 days.
Good For: traders who plan to grow, use advanced tools, and manage risk carefully.
Watch Out: Because it has many features and options, it may feel more complex for total beginners.
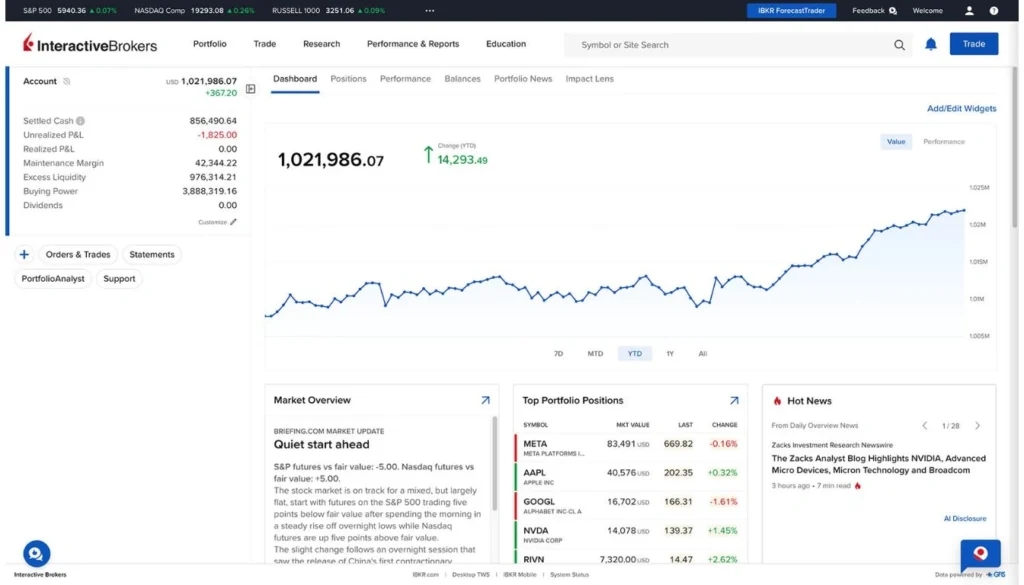
TradeStation — Also Good for Advanced / Active Traders
- TradeStation offers commission-free trades for many stocks and ETFs (depending on plan) — which makes it useful for frequent trading.
- It has strong tools and research — good for people who study charts, patterns, and make active decisions.
- To open an account: Visit TradeStation website → sign up and fund account (some plans may require a deposit) → start trading.
Good For: active traders, or people who want to grow beyond just casual penny-stock buying.
Watch Out: Some account types may require more money, and there might be extra fees for certain services.
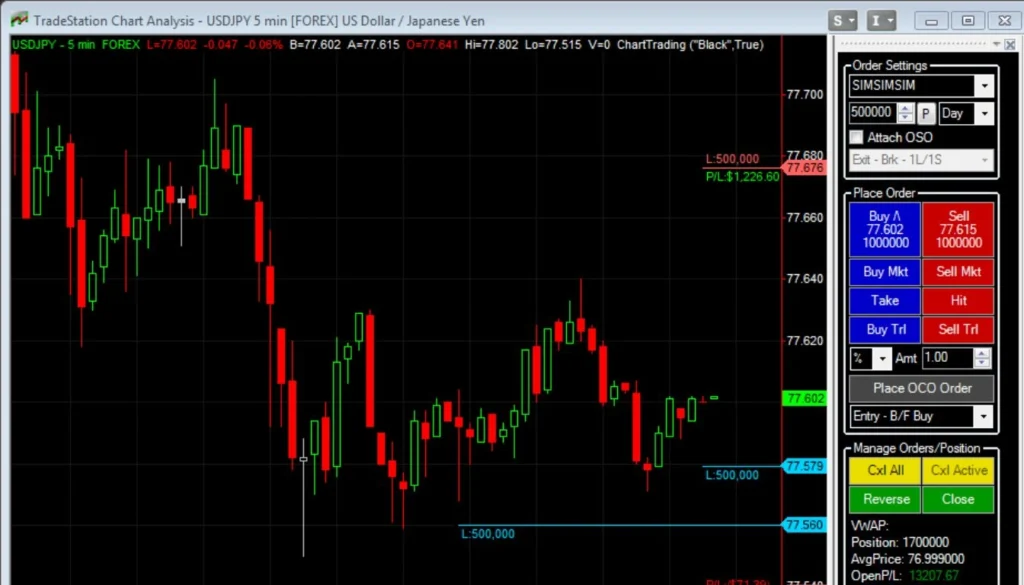
⚠️ Important Note — About Robinhood (If Considered)
- Robinhood is easy and simple for regular stocks and small investments. But for many penny stocks or “OTC / low-price / pink sheet” stocks, Robinhood may not allow trading.
- So if your goal is to trade cheap penny stocks (especially OTC), Robinhood might not be the best choice.
How to Start Trading Penny Stocks on an App
Starting your penny stock journey is easier than you might think. Just follow these simple steps:
Open the App
First, download the penny stock trading app from your phone’s app store. Make sure you’re getting the real app, not a fake one. Check the company name and reviews.
Create Your Account
You’ll need to give some information like your name, email, and sometimes your bank details. This is normal and helps keep everything safe. The penny stock trading app needs to know who you are.
Learn Charts
Before trading, spend time looking at the charts. These colorful lines show how stock prices move. Watch them for a few days to understand the patterns. Many penny stock trading apps have tutorials that explain everything.
Start with Demo
If the app has a practice mode, use it! Put fake money in fake trades and see what happens. This helps you learn without any real risk.
Place Small Trades
When you’re ready to use real money, start very small. Maybe buy just a few shares of one stock. Watch what happens. Learn from each trade before making bigger ones.
Risks of Penny Stocks
Penny stocks might seem fun because they’re cheap, but they come with some big dangers. Let me explain these risks in a gentle way.
High Risk of Losing Money
Remember, just because something costs pennies doesn’t mean it’s safe. Many penny stocks belong to companies that aren’t doing well. The company might even close down, and then your stock becomes worthless, like a toy that breaks and can’t be fixed.
Big Price Jumps
Penny stock prices can jump up and down very fast. One minute, your stock might be worth fifty cents. The next minute, it might be worth twenty cents. These sudden changes can be scary and can make you lose money quickly.
Fake Hype and Tricks
Some bad people try to trick others with penny stocks. They spread fake news or exciting stories to make people buy a stock. Then, when the price goes up, these tricky people sell everything and run away with the money. This is called a “pump-and-dump” scheme.
Hard to Sell Sometimes
Sometimes, when you want to sell your penny stocks, nobody wants to buy them. It’s like trying to sell a toy that nobody else wants. You might be stuck with it.
Understanding these high-risk stock trading apps challenges helps you stay careful and smart.
Safety Tips When Using a Penny Stock Trading App
Staying safe while using these apps is very important. Here are some simple tips to protect yourself:
Tip 1: Never invest money you can’t afford to lose. Only use extra money that you won’t need for food, rent, or important things.
Tip 2: Research before you buy. Don’t just buy a stock because someone told you to. Look up information about the company yourself.
Tip 3: Use safe apps for penny stock trading that are approved and regulated. Check if the penny stock trading app follows government rules.
Tip 4: Start small and learn slowly. Don’t put all your money into one trade or one stock.
Tip 5: Set up alerts and notifications. Use the real-time penny stock watchlist app features to keep track of your stocks without checking constantly.
Tip 6: Keep your passwords strong and private. Never share your login information with anyone.
Tip 7: Be careful of advice from strangers online. Many people try to trick beginners with fake tips.
Best Tools Inside a Penny Stock App
Good penny stock trading platforms come with helpful tools that make trading easier. Let me show you the most useful ones.
Watchlists
A watchlist is like a special folder where you save stocks you’re interested in. You don’t have to buy them yet, but you want to watch their prices. This penny stock portfolio tracking app feature helps you stay organized.
Alerts and Notifications
These are messages the penny stock trading app sends when something important happens. Maybe a stock you’re watching goes above a certain price. The penny stock signals and alerts app will tell you right away.
Level 2 Data
This is special information that shows you who’s buying and selling stocks and at what prices. It’s like seeing behind the curtain. This helps you make smarter decisions.
Volume Indicators
Volume shows how many people are trading a stock. If lots of people are buying or selling, the volume is high. This information from your penny stock scanner mobile app helps you understand if a stock is getting popular.
Examples: How a Penny Stock Trade Works
Let me give you two simple examples so you can understand how trading works.
Example 1: Imagine you find a penny stock called “ABC Company” that costs 50 cents per share. You decide to buy 100 shares. That costs you $50 total. A week later, good news comes out, and the price goes up to $1 per share. Now your 100 shares are worth $100. You sell them and make $50 profit! Using a fast execution penny stock app helped you buy and sell quickly.
Example 2: Now imagine you buy 200 shares of “XYZ Company” at 25 cents each. That’s $50. But bad news comes out, and the price drops to 10 cents per share. Now your investment is only worth $20. You lost $30. This shows why penny stocks are risky.
These examples show that you can win or lose money. That’s why learning to use penny stock market analysis app tools is so important.
Penny Stock Trading App vs. Normal Stock App
You might wonder what makes apps to trade pink sheet stocks different from regular stock apps. Let me explain simply.
Regular stock apps focus on big, famous companies like the ones you see in shopping malls or on TV. These stocks usually cost more money—sometimes hundreds of dollars per share.
Penny stock trading apps focus on tiny, unknown companies. These apps show OTC stocks and pink sheet stocks that you won’t find on big stock markets. The prices are much lower, sometimes just pennies.
Regular apps might have stricter rules and more protection for investors. Penny stock apps often deal with riskier investments that aren’t watched as carefully by the government.
Also, apps for speculative stock trading like penny stock apps usually have more warnings and require you to understand that you’re taking bigger risks.
Both types of apps let you buy and sell stocks, but they serve different purposes and different types of traders.
Common Mistakes New Traders Make on Penny Stock Apps
Everyone makes mistakes when learning something new. Here are common mistakes beginners make, so you can avoid them:
Mistake 1: Investing too much money too quickly. Start small and grow slowly as you learn.
Mistake 2: Following tips from strangers without doing your own research. Always check facts yourself.
Mistake 3: Chasing stocks that already went up a lot. By the time you hear about it, it might be too late.
Mistake 4: Not using the tools available. Many beginners ignore helpful features like AI-based penny stock prediction apps or analysis tools.
Mistake 5: Getting emotional. When prices go down, some people panic and sell. When prices go up, some people get too excited and buy more without thinking.
Mistake 6: Not keeping records. Write down what you buy, when you buy it, and why. This helps you learn from your decisions.
Mistake 7: Forgetting about fees. Even small trading costs add up over time.
Learning from these mistakes helps you become a smarter trader.
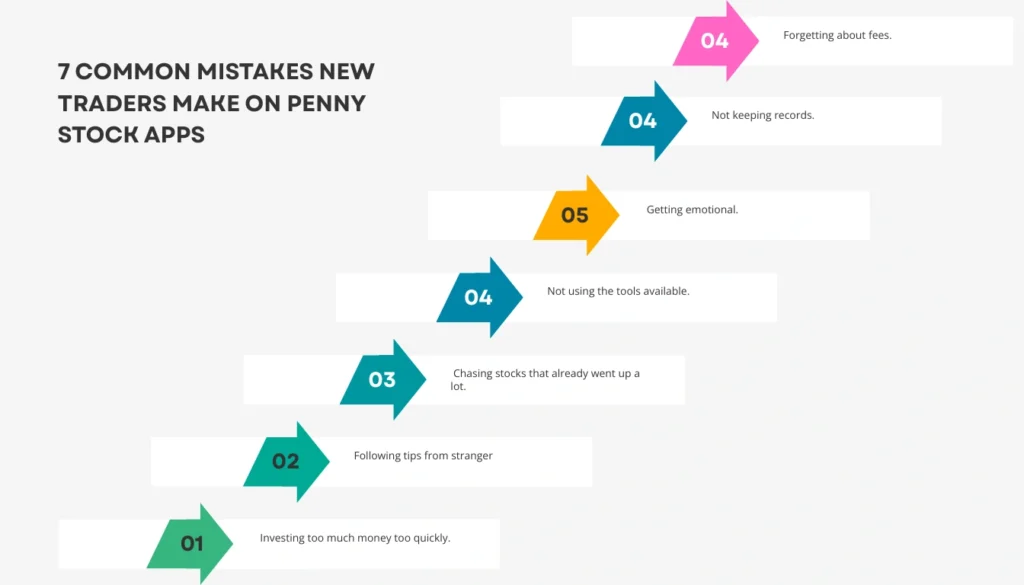
FAQs About Penny Stock Trading Apps
Question: Are penny stock trading apps safe to use?
Answer: Yes, if you choose penny stock trading apps from trusted companies that follow government rules. Always check reviews and research before downloading.
Question: How much money do I need to start?
Answer: You can start with as little as $50 or $100 on many low-fee penny stock trading platforms. But remember, only invest money you can afford to lose.
Question: Can I really make money with penny stocks?
Answer: Yes, some people make money, but many people also lose money. Penny stocks are very risky. Success requires research, patience, and luck.
Question: Do I need to pay taxes on penny stock profits?
Answer: Yes, in most countries, you need to pay taxes on any money you make from stocks. Talk to a grown-up or tax helper about this.
Question: Can I use these apps on my phone and computer?
Answer: Most mobile apps to buy and sell penny stocks work on both phones and tablets. Some also have computer versions.
Question: What happens if I lose my password?
Answer: Most apps have a “forgot password” button that helps you reset it. Always use a strong password you can remember.
H2: Final Tips for Beginners
You’ve learned so much about penny stock trading apps! Before you start, remember these final important tips:
Take your time. Learning about stocks is a journey, not a race. Don’t rush into trades just because you’re excited.
Keep learning. Read articles, watch videos, and practice on demo accounts. The more you know, the better decisions you’ll make.
Stay safe. Use only trusted, regulated apps. Protect your passwords and personal information.
Be patient. Success with penny stocks doesn’t happen overnight. Even when you lose money on a trade, you’re learning valuable lessons.
Start small. Use a tiny amount of money while you’re learning. As you get better and more confident, you can slowly increase your investments.
Remember, every expert trader was once a beginner just like you. They learned, made mistakes, and kept trying. You can do the same thing!
The world of penny stock investing platforms is exciting and full of possibilities. With the right app, the right knowledge, and the right attitude, you’re ready to begin your trading journey. Good luck, and trade smart!

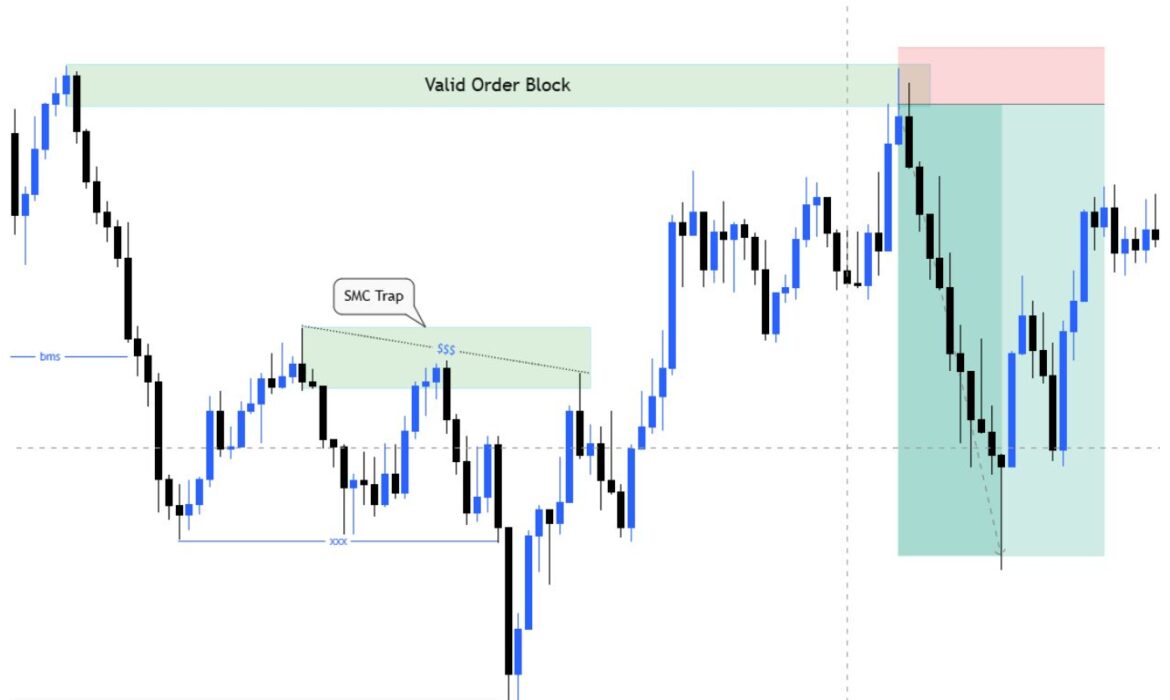
SMC Traps for Beginners: Trade Smart, Not Trapped
What Is an “SMC Trap”?
An SMC trap happens when the price looks like it will go one way, but big traders (smart money) push it the opposite way to collect stop-losses from smaller traders.
Quick example: The price breaks above a key level, making you think it will keep going up, but then it suddenly drops hard because banks wanted to grab all the buy stops sitting there before the real move down.
Think of it like a mouse trap with cheese—the breakout is the cheese, and when small traders bite, the SMC trap snaps and takes their money.
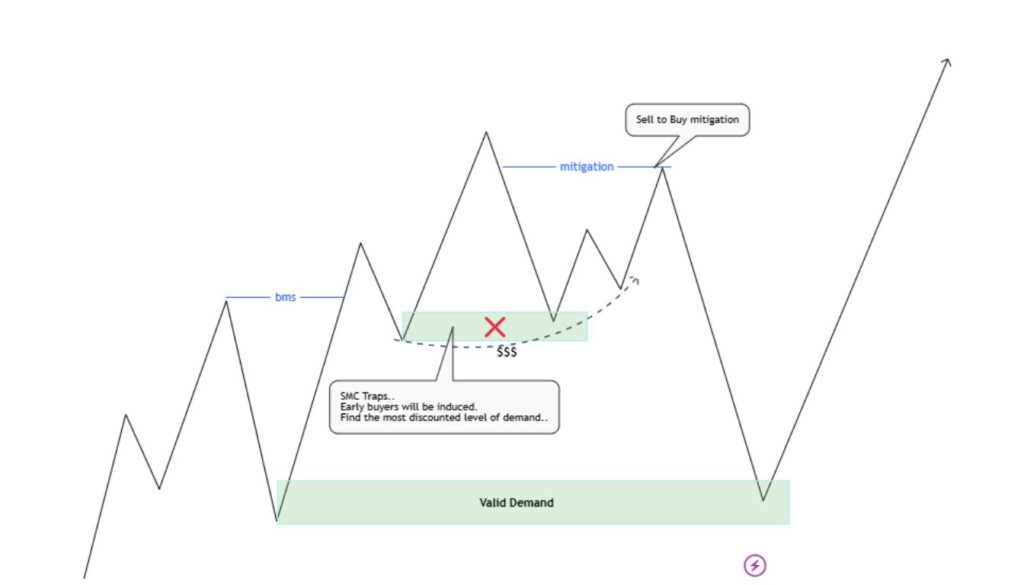
How an SMC Trap Looks on a Chart
There are three main shapes you will see when smart money sets a trap:
1. Stop-Hunt Wick The price shoots above or below a key level with a long thin line (wick), then closes back inside the range. Imagine a tall spike that pokes through a line and comes right back—that’s the wick grabbing stops.
2. Fake Breakout SMC Price breaks a support or resistance level, maybe even closes one or two candles outside, then reverses completely. It looks like a real breakout but isn’t—the door opened, traders walked in, then the door slammed shut.
3. Liquidity Sweep Tecknique Price quickly touches an obvious high or low where many stops sit, then immediately reverses. Picture a hand reaching into a cookie jar (liquidity pool), grabbing cookies (stop orders), and pulling back fast.
All three shapes share one thing: sharp move, quick reversal, and trapped traders left on the wrong side.
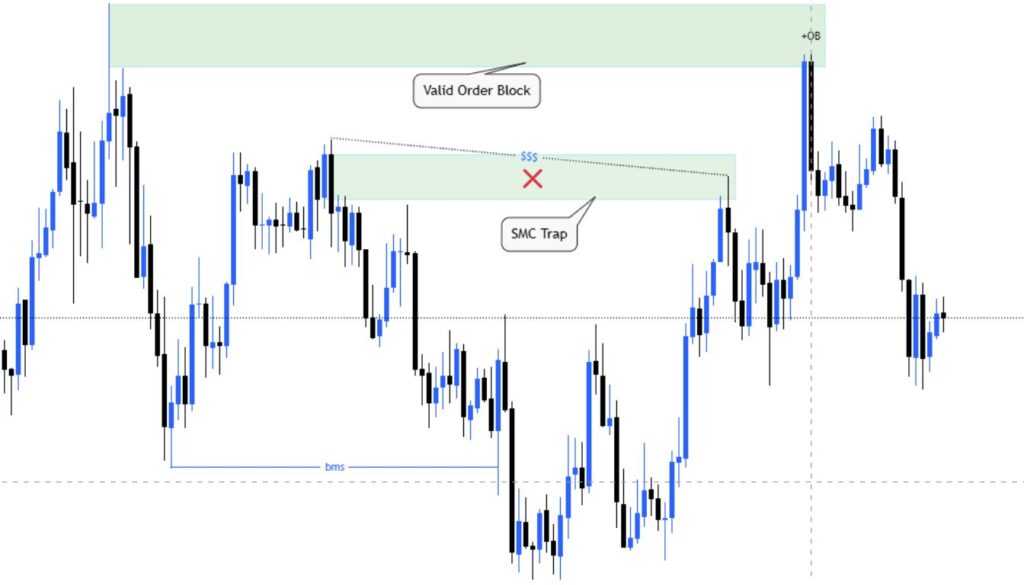
Step-by-Step Example Trade
Let’s walk through a real EUR/USD SMC trap trade:
Setup: EUR/USD has been falling. There’s a clear low at 1.16578 where price bounced before.
The Trap: Price drops to 1.16685, breaking the low by 5 pips with a sharp wick, then closes back at 1.16878.
Your Entry: You enter a buy at 1.16626 after the wick closes, knowing smart money just grabbed sell stops below 1.16578.
Your Stop-Loss: Place it at 1.16578, giving 49 pips of room below the SMC trap zone.
Your Take-Profit: Target the next resistance at 1.16892, giving you 266 pips.
Risk-to-Reward: You risk 49 pips to make 266 pips—that’s 1:6 ratio.
Outcome Scenarios:
- Win: Price rallies to 1.16892, you make 266 pips.
- Loss: Price keeps falling, you lose 49 pips.
- Breakeven: You move stop to entry once price hits 1.16626.
This SMC trap worked because the wick was sharp, volume spiked, and the level was obvious to everyone.
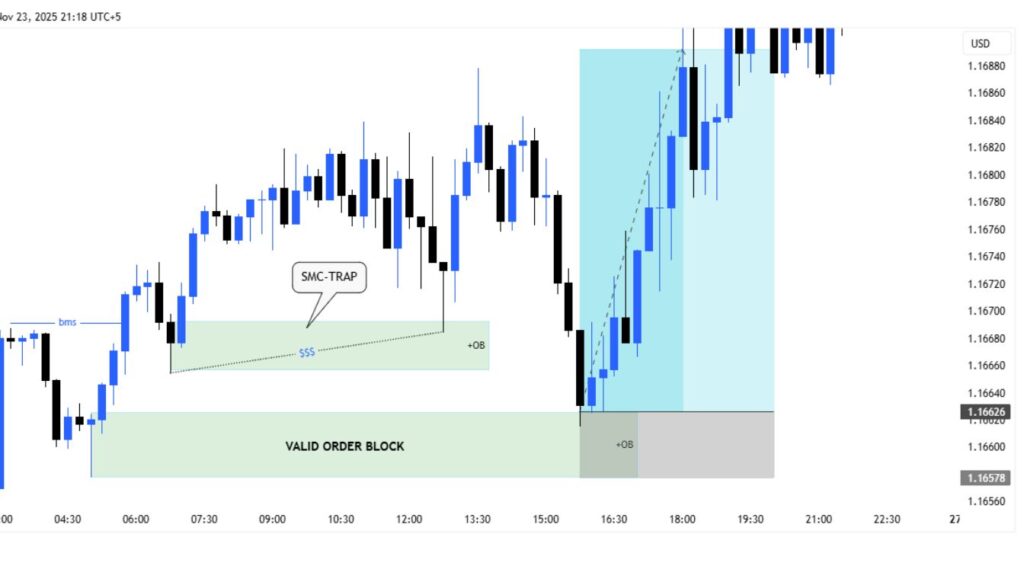
SMC Trap Detection Checklist (One-Page Cheat Sheet)
Use this quick Yes/No list before every trade:
✅ Key Level Present? Is there an obvious high, low, or support/resistance everyone can see?
✅ Volume Spike? Did volume jump when the SMC trap formed?
✅ Wick into Liquidity? Is there a sharp wick poking through the level?
✅ Multi-Timeframe Match? Does the higher timeframe support this direction?
✅ Order Block Trap Setup? Is there a supply or demand zone trap close by?
✅ No Major News? Check the economic calendar—nothing high-impact in next 2 hours?
✅ Clean Structure? Is the SMC trap easy to see, not messy?
✅ Enough Risk-Reward? Can you get at least 1:2 ratio?
If you get 6 out of 8 “Yes” answers, the SMC trap is strong. If 4 or fewer, skip the trade.
Quick Decision Flow: When to Trade / When to Skip
Follow this simple five-step process:
Step 1: Is there high-impact news in the next 2 hours?
- Yes → Skip the trade.
- No → Go to Step 2.
Step 2: Is there a clear key level with obvious liquidity?
- No → Skip.
- Yes → Go to Step 3.
Step 3: Did price create a sharp wick or smart money false move at that level(False Breakout)?
- No → Wait for better setup.
- Yes → Go to Step 4.
Step 4: Does the higher timeframe trend support your direction?
- No → Skip or reduce size.
- Yes → Go to Step 5.
Step 5: Can you get 1:2 risk-reward or better with safe stop placement?
- No → Skip.
- Yes → Take the trade.
This flowchart keeps you disciplined and protects you from forcing trades.
Simple Backtest Plan for SMC Traps (Beginner Friendly)
Testing past trades helps you learn what works. Here’s how:
Step 1: Open your chart replay tool and go back 3 months.
Step 2: Mark 30 clear SMC trap setups you find.
Step 3: Create a simple spreadsheet with these columns: Date, Pair, Entry, Stop, Target, Win/Loss, Pips.
Step 4: For each setup, record what would have happened if you traded it.
Example Row:
- Date: Jan 15
- Pair: GBP/USD
- Entry: 1.2700
- Stop: 1.2680
- Target: 1.2750
- Result: Win
- Pips: +50
Step 5: After 30 trades, calculate your win rate (wins ÷ total trades) and average reward-to-risk.
If your win rate is above 40% with 1:2 RR, your strategy can be profitable.
Journal Template for SMC Trap Trades
Date: _________
Symbol: _________
Timeframe: _________
SMC Trap Type: (Stop-hunt / False breakout / False Liquidity sweep)
Entry Price: _________
Stop-Loss: _________
Take-Profit: _________
Position Size: _________
Checklist Score: ___/8
Reason for Trade: _________________________________
Emotions Before: (Calm / Excited / Nervous / Other)
Outcome: (Win / Loss / Breakeven)
Lessons Learned: _________________________________
Example Filled Row:
- Date: Jan 20, 2025
- Symbol: EUR/USD
- Timeframe: 15min
- SMC Trap Type: Liquidity sweep
- Entry: 1.0512
- Stop-Loss: 1.0490
- Take-Profit: 1.0600
- Position Size: 0.5 lots
- Checklist: 7/8
- Reason: Sharp wick below 1.0500, volume spike, higher TF bullish
- Emotions: Calm
- Outcome: Win
- Lesson: Patience paid off—waited for wick close
Position Sizing & Stop Methods
Here’s the simple math to never risk too much:
Formula 1 — Risk Amount: Risk % × Account Balance = Risk Amount
Example: 1% × $10,000 = $100 risk per trade
Formula 2 — Position Size: Position Size = Risk Amount ÷ (Entry Price − Stop-Loss Price)
Example: $100 ÷ (1.0512 − 1.0490) = $100 ÷ 0.0022 = 45,454 units (0.45 lots in forex)
ATR-Based Stop Sizing: Use the Average True Range (ATR) indicator—place your stop 1.5× the ATR value away from entry to avoid random noise.
These formulas protect your account from big losses.
Multi-Timeframe Rules for SMC Traps
Use three timeframes for best results:
Higher Timeframe (Trend): Check the 4-hour or daily chart—what’s the big direction? Only trade traps that align with this trend.
Signal Timeframe (Setup): Use the 15-minute or 1-hour chart—this is where you find the SMC trap forming.
Micro Entry (Timing): Use the 5-minute or 1-minute chart—this is where you enter after the trap confirms.
Dos:
- Trade traps on the signal timeframe that match the higher timeframe direction
- Wait for micro timeframe smc trap confirmation
Don’ts:
- Don’t fight the higher timeframe trend
- Don’t enter on micro timeframe without checking bigger picture
Strong traps happen when all three timeframes agree.
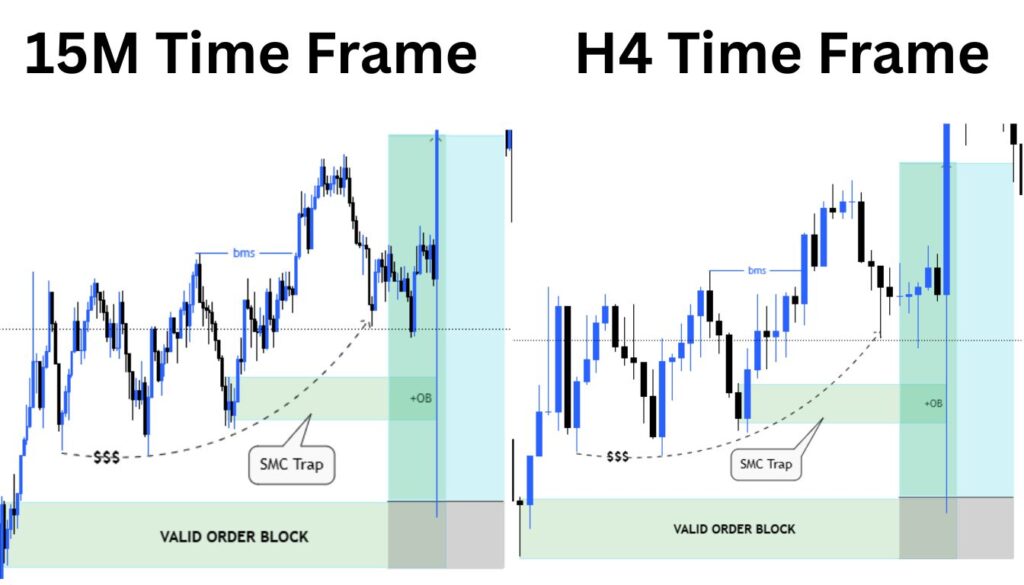
Order Book & Order-Flow Basics for Spotting Traps
The order book shows you where big orders sit waiting:
What You See:
- Bid side: Buy orders waiting below current price
- Ask side: Sell orders waiting above current price
Big Resting Orders: Large size numbers at key levels mean institutions are waiting there—these are liquidity pools.
Liquidity Sweeps: When price suddenly touches these levels and the big orders disappear fast, that’s liquidity trap smc.
How It Relates to Traps: If you see huge buy orders at $42,000 and price dips to $41,995 then bounces hard, the SMC trap just absorbed those stops.
Not all brokers show the real order book—crypto exchanges show it best.
Platform & Data Checklist (What to Watch For)
Make sure your tools are reliable:
✅ Reliable Broker/Exchange: Choose regulated brokers with good reviews—avoid shady platforms.
✅ Real-Time Data Feed: Delayed data makes you miss traps or enter late.
✅ Volume Type: Real volume is better than tick volume (forex often shows tick volume).
✅ Replay Tool: Essential for backtesting—TradingView and some platforms have this.
✅ Order Book Access: Helpful for crypto; less available in forex.
✅ Low Candle Delay: Check that candles close on time, not seconds late.
Bad tools lead to bad trades—test everything in demo first.
Market-Specific Notes: Forex vs Crypto vs Stocks
Forex: Traps often happen at London/New York session open when liquidity is highest. Watch for traps around major round numbers (1.1000, 1.2000). Spreads are tight, so stops can be closer.
Crypto: Traps happen 24/7 but are strongest during overlap hours. Crypto is more volatile—use wider stops and smaller position sizes. Liquidation levels on exchanges create huge traps.
Stocks: Traps form at market open (9:30 AM EST) and around earnings reports. Lower liquidity in pre-market means bigger spreads. Insider activity can create traps regular traders can’t predict.
Adapt your SMC trap strategy to each market’s personality.
Common Mistakes with SMC Traps + How to Fix Them
Mistake 1: Chasing Entries
Fix: Wait for the trap candle to fully close before entering.
Mistake 2: Stop Too Tight
Fix: Place stop beyond the entire trap zone, not just the wick tip.
Mistake 3: Ignoring Liquidity Context
Fix: Only trade traps at obvious levels where many stops sit.
Mistake 4: Trading Every Trap
Fix: Be selective—take only A+ setups that pass your checklist.
Mistake 5: No Multi-Timeframe Check
Fix: Always confirm higher timeframe supports your direction.
Mistake 6: Overtrading
Fix: Set a maximum of 3 trap trades per day.
One small fix at a time improves your results.
Mini Case Studies: 3 Real-World Traps (Short Stories)
Forex Story — EUR/USD London Open Trap: Price sat at 1.0800 overnight. At London open, it spiked to 1.0820, breaking resistance. New traders bought the breakout. Within 10 minutes, price crashed to 1.0760. Smart money grabbed buy stops above 1.0815, then pushed down hard. Lesson: Don’t trust breakouts right at session open.
Crypto Story — Bitcoin Liquidation Trap: Bitcoin traded at $30,000 with huge long positions at $30,500. Price shot to $30,550, liquidating longs, then dropped to $28,500 in one hour. Traders who shorted after the trap made 2,000 points. Lesson: Watch funding rates and liquidation levels.
Stock Story — Apple Earnings Trap: Apple had earnings after close. Pre-market it gapped up $5, hitting $180. Day traders bought the gap. By 10 AM, price reversed to $173. Smart money sold into retail excitement. Lesson: Earnings create emotional traps—wait for the dust to settle.
Confluence Tools — What to Use (and What to Avoid)
High-Value Confirmations (Use These):
- Volume Spike: Sharp increase when trap forms shows real activity.
- Order Block Confirmation: Price returning to a previous supply/demand zone.
- Fair Value Gap (FVG) Fill: Price filling an imbalance before reversing.
- Higher Timeframe Structure: Break of structure or change of character on bigger chart.
Low-Value Traps (Avoid These):
- Overusing Lagging Indicators: Too many moving averages clutter your view.
- Ignoring Price Action: Relying only on oscillators without watching actual candles.
- Too Many Indicators: Using 5+ indicators creates confusion, not clarity.
Keep it simple—use 2-3 strong confluences maximum.
Quick Risk Rules & Simple Ruleset to Follow
Rule 1: Never risk more than 1-2% of your account on one trade.
Rule 2: Take maximum 3 SMC trap trades per day.
Rule 3: If you lose 5% of your account in one week, stop trading until next week.
Rule 4: Always use a stop-loss—no exceptions, ever.
Rule 5: Don’t trade 30 minutes before and after high-impact news.
Rule 6: If you’re emotional (angry, overexcited, scared), close your platform.
These simple rules keep you in the game long-term.
Printable One-Page SMC Trap Playbook
═══ SMC TRAP PLAYBOOK ═══
Definition: Smart money pushes price to grab stops, then reverses.
Visual Signs: Stop-hunt wick, false breakout, liquidity sweep.
Checklist (need 6/8): □ Key level visible
□ Volume spike
□ Sharp wick
□ Multi-TF match
□ Order block near
□ No major news
□ Clean structure
□ Good RR (1:2+)
Position Sizing: Risk % × Account = Risk Amount
Risk Amount ÷ (Entry − Stop) = Position Size
Skip Rules:
- Major news coming
- Messy structure
- Poor RR
- Against higher TF
Example: EUR/USD drops to 1.0495, wicks, closes 1.0510. Enter buy 1.0512, stop 1.0490, target 1.0600. Risk 22 pips, gain 88 pips = 1:4 RR.
═══════════════════
Print this and keep it at your desk.
Short Glossary of SMC Terms
Order Block: A zone where big banks placed large buy or sell orders, leaving footprints on the chart.
FVG (Fair Value Gap): An empty space between candles where price moved so fast it left a gap—price often returns to fill it.
BOS trap(Break of Structure trap): When price breaks an important high or low, showing a new trend direction.
ChoCH (Change of Character): When price behavior changes, like going from big moves to small moves, signaling a shift.
Liquidity: Areas where many stop-losses sit, like honey for smart money bees.
Stop Hunt SMC: When market maker trap and push price to hit stop-losses on purpose, grabbing liquidity.
Liquidity Pool: A cluster of stops at obvious levels—smart money targets these.
Inducement in SMC: The bait (like breaking a level) that tricks traders into entering the wrong way.
SMC Liquidity Manipulation: The trap period when smart money tricks everyone before the real move.
Supply Zone: An area where sellers are strong, usually at a previous high.
Demand Zone: An area where buyers are strong, usually at a previous low.
Sweep: A quick touch of liquidity then immediate reversal.
How to Use a Trading Journal to Improve (30-Day Plan)
Week 1 (Days 1-7): Log every trade you take with full details—entry, exit, reason, emotions. Just collect data, no judgments.
Week 2 (Days 8-14): Keep logging. At end of week, review all trades and count wins vs losses. Find your biggest mistake (like chasing entries).
Week 3 (Days 15-21): Continue logging. Focus on fixing one mistake you found in Week 2. Write a reminder note: “Wait for candle close.”
Week 4 (Days 22-30): Log every trade. At month-end, calculate your win rate, average RR, and total pips. Compare Week 4 to Week 1—did you improve?
Repeat: Start Month 2, finding and fixing your next biggest mistake.
Small improvements each month create big results over time.
Simple Metrics to Judge If Your SMC Strategy Works
Win Rate: (Number of Wins ÷ Total Trades) × 100
Example: 12 wins out of 30 trades = 40% win rate
Average Reward-to-Risk (RR): Add all your RR ratios and divide by number of trades.
Example: (2 + 3 + 1.5 + 2.5) ÷ 4 = 2.25 average RR
Expectancy: (Win Rate × Average Win) − (Loss Rate × Average Loss)
Example: (0.4 × $200) − (0.6 × $100) = $80 − $60 = +$20 per trade
Why Expectancy Matters: Even with 40% win rate, if your winners are big enough, you still make money over time. Positive expectancy means your strategy has an edge.
If your expectancy is negative, your strategy loses money long-term—time to adjust.
When SMC Traps Might Fail — Edge Cases to Know
Major News Events: During NFP, Fed announcements, or surprise news, traps can fail because fundamentals overpower technicals. Skip trading 30 minutes before/after.
Illiquid Hours: Asian session or holiday trading has low volume—traps may not complete because not enough liquidity moves price.
Exchange Outages: If your broker or exchange has technical issues, price may not reach targets or stops may not execute.
Spoofing: When fake large orders appear then disappear in the order book—this confuses trap signals. Watch for orders that vanish before getting filled.
Flash Crashes: Rare sudden drops or spikes from algorithm errors—your stop might get hit unfairly at crazy prices.
What to Do: Avoid trading during known illiquid times, always check news calendars, and use limit orders when possible to control fills.
Ethics & Broker Issues: Fair Play and Slippage
Slippage: When your order fills at a different price than you clicked—happens in fast markets. A few pips is normal; 20+ pips is suspicious.
Bad Fills: If your stop constantly gets hit at the worst possible price, your broker might be hunting your stops. Test fills in demo for a month first.
Choosing a Fair Broker: Look for regulated brokers (FCA, ASIC, CFTC), read reviews, check average execution speed, and test their platform in demo.
Fair Play: Remember, SMC traps aren’t illegal—they’re how Market maker(big institutions) manage their large positions. You’re learning to read their footprints, not doing anything wrong.
Red Flags: Brokers who freeze your platform during volatility, constantly requote prices, or have many complaints about withdrawals—avoid them.
Always start with demo trading to test if your broker executes orders fairly.
Extras: Small Tool & Resource List
Replay Tool: TradingView has a bar replay feature—use it to practice finding traps in past data.
DOM (Depth of Market): Shows the order book—available on most crypto exchanges and some futures platforms.
Volume-at-Price: Displays volume as horizontal bars at different price levels—helps find liquidity zones.
Heatmaps: Some platforms show liquidation heatmaps for crypto—see where liquidations cluster.
Economic Calendar: Forex Factory and Investing.com show upcoming news events—essential to avoid trap failures.
Footprint Charts: Advanced tool showing buy vs sell volume at each price level—useful for spotting large players.
Where to Find: Most features are in TradingView, broker platforms like Think or Swim, or crypto exchanges like Binance and Bybit.
Expanded FAQ Additions (Simple Answers)
Question: How long does it take to learn SMC traps?
Answer: About 3-6 months of daily practice. First month learning the patterns, second month backtesting, third month demo trading, then slowly go live with small size.
Question: How much money do I need to start?
Answer: Start with $500-$1,000 in demo money first. When you’re profitable in demo for 2 months, you can start live with $500-$2,000 depending on your market (forex needs less, stocks need more).
Question: Can I automate SMC traps?
Answer: It’s very difficult because traps need context, order flow, and quick decisions. Most algorithms miss the “smart money” read. Manual trading works better for traps.
Question: Are Smart money concept traps illegal?
Answer: No! SMC is just reading what Market Maker do. It’s legal analysis of public price data. You’re not manipulating anything—you’re observing manipulation by others.
Question: Do SMC traps work in all markets?
Answer: They work best in liquid markets (major forex pairs, Bitcoin, large-cap stocks). In tiny stocks or exotic pairs, there isn’t enough liquidity for clean SMC traps.
Question: What if I keep losing even with good setups?
Answer: Check three things: (1) Is your stop too tight? (2) Are you entering too early? (3) Is your broker execution fair? Fix these one at a time.
Question: Should I use indicators with SMC traps?
Answer: Keep it simple—volume and maybe ATR for stop sizing. Too many indicators distract from reading pure price action and liquidity.
Question: How many traps should I take per week?
Answer: Quality over quantity. Even 2-3 perfect setups per week is enough if they’re high-probability. Don’t force trades.