
What Are Bar Chart Patterns?
Have you ever watched the price of a stock go up and down? That movement creates shapes on a chart. These shapes are called chart patterns.
Think of it like reading a map. The price tells you a story. When you learn to read that story, you can make smarter trading decisions.
Price moves because people are buying and selling. Sometimes it goes up. Sometimes it goes down. Sometimes it just moves sideways.
When price makes the same shapes again and again, we call them bar chart patterns. Traders use this bar chart patterns cheat sheet to quickly remember what each shape means.
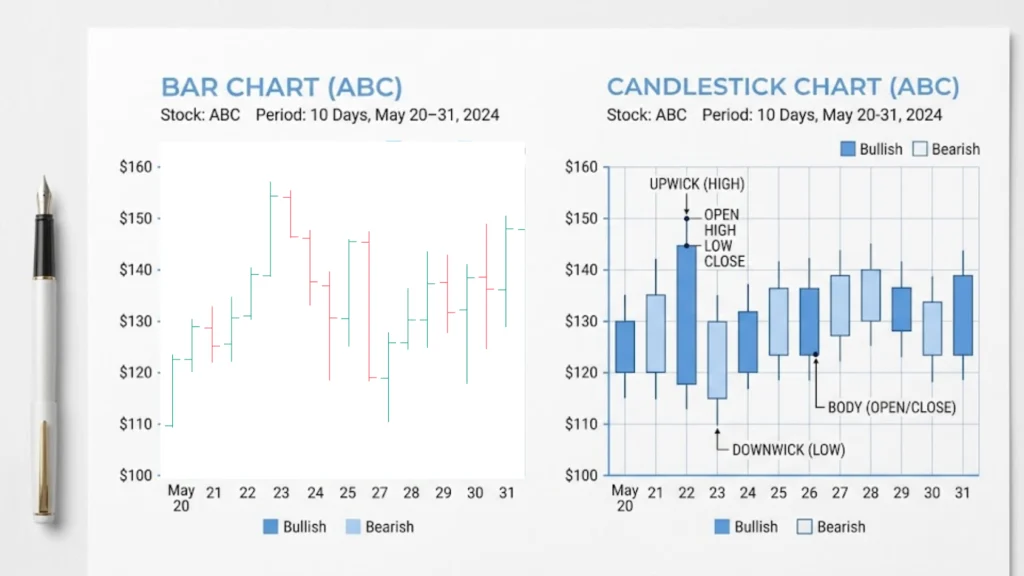
What Is a Bar Chart vs Candlestick Chart?
a)What Does a Bar Chart Look Like?
A bar chart shows price using simple vertical lines. Each bar has:
- A top = highest price
- A bottom = lowest price
- A left tick = opening price
- A right tick = closing price
It looks like a simple stick with two small lines on the sides.
b)How Is It Different from a Candlestick?
A candlestick has a thick body in the middle. That body shows you the open and close price clearly. It also uses colors — green for up, red for down.
A bar chart uses just lines. It is simpler but gives the same information. Many professional traders prefer bar charts because they look clean and are less distracting.
Both show the same price data. The difference is only in how they look. This bar chart trading strategies guide works with both styles.
Why Do Chart Patterns Work?
Chart patterns work because of human emotions. People trade based on fear and greed. These emotions repeat over and over.
When price goes up a lot, people get greedy and buy more. When price drops, people get scared and sell. This cycle creates the same shapes on charts again and again.
That is why technical analysis chart patterns are so powerful. You are not just reading lines. You are reading how people feel about the market.
Patterns work across all markets — stocks, forex, and crypto. They also work on all timeframes. This is why this stock chart patterns cheat sheet is so useful.
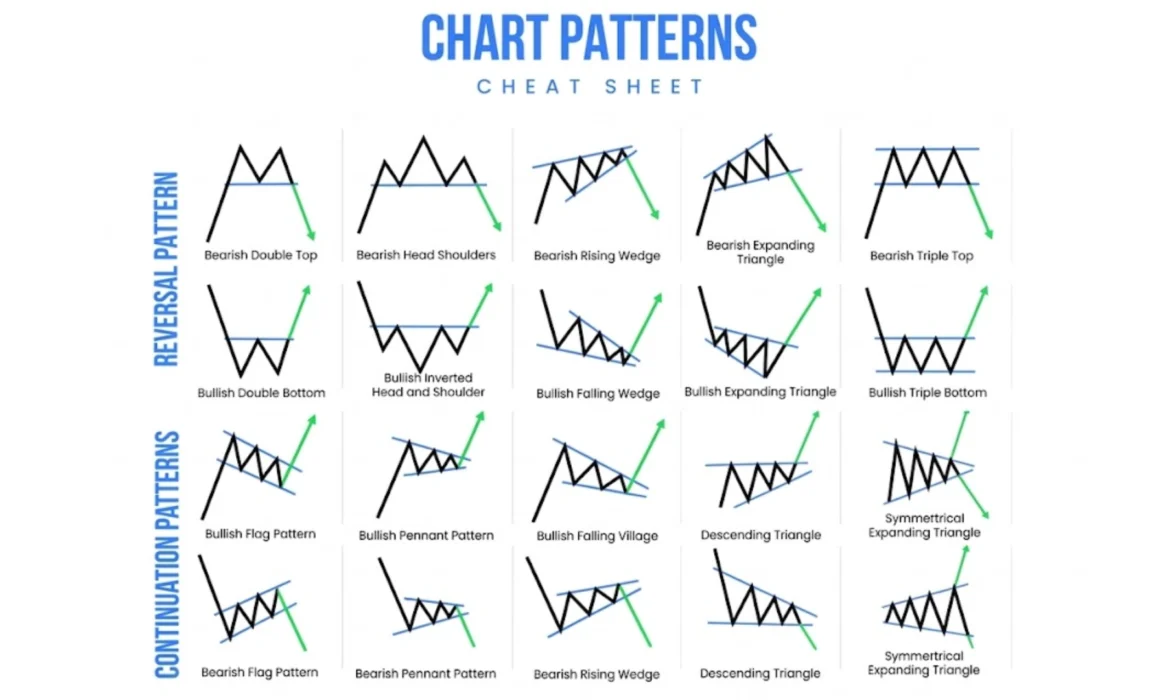
Quick Bar Chart Patterns Cheat Sheet (Easy Table)
This is your trading patterns quick reference table. Save it. Print it. Use it every day.
| Pattern Name | Bullish or Bearish | What Usually Happens |
|---|---|---|
| Head and Shoulders | Bearish | Price reverses and goes down |
| Inverse Head & Shoulders | Bullish | Price reverses and goes up |
| Double Top | Bearish | Price fails twice and drops |
| Double Bottom | Bullish | Price bounces twice and rises |
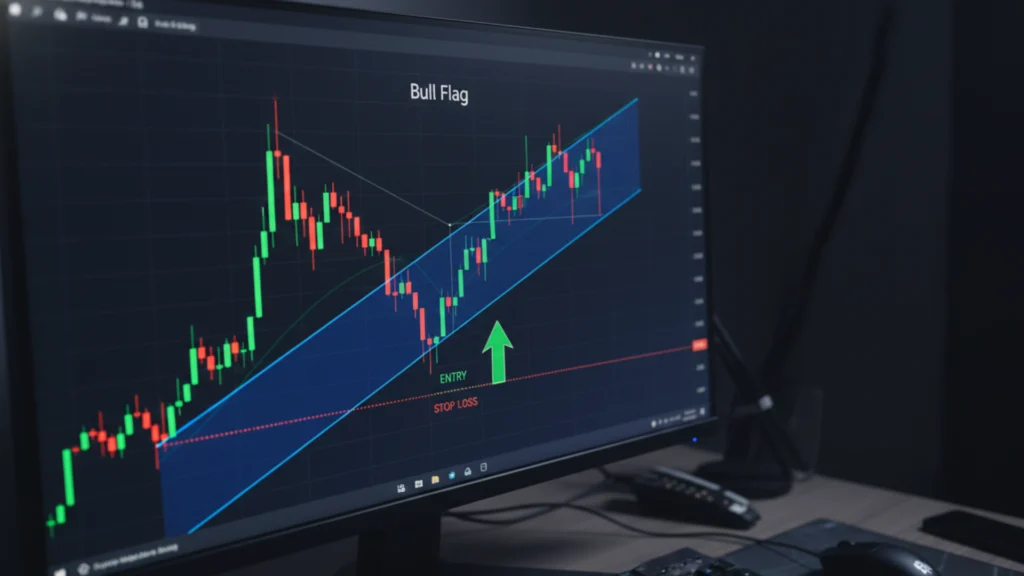
| Bull Flag | Bullish | Price continues moving up |
| Bear Flag | Bearish | Price continues moving down |
| Ascending Triangle | Bullish | Price breaks out upward |
| Descending Triangle | Bearish | Price breaks down lower |
| Cup and Handle | Bullish | Price forms a cup shape then rises |
| Symmetrical Triangle | Neutral | Price can break either way |
| Rising Wedge | Bearish | Price breaks down after rising |
| Falling Wedge | Bullish | Price breaks up after falling |
This visual chart patterns cheat sheet gives you a fast look at all common chart patterns explained in one place.
How to Spot Chart Patterns with Your Eyes
Look for Highs and Lows
Every pattern is made of highs and lows. Look at the peaks (tops) and valleys (bottoms) of the price.
- If highs are getting lower → price is weakening
- If lows are getting higher → price is getting stronger
Look for Trendlines
Connect the highs with a line. Connect the lows with another line. Do they form a triangle? A wedge? A channel?
That shape is your pattern. Chart pattern recognition starts with these two simple steps. Once you practice, your eyes will start seeing patterns naturally.
Most Important Patterns You Should Learn First
Do not try to learn everything at once. Here are the best chart patterns for beginners to start with:
- Double Top — Easy to see, very reliable bearish signal
- Double Bottom — Great bullish reversal to trade
- Head and Shoulders — Classic reversal pattern
- Bull Flag — Simple and fast continuation setup
- Ascending Triangle — Clear breakout pattern
- Falling Wedge — Strong bullish reversal signal
- Cup and Handle — Great for swing trading
These are easy chart patterns to learn and show up often in real markets. Master these seven first before moving on to advanced setups.
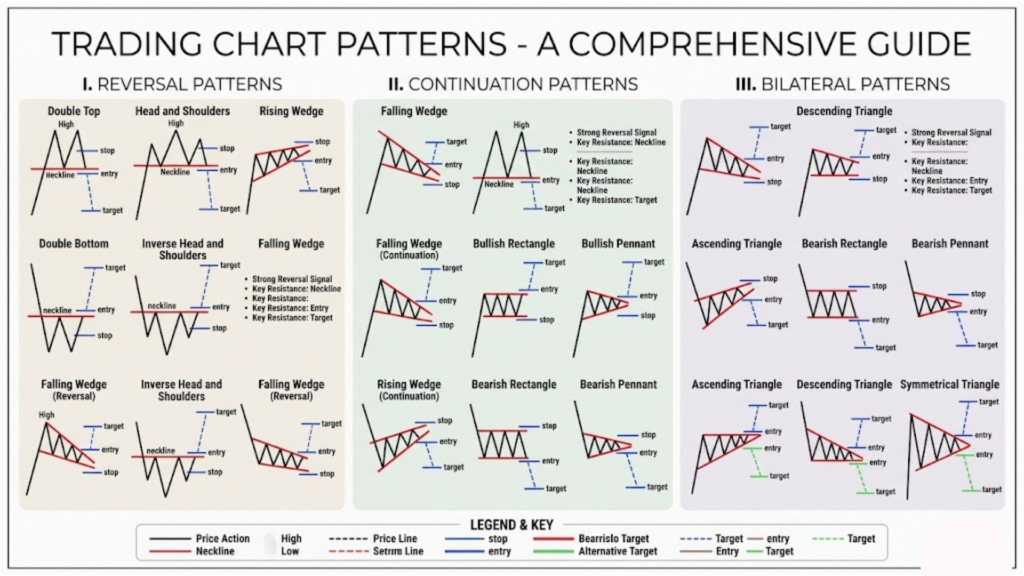
Reversal vs Continuation Patterns (Simple Difference)
Reversal Patterns
A reversal chart patterns guide teaches you that reversal means the trend is about to change direction.
If price was going up and a reversal pattern forms, price will likely go down. Examples: Head and Shoulders, Double Top, Rising Wedge.
Continuation Patterns
Continuation patterns in trading mean the trend will keep going in the same direction.
If price was going up and a continuation pattern forms, price will likely keep going up. Examples: Bull Flag, Ascending Triangle, Cup and Handle.
This is one of the most important things in your bar chart patterns cheat sheet.
Similar Patterns Compared (Avoid Confusion)
Triangle vs Wedge
Both look like a triangle. The difference is the angle.
- Triangle — One side is flat (horizontal)
- Wedge — Both sides slope in the same direction
Flag vs Pennant
Both come after a strong price move.
- Flag — Looks like a rectangle, price moves sideways
- Pennant — Looks like a small triangle, price compresses
Knowing the difference helps you avoid mistakes in your forex chart patterns cheat sheet or crypto chart patterns guide.
Step-by-Step: How to Trade Any Chart Pattern
Follow this simple process every time:
Step 1: Find the Pattern Look at the chart and identify the shape.
Step 2: Wait for the Breakout Do not enter early. Wait for price to break above or below the pattern boundary.
Step 3: Enter the Trade Enter after the candle closes outside the pattern with strong momentum.
Step 4: Set Your Stop Loss Place your stop loss just inside the pattern. This protects your money.
Step 5: Take Your Profit Use the size of the pattern to set your target. If the pattern was 50 points tall, aim for 50 points of profit.
This is the core of any pattern trading strategy guide and works for all markets.
Common Mistakes Beginners Make
Entering Too Early
Many beginners jump in before the breakout happens. Wait for confirmation. Patience is your best tool.
Ignoring Volume
Volume tells you how strong a breakout is. A breakout with high volume is much stronger than one with low volume.
Forcing Patterns
Not every chart has a clear pattern. Sometimes price is messy. Do not try to force a shape that is not really there. Only trade when the pattern is clear and clean.
These mistakes come up in every beginner chart patterns tutorial, so pay close attention.
Risk Management Made Easy
Even the best high probability chart patterns can fail. That is why risk management is so important.
- Never risk more than 1-2% of your money on one trade
- Always use a stop loss — no exceptions
- Do not revenge trade if you lose
Think of trading like a business. Every business has expenses. Losses are just the cost of trading. Keep them small and controlled.
Do Chart Patterns Always Work? (Honest Truth)
No. Chart patterns do not always work. Nothing in trading works 100% of the time.
Patterns give you probability, not certainty. A good pattern might work 60-70% of the time. That means it fails 30-40% of the time.
The goal is not to be right every time. The goal is to make more money when you win than you lose when you fail. That is what price action patterns list strategies teach.
Best Timeframes for Chart Patterns
Short Timeframes (5 min, 15 min)
These are used by day trading chart patterns traders. Patterns form fast but are less reliable.
Medium Timeframes (1 hour, 4 hour)
These are popular with swing trading patterns guide users. Good balance of speed and reliability.
Long Timeframes (Daily, Weekly)
Patterns on the daily and weekly chart are the most reliable. They take longer to form but give stronger signals.
Start with the daily chart. It is the easiest for beginners.
Best Market Conditions for Patterns
Trending Markets
Patterns work best when the market is trending. Continuation patterns like flags and triangles appear during strong trends.
Sideways Markets
In sideways markets, look for reversal patterns like Double Tops and Double Bottoms. Support and resistance patterns are very clear in these conditions.
Avoid trading patterns during very choppy or news-driven markets. The signals are unreliable.
Real-Life Example of a Chart Pattern Trade
Here is a simple story to make it real:
“Apple stock was moving up strongly for 3 weeks. Then price slowed down and formed a small Bull Flag. Price compressed inside the flag for 5 days. Then one morning, price broke above the flag with strong volume. A trader entered the trade. They put their stop loss below the flag. Price moved up another 8% in two weeks. They took profit and closed the trade.”
This is exactly how chart patterns with entry and exit work in real life. The process is simple. Find → Wait → Enter → Protect → Profit.
How to Combine Chart Patterns with Indicators
Patterns alone are strong. But combining them with indicators makes them even better.
Moving Averages — If price breaks out above a pattern AND above the 50-day moving average, the signal is stronger.
RSI (Relative Strength Index) — If RSI is rising when a bullish pattern forms, it confirms the move. If RSI is overbought when a bearish pattern forms, the reversal is more likely.
This is an advanced chart pattern setup that even intermediate traders use. It is one of the smartest ways to use your bar chart patterns cheat sheet in real trading.
How Candlestick Patterns Help Chart Patterns
Candlestick patterns are like a second opinion. Use them to confirm your bar chart signal.
For example:
- You see a Double Bottom on the bar chart
- The second bottom forms with a Bullish Engulfing candlestick
- Now you have two confirmations → stronger signal
Candlestick patterns do not replace your price action cheat sheet — they add to it. The two work together beautifully.
Printable Bar Chart Patterns Cheat Sheet (Summary)
Here is your quick summary — your trading cheat sheet PDF patterns reference:
- ✅ Bar charts show Open, High, Low, Close with vertical bars
- ✅ Patterns form because emotions repeat in markets
- ✅ Reversal patterns = trend changes
- ✅ Continuation patterns = trend continues
- ✅ Always wait for breakout before entering
- ✅ Use stop loss on every trade
- ✅ Combine patterns with RSI and Moving Averages
- ✅ Daily charts give most reliable signals
- ✅ Never risk more than 2% per trade
- ✅ Volume confirms breakouts
This bar chart patterns cheat sheet covers everything a trader needs to get started.
FAQs
Question: Are chart patterns reliable?
Answer: Yes, but not perfect. Good patterns work 60-70% of the time when traded correctly with proper risk management.
Question: Which pattern is best for beginners?
Answer: The Double Bottom and Bull Flag are the easy chart patterns to learn first. They are simple, clear, and appear often.
Question: Can beginners use chart patterns?
Answer: Absolutely. This beginner chart patterns tutorial was designed for new traders. Start with the top 5 patterns and practice on a demo account first.
Question: Do patterns work in forex and crypto?
Answer: Yes! This forex chart patterns cheat sheet and crypto chart patterns guide apply the same patterns across all markets.
Question: How long does it take to learn chart patterns?
Answer: With daily practice, most beginners feel comfortable within 4-8 weeks.
Final Tips for Beginners
You now have a complete bar chart patterns cheat sheet in your hands. Here is how to use it well:
Keep it simple. Do not learn 50 patterns at once. Learn 5. Master them. Then add more.
Practice on paper first. Use a demo account or just draw patterns by hand before risking real money.
Look at old charts. Go back in time and find patterns. See what happened after each one. This is the fastest way to learn.
Be patient. The best traders wait for perfect setups. Not every day has a great pattern.
Stay consistent. Trading is a skill. Skills take time. Keep going, keep learning, and the results will come.
You now have everything you need to start your journey with technical analysis for beginners. Use this guide. Come back to it often. And trade smart!