
What Is a Bearish Harami?
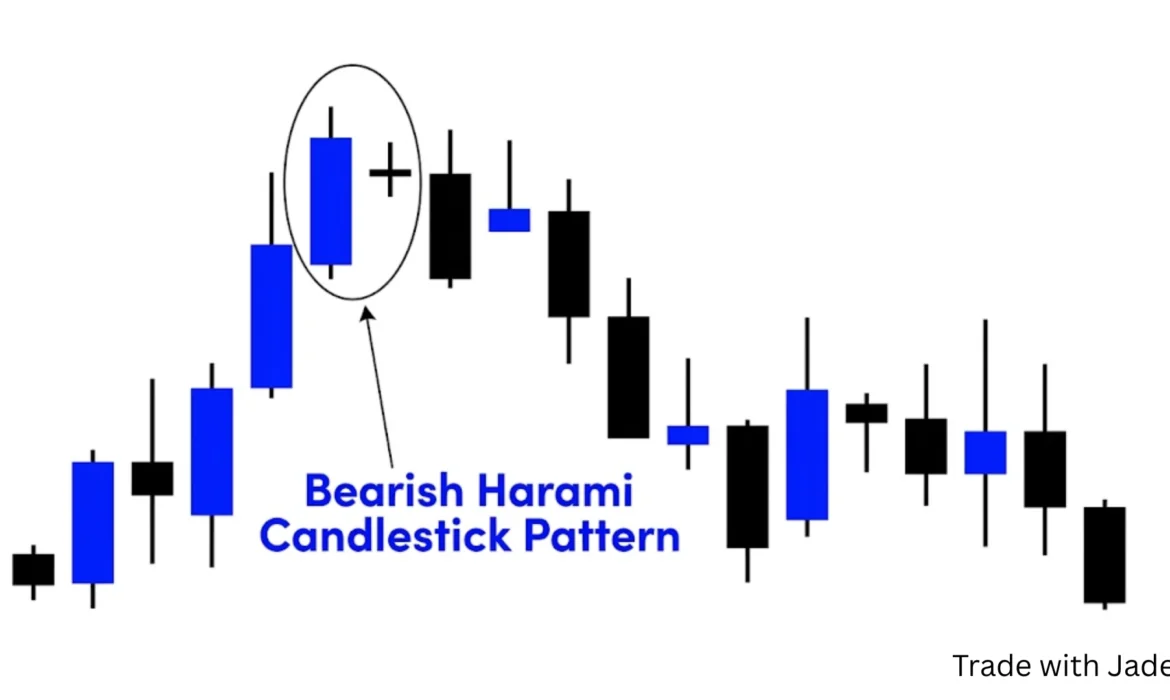
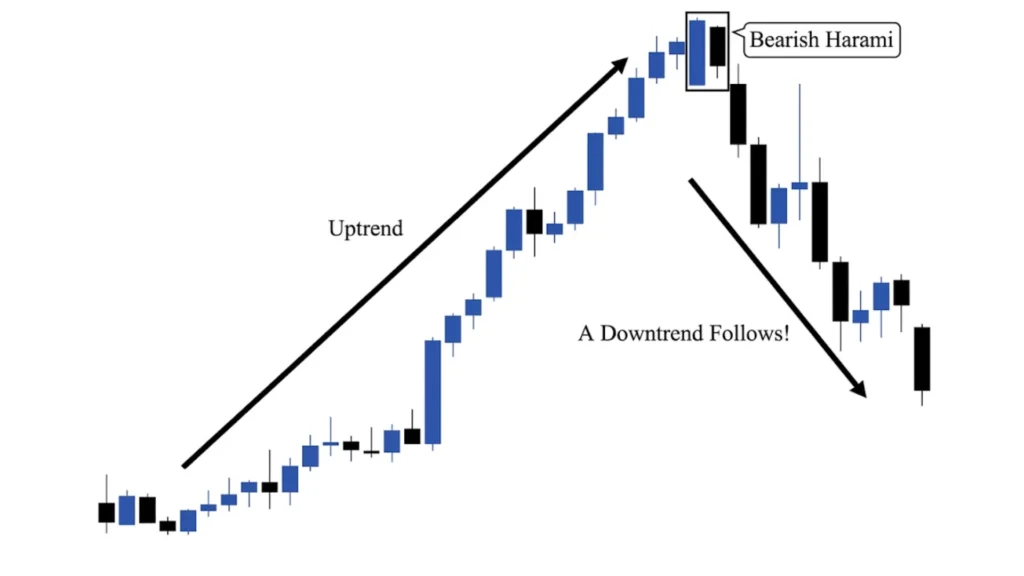
The bearish harami pattern is a two-candle pattern found on candlestick charts. It shows up during an uptrend and warns traders that the price might stop going up or even reverse down.
The word “harami” comes from Japanese. It means “pregnant.” Why? Because the second small candle sits inside the body of the first big candle — just like a baby inside a mother.
Simple Definition
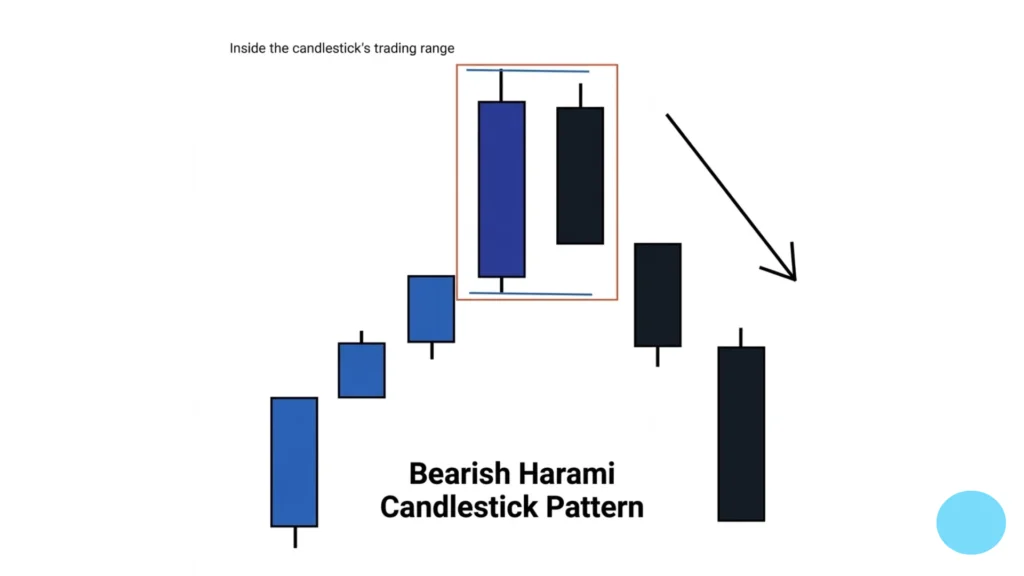
A bearish harami pattern has two candles:
- The first candle is big and green (bullish)
- The second candle is small and fits inside the first one
That’s it. Simple, right?
Why Traders Care About It
Traders love the bearish harami candlestick because it gives an early warning. It says, “Hey, buyers are getting tired. Sellers might take over soon.” This helps traders plan their next move before the price actually falls.
Bearish Harami Explained
Let’s make this really easy with a story.
“Strong Buyers Getting Weak” Story
Imagine a team of runners. On Day 1, they run super fast. They are full of energy. That’s the big green candle — buyers pushing prices up hard.
On Day 2, the same runners try again. But now they are tired. They slow down. They can barely move. That’s the small candle — buyers losing their strength.
Easy Analogy
Think of it like pushing a heavy box uphill. You push hard at first. But near the top, you slow down. You’re exhausted. The box might just stop — or roll back down.
That’s exactly what the bearish harami shows in price action.

What Does a Bearish Harami Look Like?
First Candle (Big Bullish)
The first candle is tall and green. It means buyers were in full control. Price moved up a lot during this session.
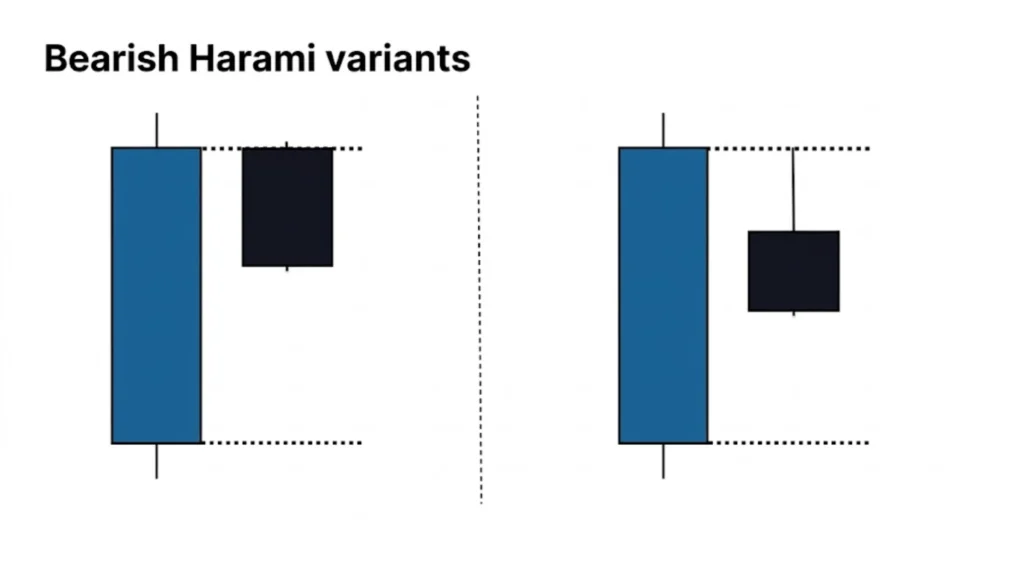
Second Candle (Small Inside)
The second candle is small. It can be red or green. But the key thing? Its body must sit fully inside the body of the first candle. Price didn’t move much at all.
Visual Explanation in Steps
Here’s how to read it step by step:
- Look for an uptrend (price going up)
- Spot a big green candle
- Find a small candle right after it
- Make sure the small candle is inside the big one
- That’s your bearish harami pattern!
Quick Checklist to Identify Bearish Harami
Use this simple checklist every time:
- ✅ Uptrend before the Bearish Harami pattern
- ✅ Big green candle appears
- ✅ Small candle forms right after
- ✅ Small candle body is inside the big candle body
- ✅ Appears near a resistance level (bonus point!)
If you check all these boxes, you likely have a valid bearish harami setup.
What Does a Bearish Harami Indicate?
Buyers Losing Strength
When the second candle is tiny, it means buyers couldn’t push price higher. Their energy is fading.
Sellers Entering
Sellers start to notice this weakness. They begin to enter the market and push prices down a little.
Possible Trend Reversal or Pause
The bearish reversal pattern doesn’t always mean a full crash. Sometimes price just slows down. But it’s a clear warning sign that something is changing.
Psychology Behind Bearish Harami
Day 1: Buyers Strong
Buyers are excited. Everyone is buying. Price shoots up. The big green candle forms.
Day 2: Confusion Starts
The next day, buyers try again. But sellers also show up. Neither side wins big. The candle stays small and stuck inside Day 1’s range.
What This Means for Price
This confusion is a red flag. When buyers can’t push higher after a strong day, sellers often take control next. That’s the bearish trend reversal signal hiding in plain sight.

Real Market Examples
Example in Stocks (e.g., Apple)
Imagine Apple stock climbing up for three days. Then a big green candle appears. The very next day, a small candle forms inside it — right near a major resistance zone. This is a classic bearish harami in stocks. Many traders would watch for a confirmation candle before selling.
Example in Crypto (e.g., Bitcoin)
Bitcoin rallies hard in a bull run. After a massive green candle, a tiny candle appears. Volume drops too. This is a strong crypto bearish harami setup — especially when RSI is above 70 (overbought zone).
Example in Forex (e.g., EUR/USD)
EUR/USD pushes up during the London session. A big bullish candle forms. The next candle is tiny and sits inside. Near a known resistance level, this forex bearish harami pattern gets traders ready to sell.
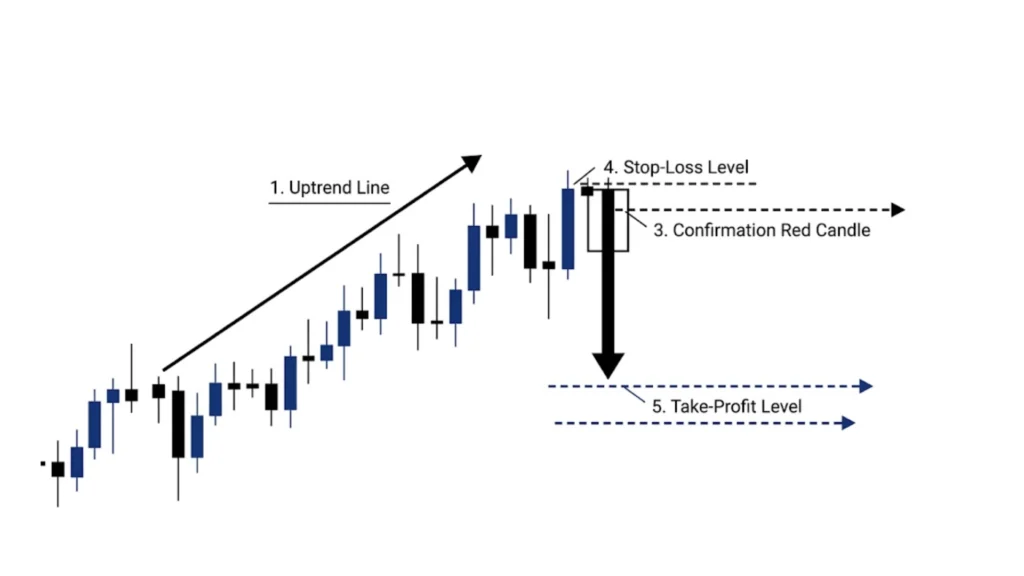
Step-by-Step Bearish Harami Trading Plan
Here’s a simple plan anyone can follow:
- Find an uptrend — price should be going up before thebearish harami pattern
- Spot the pattern — big green candle + small candle inside
- Wait for confirmation — the next candle should be red and close lower
- Enter the trade — sell (short) after confirmation candle closes
- Set stop-loss — place it above the high of the first big candle
- Set take-profit — aim for the nearest support level below
This is a simple but solid bearish harami pattern trading strategy for beginners.
Best Trading Strategies for Bearish Harami Pattern
Trading with Resistance Levels
When the bearish harami forms at a resistance level, the signal becomes much stronger. Resistance is where price has struggled to go higher before. Combine that with the bearish harami pattern, and sellers have two reasons to act.
Using RSI Indicator
If RSI is above 70 when the pattern forms, that means the market is overbought. A bearish harami with RSI in overbought territory is a powerful combo for finding reversals.
Using Moving Averages
If price is far above the 50-day or 200-day moving average and a bearish harami shows up, it could snap back down toward the average. This is called mean reversion.
Using Volume Confirmation
Bearish harami with volume dropping on the second candle confirms buyers are losing interest. Always check volume — it tells you how serious the move is.
Using Fibonacci Levels
If the bearish harami pattern appears near a 61.8% or 78.6% Fibonacci retracement level, it adds even more weight to the signal. Price loves to reverse at Fibonacci zones.
When You Should NOT Trade a Bearish Harami
Not every bearish harami is worth trading. Avoid it when:
- The uptrend is very strong with no signs of slowing
- There’s no resistance level nearby
- No confirmation candle appears after the bearish harami pattern
- Volume is very low — signal may be fake
Patience is everything in candlestick trading for beginners.
Best Timeframes for Bearish Harami
- 1-minute chart — too noisy, too many false signals. Avoid.
- 15-min / 1-hour chart — good for day traders, decent signals
- Daily chart — strongest signals. Bearish harami accuracy is highest here
The daily timeframe filters out all the market noise and gives the cleanest bearish candlestick signals.
Bearish Harami Pattern vs Other Candlestick Patterns
Bearish Harami vs Bearish Engulfing
| Feature | Bearish Harami Pattern | Bearish Engulfing Pattern |
|---|---|---|
| Candle size | Small second candle | Second candle is bigger |
| Strength | Moderate | Stronger signal |
| Confirmation needed | Yes | Sometimes |
The bearish harami vs engulfing comparison shows that engulfing is more aggressive, while harami is more cautious.
Bearish Harami vs Doji
A bearish harami vs doji — a doji has almost no body at all. It shows even more confusion than harami. Both signal hesitation, but doji is more extreme.
Bearish Harami vs Shooting Star
A shooting star has a long upper wick and small body. It’s a one-candle pattern. Bearish harami vs shooting star — shooting star is easier to spot but harami gives more structural context.
What Happens After a Bearish Harami?
Three things can happen:
- Price goes down — successful reversal, sellers win
- Price moves sideways — indecision continues, wait for next signal
- Pattern fails — buyers come back, price keeps going up
Always use a stop-loss because no pattern works 100% of the time.
Volume Made Simple: Why It Matters
- High volume on second candle = strong signal, sellers are serious
- Low volume on second candle = weak signal, may be a fake-out
Volume is like a vote. More votes = more conviction. Always check it before trading any bearish harami pattern.
Bearish Harami for Day Trading vs Swing Trading
- Day trading — use 15-min or 1-hour charts, quick entries and exits, tight stop-loss
- Swing trading — use daily or weekly charts, hold trade for days or weeks, bigger profit targets
Both styles work. Pick based on your time and patience.
Advantages of Bearish Harami Pattern
- Easy to spot on any chart
- Gives early warning before reversal
- Works well with indicators like RSI and volume
- Can be used in stocks, forex, and crypto
Disadvantages of Bearish Harami Pattern
- Needs confirmation before trading
- Can give false signals in strong trends
- Not always a strong reversal — sometimes just a pause
- Beginners may misidentify it
Common Beginner Mistakes
- Selling too early — before confirmation candle closes
- Ignoring the trend — trading it in a downtrend won’t work
- No stop-loss — one wrong trade can erase profits
- No confirmation — jumping in just because the two candles appeared
Mini Case Study: Winning vs Losing Trade
Winning trade: Stock in uptrend, hits resistance, bearish harami forms, RSI at 72, confirmation red candle appears, trader enters short, stop above high, price falls 5% — profit!
Losing trade: Bearish harami forms mid-trend with no resistance, no confirmation waited, trader sells early, price continues up — loss!
What we learn: Context + confirmation = better trades.
Myths About Bearish Harami (Truth vs Reality)
- ❌ Myth: It always means price will fall
- ✅ Truth: It needs confirmation and context
- ❌ Myth: It works alone without any indicators
- ✅ Truth: It works best with RSI, volume, and resistance levels
Is Bearish Harami Good for Beginners?
Yes! With the right rules, it’s one of the friendliest candlestick chart patterns to learn. Start by spotting it on historical charts. Practice without real money first. Then slowly apply it live.
The bearish harami meaning is simple. The rules are clear. That makes it perfect for new traders.
Bearish Harami Checklist (Quick Revision)
- ✅ Uptrend present
- ✅ Big bullish candle
- ✅ Small candle inside
- ✅ Confirmation candle closes red
- ✅ Near resistance
- ✅ RSI overbought (bonus)
- ✅ Stop-loss placed above first candle high
Simple Glossary
- Candle — a bar on a chart showing open, close, high, and low price
- Trend — the direction price is moving (up or down)
- Resistance — a price level where buyers struggle to push higher
- Volume — how many shares or contracts were traded in a session
FAQs About Bearish Harami Pattern
Question: What is a bearish harami pattern?
Answer: It’s a two-candle pattern where a small candle forms inside a big bullish candle during an uptrend, signaling a possible reversal.
Question: How accurate is bearish harami?
Answer: Bearish harami accuracy improves when used with confirmation, resistance levels, and volume. Alone, it’s moderate — around 50-60% reliability.
Question: Is it reliable?
Answer: It’s reliable when all conditions are met. Never trade it in isolation.
Question: What is the best timeframe?
Answer: The daily chart gives the strongest signals. The 1-hour chart works well for day traders.
Question: Can beginners use it?
Answer: Absolutely. It’s one of the simplest two candle reversal patterns to learn and apply.
Final Summary
The bearish harami pattern is a simple, powerful candlestick signal. It shows buyers slowing down during an uptrend. When a big green candle is followed by a small inside candle, the market is sending a warning: something might be changing.
Use it with confirmation, resistance, RSI, and volume. Always use a stop-loss. Avoid trading it blindly without context.
Whether you trade stocks, forex, or crypto — learning the bearish harami pattern is a smart step toward better technical analysis. Keep practicing, stay patient, and let the chart tell its story.