
Introduction to CISD Trading
If you’ve been exploring smart money concepts or ICT methodology, you’ve probably heard about cisd trading. It’s one of the most powerful ideas in modern price action trading. But many traders still don’t fully understand what it means or how to use it properly.
This guide will walk you through everything — from the basics to advanced techniques. Whether you’re new or experienced, you’ll find real value here.
What You Will Learn in This Guide
By the end of this article, you’ll know what cisd trading is, why it happens, how to spot it on a chart, and how to build a trading strategy around it. You’ll also learn how it fits with other ICT tools like order blocks and fair value gaps.
Why CISD Trading is Popular Among ICT Traders
CISD trading has grown in popularity because it gives traders a clear signal that the market is switching direction. It helps you stop guessing and start reading price movement with more confidence. Traders love it because it’s clean, logical, and based on real market mechanics.
Who Should Use CISD Trading Strategy
This guide is perfect for anyone learning ICT concepts, price action traders, forex traders, and crypto traders who want to understand how institutional money moves markets.
What is CISD in Trading?
What is Change in State of Delivery (CISD)?
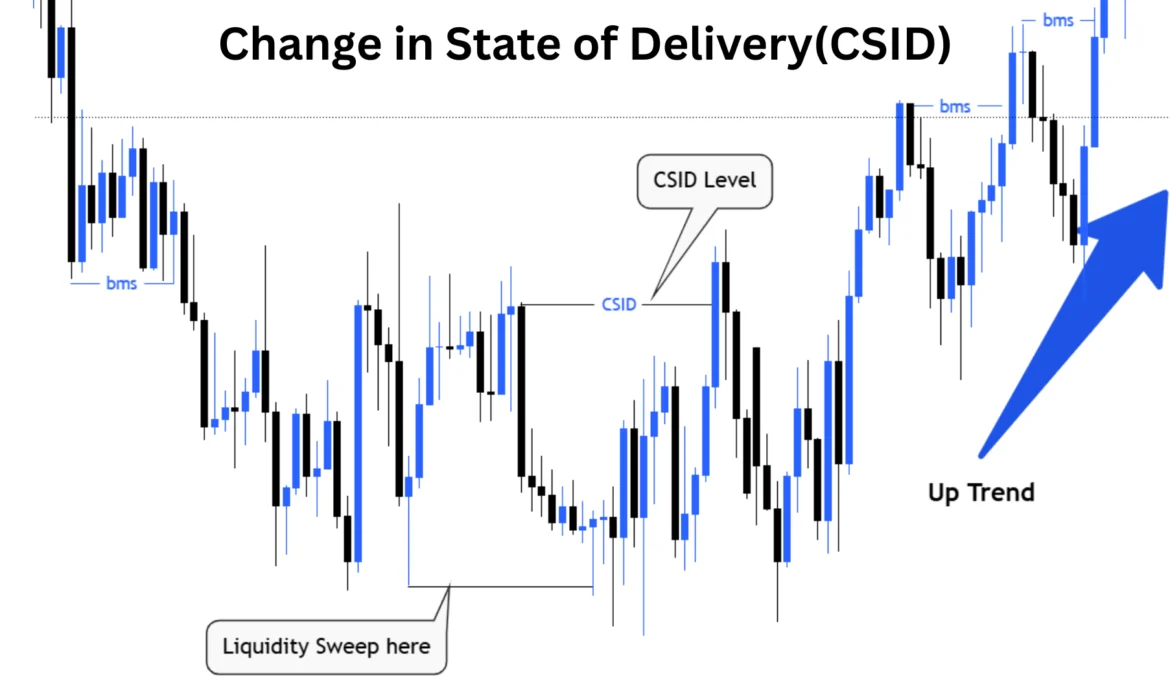
CISD stands for Change in State of Delivery. In simple words, it means the market has shifted from delivering price in one direction to delivering it in the opposite direction. Think of it like a truck that was moving north suddenly turning around and heading south.
What is ICT Change in the State of Delivery?
In ICT (Inner Circle Trader) methodology, a change in state of delivery happens when the market transitions from a bullish delivery (price going up) to a bearish delivery (price going down), or vice versa. This shift tells us that the big players — institutions and banks — have changed their intention.
Features of CISD
CISD is clean and visible on the chart. It happens after a liquidity sweep. It signals a real shift in who controls the market — buyers or sellers. It works across multiple timeframes and markets.
Technical Meaning of Delivery Shift in Markets
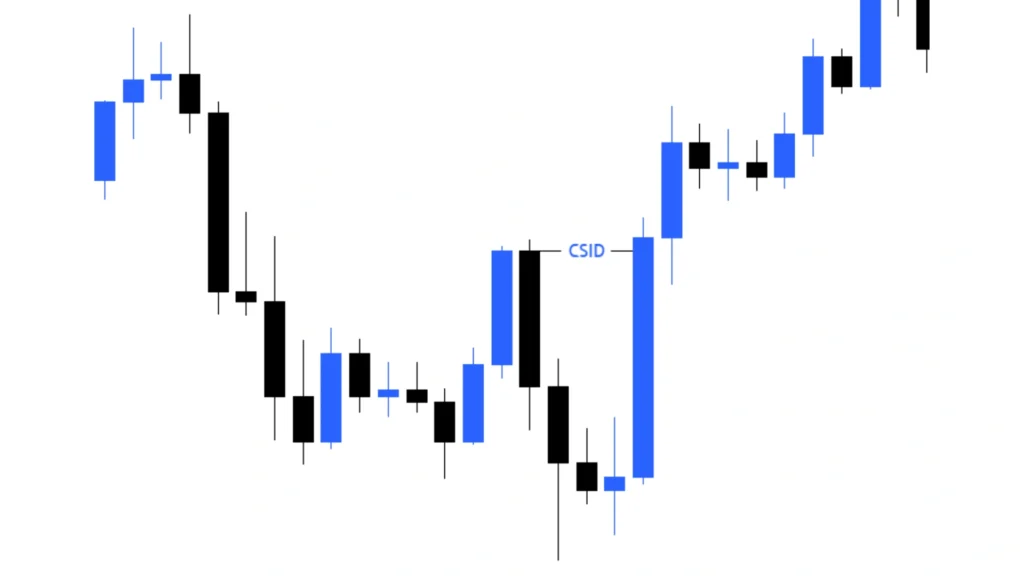
Technically, CISD is confirmed when a candle or series of candles closes beyond a previous swing point in the opposite direction after a liquidity grab. This confirms that the old delivery state is over and a new one has begun.
Who Created the CISD Concept?
Background of ICT Methodology
ICT methodology was developed to help retail traders understand how banks and institutions move the market. It includes concepts like order blocks, fair value gaps, liquidity pools, and of course, CISD trading.
Role of Michael Huddleston in Developing CISD
Michael Huddleston, known online as The Inner Circle Trader (ICT), is the creator of this concept. He built it as part of his larger smart money framework to help traders identify when the market is genuinely shifting direction — not just retracing.
Why CISD Happens in the Market
Buyer vs Seller Control Shift
CISD happens when the balance of power in the market flips. When buyers are in control, price moves up. When sellers take over, price moves down. CISD marks the exact point of that power shift.
Liquidity and Order Flow Explanation
Before a CISD forms, institutions usually sweep liquidity — they push price into an area where retail traders have placed their stop losses. After collecting that liquidity, the institutions reverse price. This reversal is the beginning of the CISD.
Market Psychology Behind CISD
Retail traders often get trapped on the wrong side of the market. They enter a trade, price moves against them, they get stopped out — and then price goes in the direction they originally thought. CISD helps you see this trap before it catches you.

Market Structure Basics You Must Understand First
What is Market Structure?
Market structure is the pattern of highs and lows on a price chart. An uptrend makes higher highs and higher lows. A downtrend makes lower lows and lower highs. Understanding this is essential for cisd trading strategy.
What is Market Structure Shift (MSS)?
A Market Structure Shift (MSS) happens when price breaks a significant swing point, signaling that the trend may be changing. For example, in an uptrend, if price breaks a recent higher low, that’s an MSS.
What is Change of Character (CHoCH)?
CHoCH is another concept that marks early signs of a trend change. It’s a subtle shift — not as strong as MSS. Think of CHoCH as the first hint and MSS as the confirmation.
Difference Between MSS, CHoCH, and CISD
CHoCH is the first sign of weakness. MSS is the structural break. CISD is the confirmation that price has fully switched its delivery direction. They are related but different in timing and strength.
How to Identify CISD on the Chart
Key Signs of CISD Formation
Look for a liquidity sweep followed by strong opposite-direction candles. There should be a clear break of a previous swing high or low. Volume should increase at the CISD point.
What to Look for Before CISD Appears
Before a CISD forms, price usually runs into a liquidity pool — an area with clustered stop losses. Once that sweep happens, watch for the reversal.
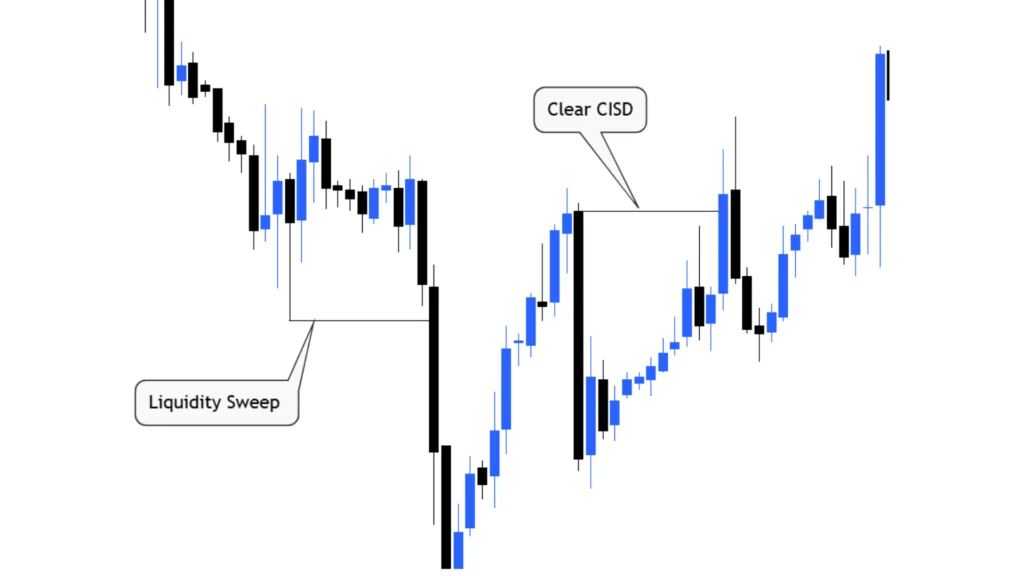
Liquidity Sweep Detection Method
A liquidity sweep looks like a wick or spike beyond a previous high or low, followed by a fast rejection. That rejection is your first clue that a CISD might be forming.
Bullish CISD
How to Identify a Bullish CISD
A bullish CISD forms when price sweeps below a low (taking out sell-side liquidity), then aggressively returns upward and breaks above a recent swing high. This tells us that buyers have taken control.
Conditions for Valid Bullish Setup
Price must sweep liquidity first. The reversal candles must be strong and decisive. The CISD point should align with a key support zone or order block.
Bearish CISD
How to Identify a Bearish CISD
A bearish CISD forms when price sweeps above a high (taking out buy-side liquidity), then drops sharply and breaks below a recent swing low. This tells us sellers are now in control.
Conditions for Valid Bearish Setup
The sweep must happen at or near a premium zone. Reversal candles should close strongly. Confirmation from a higher timeframe adds more validity.
Key Levels to Watch When Identifying CISD
Liquidity Pools
These are areas where lots of stop losses sit — above old highs or below old lows. Institutions target these first before reversing price.
Order Blocks
An order block is a zone where institutional orders were placed. When price returns to these zones after a CISD, it often continues the new direction.
Premium and Discount Zones
Premium zones are in the upper half of a price range — good for selling. Discount zones are in the lower half — good for buying. CISD setups are stronger when they form in these zones.
Support and Resistance
Classic support and resistance levels add extra weight to a CISD signal. When a CISD forms at a well-known resistance or support level, it’s a high-probability setup.
CISD vs Other ICT Concepts
ICT CISD vs ICT MSS
MSS tells you the structure has broken. CISD tells you the market has switched how it’s delivering price. CISD is a deeper confirmation.
CISD vs CHoCH
CHoCH is early and subtle. CISD is later and more confirmed. For cisd trading, you want to wait for the CISD rather than acting too early on CHoCH.
MSS vs CISD
MSS happens first. CISD follows. Both are important, but CISD gives a stronger signal for entry.
Difference in Price Basis Between MSS and CISD
MSS focuses on the break of a swing point. CISD focuses on a full delivery shift — meaning multiple candles confirming the new direction.
Order of Occurrence Between MSS and CISD
First comes the liquidity sweep → then CHoCH → then MSS → then CISD. Each step confirms the next.
Multi-Timeframe CISD Trading
Importance of Higher Timeframe Bias
Before trading any CISD, always check the higher timeframe. If the daily chart is bullish, only take bullish CISD setups on lower timeframes.
Multi-Timeframe Analysis Strategy
Use the weekly and daily charts for bias. Use the 4-hour or 1-hour for structure. Use the 15-minute or 5-minute for entry refinement. This is the core of cisd trading strategy across timeframes.
Employing Multiple Timeframes for Accuracy
Combining timeframes reduces false signals. A CISD on the 15-minute chart that aligns with the daily bias is a high-quality trade setup.
In-Depth Multi-Timeframe CISD Trading Examples
Imagine the daily chart is bearish. On the 1-hour chart, price sweeps a high and forms a bearish CISD. On the 5-minute chart, you wait for a small retracement and enter short. All timeframes agree — that’s a powerful cisd trading opportunity.
Step-by-Step CISD Trading Strategy for Beginners
This is your beginner’s guide to cisd trading, broken into simple steps.
Step 1 — Analyze Higher Timeframe: Determine the overall trend and bias using the daily or 4-hour chart.
Step 2 — Identify Liquidity Sweep: Look for price spiking into a liquidity pool and then rejecting sharply.
Step 3 — Confirm CISD Point: Wait for price to break a swing point in the new direction after the sweep.
Step 4 — Entry Strategy: Enter at the CISD candle’s close or wait for a retracement to an order block.
Step 5 — Stop-Loss Placement: Place your stop beyond the liquidity sweep point or the CISD candle’s high/low.
Step 6 — Take-Profit Planning: Target the next liquidity pool, order block, or major swing point.
CISD Entry Models
Aggressive Entry
Enter right at the CISD confirmation candle. This gets you in early but carries more risk. Best for experienced traders who are confident in the setup.
Conservative Entry
Wait for price to return to the CISD point or nearby order block before entering. This reduces risk but may mean missing some moves.
Confirmation Entry
Wait for a smaller timeframe CISD within the larger setup. This triple-layer confirmation gives the highest probability.
How to Trade CISD (Complete Strategy)
How to Trade with Change in State of Delivery
Use the cisd trading tools to find the delivery shift, then align your entry with the new direction. Always wait for the market to prove itself before entering.
Using CISD to Define Daily Bias
Start each trading day by identifying whether price is in a bullish or bearish CISD state on the higher timeframe. This sets your bias for the day.
Market Timing with CISD
CISD works best during active sessions — especially London and New York opens. These are times when institutions are most active and real delivery shifts occur.
Combining CISD with Other ICT Tools
CISD with Order Blocks
When a CISD forms at or near an order block, the setup is much stronger. The order block acts as a launching pad for the new delivery direction.
CISD with Fair Value Gaps (FVG)
After a CISD, price often leaves behind a fair value gap (FVG). Price frequently retraces into that FVG before continuing. This gives you a clean entry point.
CISD with Inverted Fair Value Gap (IFVG)
An IFVG flips its role after a CISD. What was once resistance becomes support, and vice versa. This adds extra precision to your entries.
Validity of MSS and CISD in PD Array Zones
PD array zones — including order blocks, FVGs, and breaker blocks — add significant weight to any CISD signal that forms within them.
Trade Examples
CISD Long Trade Example
Example of CISD in Buy Trades
Price is on the 1-hour chart in a downtrend. It sweeps a key low, taking out stop losses. Then a strong bullish candle forms, closing above the recent swing high. That’s a bullish CISD.
Candle-by-Candle Explanation
Candle 1 sweeps the low. Candle 2 is a small recovery. Candle 3 closes above the swing high — this is the CISD confirmation. Enter on candle 4.
CISD Short Trade Example
CISD in Sell Trades
Price is in an uptrend on the 15-minute chart. It spikes above a key high, grabbing buy-side liquidity. Then price aggressively falls and breaks below the recent swing low. That’s a bearish CISD.
Trade Breakdown
Stop goes above the sweep high. Target is the next major support zone. Risk-to-reward is 3:1 or better.
Trade Example with MSS, CISD, and IFVG
Price first shows CHoCH, then MSS, then CISD. After the CISD, price retraces into an IFVG zone. Enter short at the IFVG with stop above the CISD point. Clean, structured, high-probability cisd trading setup.
Best Timeframes for CISD Trading
Scalping Timeframes
For scalping, use the 1-minute and 5-minute charts. Look for CISD on the 15-minute for direction, then scalp entries on the lower timeframes.
Day Trading Timeframes
The 15-minute and 1-hour charts are ideal for day trading CISD. These give you clear structure without too much noise.
Swing Trading Timeframes
For swing trades, use the 4-hour and daily charts. CISD signals here tend to last several days and offer larger profit potential.
Best Market Conditions for CISD
Trending Markets
CISD works best in trending markets where a clear direction is in place and then suddenly shifts. Ranging markets reduce signal quality.
Session Timing (London / New York)
London open (2 AM–5 AM EST) and New York open (8 AM–11 AM EST) are the best times. These are when institutions are actively placing and moving orders.
High Liquidity Periods
CISD signals are most reliable during high-volume periods. Low volume = slow price action = unreliable signals.
When NOT to Trade CISD
Choppy Markets
If price is moving sideways without clear structure, skip it. You’ll just get whipsawed back and forth with no clean CISD forming.
News Events
Major news events like NFP, CPI, or Fed announcements can create fake CISD signals. Avoid trading right before or during these events.
Low Volume Sessions
The Asian session is usually very quiet. CISD setups here often fail or don’t follow through. Stick to London and New York.
Risk Management for CISD Trading
Risk Per Trade Rules
Never risk more than 1-2% of your account on any single cisd trading setup. This protects you from losing streaks.
Stop-Loss Logic
Your stop should always go beyond the liquidity sweep — the extreme point where price grabbed liquidity before reversing. This is a logical invalidation level.
Position Sizing
Calculate your position size based on the distance between your entry and stop-loss. Use a fixed percentage of account balance, not a fixed dollar amount.
Risk-to-Reward Ratios
Aim for a minimum 2:1 risk-to-reward. Many cisd trading setups naturally offer 3:1 or better when traded correctly.
CISD Indicator Guide
What is CISD Trading Indicator?
The CISD indicator is a tool that automatically identifies change in state of delivery points on your chart. It marks the candle or zone where the shift occurred.
Indicator of CISD Trading
This indicator draws a line or zone at the CISD confirmation point, making it easier to spot setups at a glance without manual analysis.
Effective Configuration of CISD Trading Indicator
Set the indicator to match your trading timeframe. Use it on the 15-minute or 1-hour chart for best results. Don’t over-clutter your chart with too many settings.
How to Trade Using CISD Trading Indicator
Wait for the indicator to mark a CISD zone. Confirm it aligns with your higher timeframe bias. Then look for entry using FVG or order block within that zone.
How to Filter CISD Trading Signals Effectively
Avoiding False Signals
Not every candle that breaks a swing point is a CISD. You must confirm the liquidity sweep happened first. Without the sweep, the signal is weak.
Confirmation Techniques
Use multi-timeframe confluence. Look for order blocks or FVGs near the CISD point. The more confluence you have, the better the signal quality.
Probability Improvement Methods
Track your trades in a journal. Over time, you’ll learn which conditions produce the best results. Stick to your highest-probability setups only.
Advantages and Disadvantages of CISD
Advantages
CISD gives precise entry signals. It works across all markets — forex, crypto, stocks. It’s rooted in institutional logic, making it reliable.
Disadvantages
It requires patience. False signals can occur in choppy markets. It has a learning curve for beginners.
Limitations
CISD doesn’t work well without multi-timeframe analysis. It’s not a standalone strategy — it needs to be combined with other ICT tools for best results.
Common Mistakes Traders Make with CISD
Entering Too Early
Many traders jump in at the first sign of a reversal without waiting for the actual CISD confirmation. This leads to early entries that fail.
Ignoring Higher Timeframe Bias
Trading CISD against the higher timeframe trend is one of the most common and costly mistakes. Always align with the bigger picture.
Overtrading
Not every session will give a clean cisd trading setup. Forcing trades when conditions aren’t right leads to unnecessary losses.
Poor Risk Management
Even if your analysis is perfect, poor position sizing or tight stops in the wrong places can ruin otherwise good trades.
CISD Trading Psychology
Patience and Discipline
CISD rewards waiting. The setup has rules — follow them. Don’t rush. The market will always give another opportunity.
Waiting for Confirmation
Impulsive traders lose. Disciplined traders wait for the liquidity sweep AND the CISD confirmation before entering. That’s the edge.
Managing Emotions During Trades
Once you’re in a trade, let the plan run. Set your stop, set your target, and walk away. Watching every tick will destroy your decision-making.
Tools and Platforms for CISD Trading
Chart Platforms (like TradingView)
TradingView is the most popular platform for cisd trading analysis. It offers clean charts, drawing tools, and custom indicators.
Drawing Tools
Use horizontal lines to mark liquidity pools, rectangles to draw order blocks, and the Fibonacci tool to mark premium/discount zones.
Templates and Layout Tips
Save your chart layout as a template so you don’t have to rebuild it every session. Keep it clean — less clutter means clearer thinking.
How to Practice CISD Trading Without Risk
Demo Accounts
Open a free demo account on any broker. Practice identifying and trading CISD setups with virtual money until you’re consistently profitable.
Backtesting Methods
Go back through historical charts and mark every CISD you can find. Study what happened after each one. This builds your eye and pattern recognition.
Replay Mode Practice
TradingView has a bar replay feature. Use it to replay past markets in real time and practice your cisd trading decisions as if they were live.
CISD PDF Download
Guide Download Section
Many traders look for a CISD PDF to study offline. You can compile the key concepts from this guide — CISD definition, identification rules, entry models, and risk management tips — into a personal PDF reference sheet. Keep it handy while you trade.
FAQs About CISD Trading
Question: What is the best timeframe to trade CISD?
Answer: The 15-minute and 1-hour charts are ideal for most traders. Use higher timeframes to set your bias.
Question: Is CISD Trading good for beginners?
Answer: Yes, with patience. Start with the step-by-step strategy outlined above, use a demo account, and study the examples.
Question: How accurate is CISD?
Answer: When used with proper multi-timeframe analysis and confluence, CISD setups can be very accurate. No strategy is 100%, but CISD is among the better tools.
Question: Does CISD work in Forex and Crypto?
Answer: Absolutely. CISD works in any liquid market — forex, cryptocurrency, stocks, and indices.
Question: What is the difference between CISD and CHoCH?
Answer: CHoCH is the first early sign of a possible reversal. CISD is the confirmed delivery shift. CISD is stronger and more reliable for entries.
Final Summary — How to Start CISD Trading Today
Beginner Action Plan
Start by learning market structure. Then study liquidity and order flow. Practice identifying CISD on demo charts for at least 30 days before going live.
Key Rules to Remember
Always wait for the liquidity sweep. Confirm the CISD. Align with higher timeframe bias. Risk no more than 2% per trade. Keep a trading journal.
Next Steps for Learning
Dive deeper into ICT methodology. Study order blocks, fair value gaps, and market maker models. CISD is one powerful piece of a larger and highly effective trading system.
Conclusion
CISD trading is one of the most precise and logical concepts in the ICT toolkit. It tells you exactly when the market has switched direction — not based on guesswork, but based on real institutional order flow and liquidity mechanics.
Whether you’re trading forex, crypto, or stocks, understanding and applying CISD can truly transform how you read the market. It takes practice, patience, and discipline — but once it clicks, it becomes one of the most valuable tools in your trading arsenal.
Start simple. Learn the rules. Practice every day. And let the market come to you.