
What is a Shooting Star Candlestick?
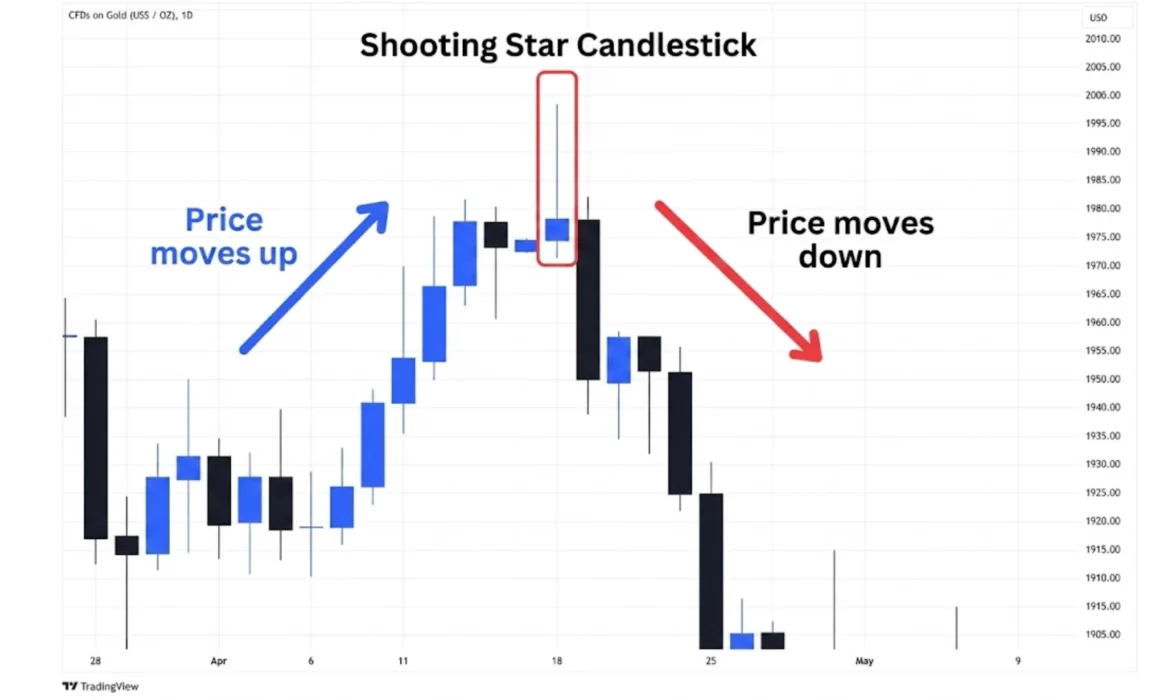
Have you ever seen a star fall from the sky? In trading, a shooting star candlestick works almost the same way. It shows that prices tried to go up really high — but then fell right back down.
It is a single candle that forms on a price chart. Traders use it to spot when a market might stop going up and start falling. It is one of the most popular bearish reversal candlestick patterns in technical analysis.
Think of it like this: buyers pushed the price way up during the session. But then sellers came in strong and pushed it back down. The market rejected the higher price. That rejection is what the shooting star candle shows.
Shooting Star Candlestick Meaning (In One Line)
A shooting star candlestick is a bearish reversal signal that forms after an uptrend, showing that buyers lost control and sellers took over.
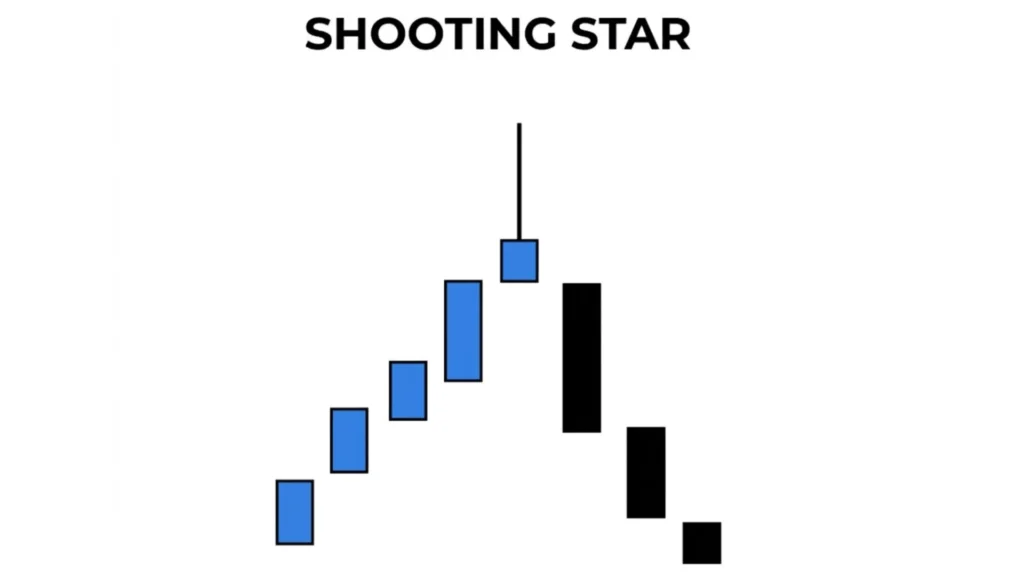
Parts of a Shooting Star Candlestick (Easy Breakdown)
Small Body
The body of the candle is very small. It sits near the bottom of the whole candle. The small body means the price opened and closed at almost the same level. Not much changed between the open and close price.
Long Upper Shadow
This is the most important part. The long upper shadow (or wick) sticks up high. It shows that buyers pushed the price up a lot — but sellers brought it all the way back down. The longer the upper wick, the stronger the bearish price rejection.
Little or No Lower Shadow
A proper shooting star candlestick has little to no lower shadow. If there is a big lower shadow, it may not be a valid shooting star. A clean candle with no lower wick is a stronger signal.
How to Identify a Shooting Star Candlestick on a Chart
Here is a simple checklist you can follow:
- The price must be in an uptrend before the candle forms
- The candle has a small body near the low of the session
- The upper shadow is at least two times longer than the body
- There is little or no lower shadow
- It forms near a resistance level or a recent high
- The candle looks like it tried to go up but got rejected
If your candle matches all these points, you likely found a valid shooting star candlestick pattern.
When Does a Shooting Star Candlestick Form?
After an Uptrend
A shooting star only makes sense after prices have been going up. If you see it in a downtrend or sideways market, it does not carry the same meaning. The uptrend gives context to the reversal signal.
Near Resistance Levels
Most valid shooting stars form near a resistance level. Resistance is a price area where selling pressure is strong. When a shooting star forms there, it adds extra power to the bearish signal. Traders know that the market has rejected that price zone before.
What Does a Shooting Star Tell? (Trader Psychology)
Here is the story behind the candle in plain simple words:
The market was going up. Buyers were excited and kept pushing prices higher. Then, at a high point, buyers tried one last big push. Prices shot up fast during the session.
But then something changed. Sellers saw the high price as a good opportunity to sell. They came in strong. They pushed prices all the way back down to where the session started.
By the end of the session, buyers had nothing to show for their big push. This shift in power — from buyers to sellers — is what the shooting star candle is telling you. It is a sign that the trend may reverse.
Red vs Green Shooting Star Candlestick
Many beginners ask: does the color matter?
Yes, it does — but not as much as the shape.
A red shooting star (bearish candle) means the price closed below the open. This is a stronger signal because sellers clearly won by the end of the session.
A green shooting star (bullish close) means the price closed slightly above the open. It is still valid, but a little weaker. The shape matters more than the color.
Both can work. But always prefer a red shooting star for a stronger bearish shooting star candlestick pattern signal.
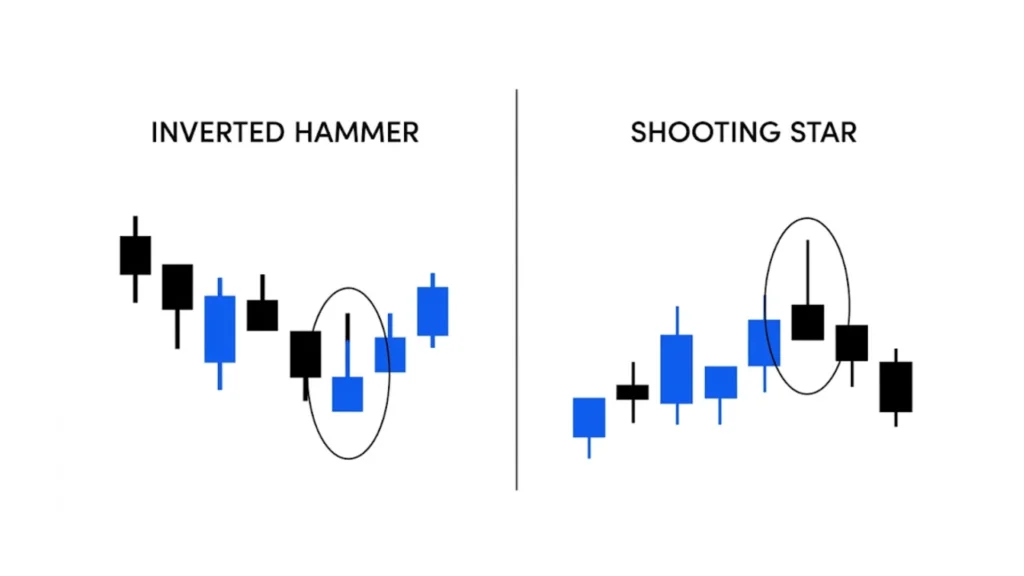
Shooting Star Candlestick vs Inverted Hammer (Key Differences)
These two candles look exactly the same. Same small body, same long upper wick, same little lower shadow. Beginners often confuse them. Here is how to tell them apart:
Shooting Star forms after an uptrend. It signals a bearish reversal. Price may go down.
Inverted Hammer forms after a downtrend. It signals a bullish reversal. Price may go up.
The location on the chart is the key difference. Same shape, opposite meaning. Always check the trend before deciding which one it is.
Shooting Star Candlestick vs Other Bearish Patterns
Bearish Engulfing
The bearish engulfing pattern uses two candles. A big red candle fully covers the previous green candle. It is a stronger and more obvious reversal signal. The shooting star candlestick is subtler but forms faster.
Evening Star
The evening star is a three-candle pattern. It shows a gradual shift from bullish to bearish. It is more reliable but takes longer to form. The shooting star gives the same message in just one candle.
How Accurate is the Shooting Star Pattern?
The shooting star is a solid pattern — but it is not perfect. On its own, studies suggest it has around 50–60% accuracy. That means it does not always work.
Its reliability increases when:
- It forms at a clear resistance level
- Volume is high on the shooting star candle
- The next candle confirms the reversal
- Other indicators support the signal
Never trade any pattern blindly. Always use confirmation.
Confirmation of Shooting Star (Very Important Step)
Next Candle Confirmation
Do not enter a trade the moment you see a shooting star candlestick. Wait for the next candle. If the next candle is a strong red (bearish) candle that closes below the shooting star’s body, that is your confirmation. This shooting star confirmation candle is very important.
Role of Volume
High volume on the shooting star candle shows strong selling pressure. It means more traders were involved in the rejection. A shooting star with volume spike is a much more reliable signal than one with low volume.
Best Timeframes to Use Shooting Star
Intraday vs Daily vs Weekly
Intraday (5-min, 15-min, 1-hour): Works for quick trades. More false signals. Good for experienced traders.
Daily chart: The most popular timeframe for the daily chart shooting star pattern. Signals are more reliable and widely followed.
Weekly chart: Very powerful. Fewer signals but very high accuracy. Great for swing and position traders.
Beginners should start with the daily chart. It gives the best balance of signal quality and trade opportunity.
How to Trade the Shooting Star Candlestick (Step-by-Step)
Entry
Wait for the confirmation candle to close. Once confirmed, enter a short (sell) trade at the open of the candle after confirmation.
Stop Loss
Place your stop loss for shooting star above the high of the shooting star candle. This protects you if the price keeps going up instead of falling.
Take Profit
Target the nearest support level below the entry. You can also use a 1:2 risk-to-reward ratio. For every $1 you risk, aim to make $2.
Simple Trading Example (Real Scenario)
Let’s say a stock has been rising for two weeks. It reaches $150, which is a known resistance level.
On that day, a shooting star forms. The price went up to $158 during the day but closed back at $151. Volume was high. The next day, a red candle closes at $147.
You enter short at $147. Stop loss at $159 (above the shooting star high). Take profit at $135 (support level).
This is a clean shooting star candlestick trading strategy in action. Simple, structured, and disciplined.
Best Indicators to Combine with Shooting Star
RSI
If the RSI shooting star setup shows RSI above 70 (overbought), the signal becomes much stronger. Overbought + shooting star = high-probability sell signal.
Moving Averages
If the price is far above a key moving average (like the 50 or 200 MA), it may be overextended. A shooting star there is a strong reversal warning.
Resistance Levels
Always mark key resistance zones. A resistance level shooting star is the best combination in price action trading.
Fibonacci
If the shooting star forms at a Fibonacci retracement level (like 61.8%), the signal is even stronger. Fibonacci shooting star trading is popular among advanced traders.
Risk Management for Shooting Star Trades
Stop-Loss Placement
Always place stop loss above the shooting star high. No exceptions.
Risk Percentage
Never risk more than 1–2% of your total account on one trade. Even the best patterns fail sometimes.
Trade Discipline
Stick to your plan. Do not move your stop loss out of fear. Exit at your target. Shooting star risk management is what separates profitable traders from losing ones.
When NOT to Trade a Shooting Star
- When the market is moving sideways (no clear trend)
- When there is no confirmation candle the next day
- When the upper wick is very short (weak signal)
- When volume is extremely low
- When major news events are coming soon
False shooting star signals are common in choppy markets. Avoid them.
Common Mistakes Traders Make
- Entering the trade too early, before confirmation
- Ignoring the overall trend direction
- Not placing a stop loss
- Trading it in a sideways market
- Overtrading every shooting star they see
- Ignoring volume data
- Skipping risk management rules
Advantages of the Shooting Star Candlestick Pattern
- Easy to spot even for beginners
- Works in all markets (forex, stocks, crypto)
- Clear entry, stop loss, and target rules
- Very powerful near resistance levels
- Works on all timeframes
Disadvantages of the Shooting Star Pattern
- Can produce false signals in weak trends
- Needs confirmation before trading
- Less reliable on lower timeframes
- Works best only after a clear uptrend
Shooting Star in Different Markets
Forex
Shooting star in forex trading works great on major pairs like EUR/USD or GBP/USD. Daily and 4-hour charts give the best results.
Stocks
The stock market shooting star pattern is widely used by swing traders. It works especially well near earnings highs or all-time highs.
Crypto
Crypto shooting star candlestick signals are very common due to high volatility. Always wait for confirmation in crypto markets since fake moves are frequent.
How Volume Affects Shooting Star Signals
High volume during a shooting star candle shows strong rejection. Many sellers were active. The signal is trustworthy.
Low volume means the move was weak. Not many traders participated. The signal may fail. Always check volume before entering any price action shooting star trade.
Beginner Tips for Using Shooting Star Effectively
- Always check the trend first
- Use the daily chart to start
- Wait for the confirmation candle always
- Combine with RSI or resistance levels
- Keep your stop loss tight and logical
- Do not force trades — wait for clear setups
- Practice on a demo account before going live
Quick Cheat Sheet (1-Minute Summary)
- What it is: A bearish reversal candle with a small body and long upper wick
- Forms after: An uptrend
- Signal: Sellers rejected higher prices
- Confirmation: Next red candle closing below the body
- Entry: After confirmation candle closes
- Stop loss: Above the shooting star high
- Best with: RSI overbought, resistance level, high volume
- Works in: Stocks, forex, crypto
FAQs About Shooting Star Candlestick
Question: Is the shooting star bullish or bearish?
Answer: It is a bearish signal. It means prices may go down after forming.
Question: Can beginners use the shooting star pattern?
Answer: Yes! It is one of the easiest shooting star candlestick patterns for beginners to learn and apply.
Question: Is it profitable?
Answer: Yes, when used correctly with confirmation and good risk management. No pattern wins 100% of the time.
Question: What is the shooting star accuracy rate?
Answer: Around 50–65% on its own. Higher when combined with other tools like RSI and resistance levels.
Question: How is a shooting star different from an inverted hammer?
Answer: Same shape, but shooting star forms at the top of an uptrend. Inverted hammer forms at the bottom of a downtrend.
Final Thoughts
The shooting star candlestick is a simple but powerful tool. It tells a clear story — buyers tried to push prices up, but sellers took control and pushed them back down.
Whether you trade forex, stocks, or crypto, this pattern can be a great addition to your trading toolkit. Just remember: always wait for confirmation, always manage your risk, and never trade blindly.
Start small, practice a lot, and use the shooting star as one part of a bigger trading plan. With time and patience, it can truly help you make smarter trading decisions.
Happy trading! 🌟