
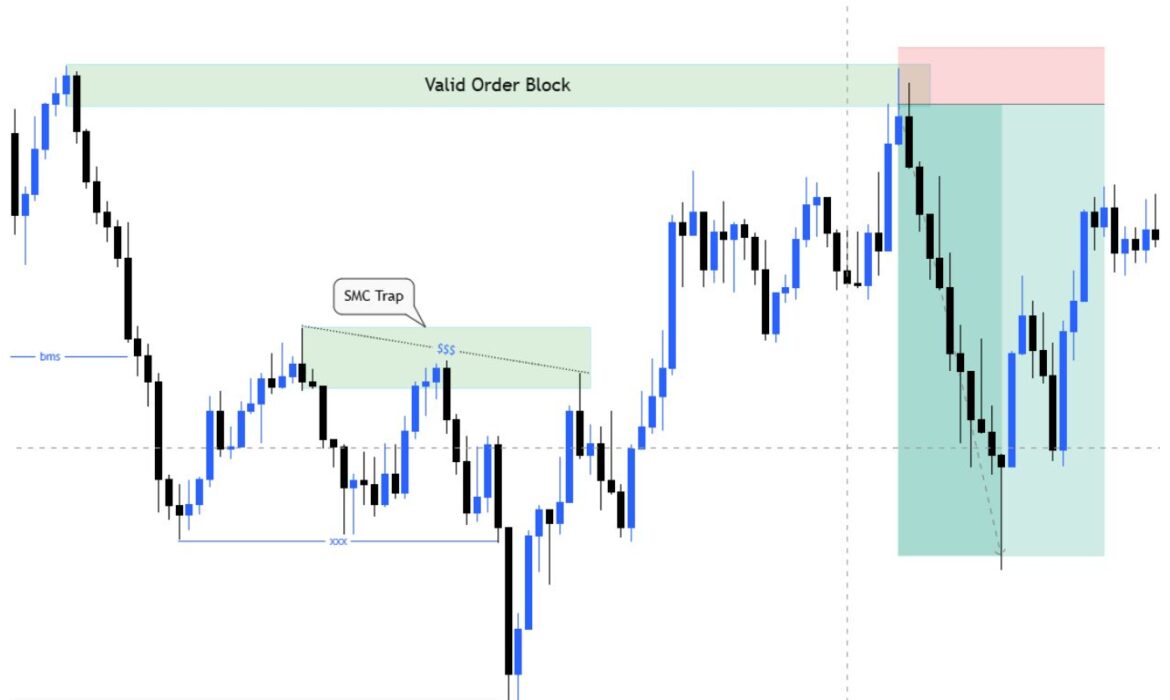
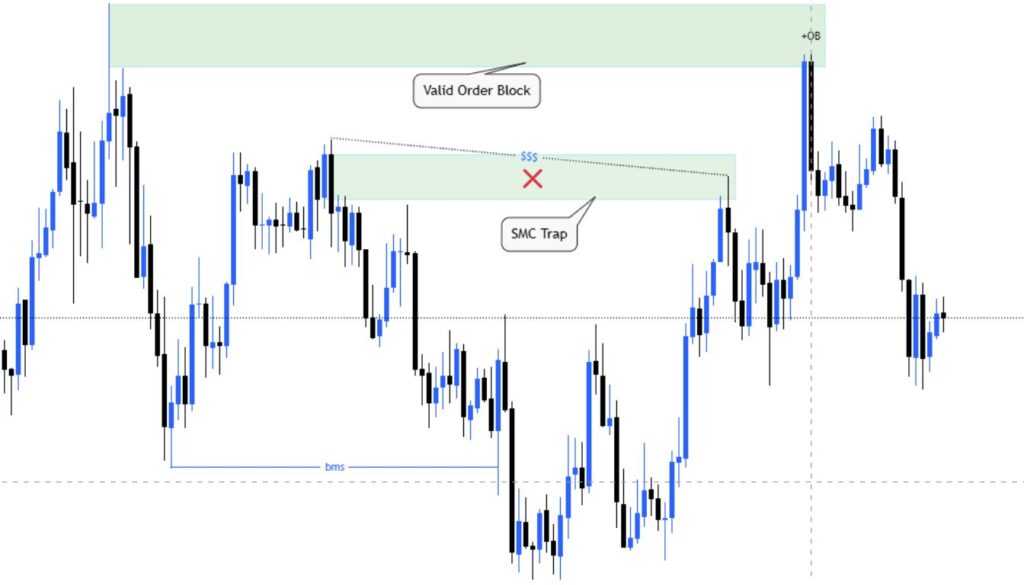
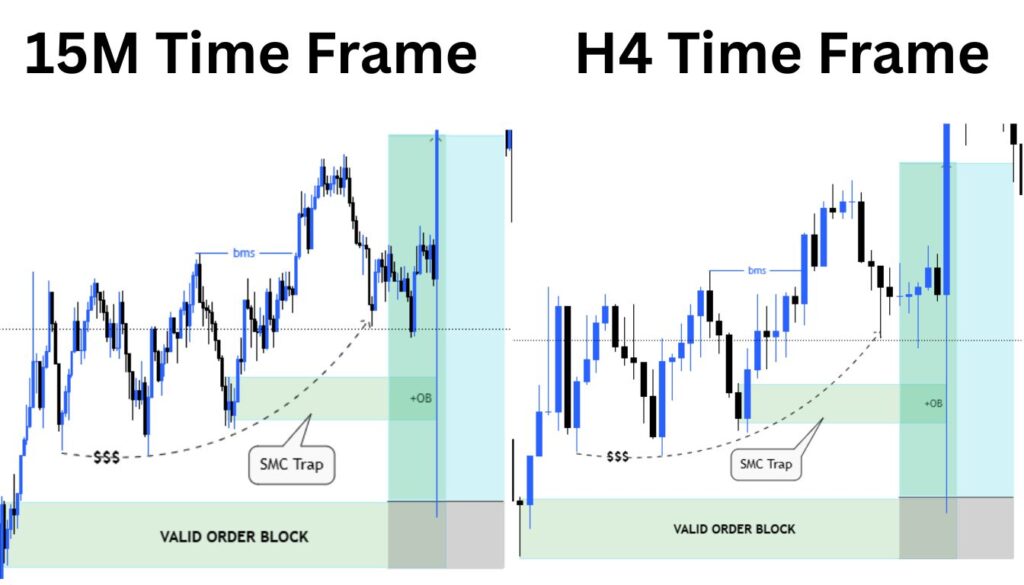
What Is an “SMC Trap”?
An SMC trap happens when the price looks like it will go one way, but big traders (smart money) push it the opposite way to collect stop-losses from smaller traders.
Quick example: The price breaks above a key level, making you think it will keep going up, but then it suddenly drops hard because banks wanted to grab all the buy stops sitting there before the real move down.
Think of it like a mouse trap with cheese—the breakout is the cheese, and when small traders bite, the SMC trap snaps and takes their money.
How an SMC Trap Looks on a Chart
There are three main shapes you will see when smart money sets a trap:
1. Stop-Hunt Wick The price shoots above or below a key level with a long thin line (wick), then closes back inside the range. Imagine a tall spike that pokes through a line and comes right back—that’s the wick grabbing stops.
2. Fake Breakout SMC Price breaks a support or resistance level, maybe even closes one or two candles outside, then reverses completely. It looks like a real breakout but isn’t—the door opened, traders walked in, then the door slammed shut.
3. Liquidity Sweep Tecknique Price quickly touches an obvious high or low where many stops sit, then immediately reverses. Picture a hand reaching into a cookie jar (liquidity pool), grabbing cookies (stop orders), and pulling back fast.
All three shapes share one thing: sharp move, quick reversal, and trapped traders left on the wrong side.
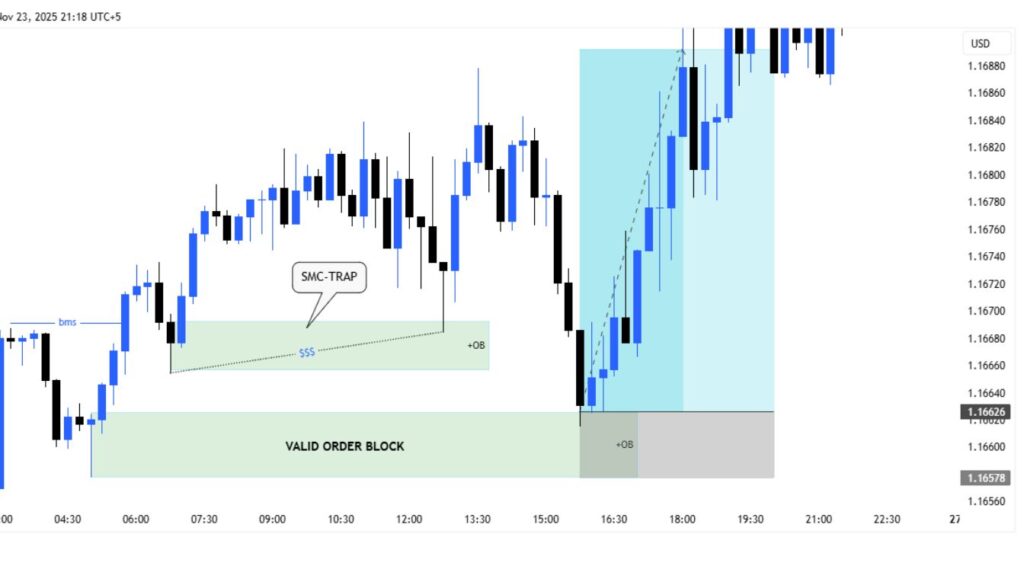
Step-by-Step Example Trade
Let’s walk through a real EUR/USD SMC trap trade:
Setup: EUR/USD has been falling. There’s a clear low at 1.16578 where price bounced before.
The Trap: Price drops to 1.16685, breaking the low by 5 pips with a sharp wick, then closes back at 1.16878.
Your Entry: You enter a buy at 1.16626 after the wick closes, knowing smart money just grabbed sell stops below 1.16578.
Your Stop-Loss: Place it at 1.16578, giving 49 pips of room below the SMC trap zone.
Your Take-Profit: Target the next resistance at 1.16892, giving you 266 pips.
Risk-to-Reward: You risk 49 pips to make 266 pips—that’s 1:6 ratio.
Outcome Scenarios:
- Win: Price rallies to 1.16892, you make 266 pips.
- Loss: Price keeps falling, you lose 49 pips.
- Breakeven: You move stop to entry once price hits 1.16626.
This SMC trap worked because the wick was sharp, volume spiked, and the level was obvious to everyone.
SMC Trap Detection Checklist (One-Page Cheat Sheet)
Use this quick Yes/No list before every trade:
✅ Key Level Present? Is there an obvious high, low, or support/resistance everyone can see?
✅ Volume Spike? Did volume jump when the SMC trap formed?
✅ Wick into Liquidity? Is there a sharp wick poking through the level?
✅ Multi-Timeframe Match? Does the higher timeframe support this direction?
✅ Order Block Trap Setup? Is there a supply or demand zone trap close by?
✅ No Major News? Check the economic calendar—nothing high-impact in next 2 hours?
✅ Clean Structure? Is the SMC trap easy to see, not messy?
✅ Enough Risk-Reward? Can you get at least 1:2 ratio?
If you get 6 out of 8 “Yes” answers, the SMC trap is strong. If 4 or fewer, skip the trade.
Quick Decision Flow: When to Trade / When to Skip
Follow this simple five-step process:
Step 1: Is there high-impact news in the next 2 hours?
- Yes → Skip the trade.
- No → Go to Step 2.
Step 2: Is there a clear key level with obvious liquidity?
- No → Skip.
- Yes → Go to Step 3.
Step 3: Did price create a sharp wick or smart money false move at that level(False Breakout)?
- No → Wait for better setup.
- Yes → Go to Step 4.
Step 4: Does the higher timeframe trend support your direction?
- No → Skip or reduce size.
- Yes → Go to Step 5.
Step 5: Can you get 1:2 risk-reward or better with safe stop placement?
- No → Skip.
- Yes → Take the trade.
This flowchart keeps you disciplined and protects you from forcing trades.
Simple Backtest Plan for SMC Traps (Beginner Friendly)
Testing past trades helps you learn what works. Here’s how:
Step 1: Open your chart replay tool and go back 3 months.
Step 2: Mark 30 clear SMC trap setups you find.
Step 3: Create a simple spreadsheet with these columns: Date, Pair, Entry, Stop, Target, Win/Loss, Pips.
Step 4: For each setup, record what would have happened if you traded it.
Example Row:
- Date: Jan 15
- Pair: GBP/USD
- Entry: 1.2700
- Stop: 1.2680
- Target: 1.2750
- Result: Win
- Pips: +50
Step 5: After 30 trades, calculate your win rate (wins ÷ total trades) and average reward-to-risk.
If your win rate is above 40% with 1:2 RR, your strategy can be profitable.

Journal Template for SMC Trap Trades
Date: _________
Symbol: _________
Timeframe: _________
SMC Trap Type: (Stop-hunt / False breakout / False Liquidity sweep)
Entry Price: _________
Stop-Loss: _________
Take-Profit: _________
Position Size: _________
Checklist Score: ___/8
Reason for Trade: _________________________________
Emotions Before: (Calm / Excited / Nervous / Other)
Outcome: (Win / Loss / Breakeven)
Lessons Learned: _________________________________
Example Filled Row:
- Date: Jan 20, 2025
- Symbol: EUR/USD
- Timeframe: 15min
- SMC Trap Type: Liquidity sweep
- Entry: 1.0512
- Stop-Loss: 1.0490
- Take-Profit: 1.0600
- Position Size: 0.5 lots
- Checklist: 7/8
- Reason: Sharp wick below 1.0500, volume spike, higher TF bullish
- Emotions: Calm
- Outcome: Win
- Lesson: Patience paid off—waited for wick close
Position Sizing & Stop Methods
Here’s the simple math to never risk too much:
Formula 1 — Risk Amount: Risk % × Account Balance = Risk Amount
Example: 1% × $10,000 = $100 risk per trade
Formula 2 — Position Size: Position Size = Risk Amount ÷ (Entry Price − Stop-Loss Price)
Example: $100 ÷ (1.0512 − 1.0490) = $100 ÷ 0.0022 = 45,454 units (0.45 lots in forex)
ATR-Based Stop Sizing: Use the Average True Range (ATR) indicator—place your stop 1.5× the ATR value away from entry to avoid random noise.
These formulas protect your account from big losses.
Multi-Timeframe Rules for SMC Traps
Use three timeframes for best results:
Higher Timeframe (Trend): Check the 4-hour or daily chart—what’s the big direction? Only trade traps that align with this trend.
Signal Timeframe (Setup): Use the 15-minute or 1-hour chart—this is where you find the SMC trap forming.
Micro Entry (Timing): Use the 5-minute or 1-minute chart—this is where you enter after the trap confirms.
Dos:
- Trade traps on the signal timeframe that match the higher timeframe direction
- Wait for micro timeframe smc trap confirmation
Don’ts:
- Don’t fight the higher timeframe trend
- Don’t enter on micro timeframe without checking bigger picture
Strong traps happen when all three timeframes agree.
Order Book & Order-Flow Basics for Spotting Traps
The order book shows you where big orders sit waiting:
What You See:
- Bid side: Buy orders waiting below current price
- Ask side: Sell orders waiting above current price
Big Resting Orders: Large size numbers at key levels mean institutions are waiting there—these are liquidity pools.
Liquidity Sweeps: When price suddenly touches these levels and the big orders disappear fast, that’s liquidity trap smc.
How It Relates to Traps: If you see huge buy orders at $42,000 and price dips to $41,995 then bounces hard, the SMC trap just absorbed those stops.
Not all brokers show the real order book—crypto exchanges show it best.
Platform & Data Checklist (What to Watch For)
Make sure your tools are reliable:
✅ Reliable Broker/Exchange: Choose regulated brokers with good reviews—avoid shady platforms.
✅ Real-Time Data Feed: Delayed data makes you miss traps or enter late.
✅ Volume Type: Real volume is better than tick volume (forex often shows tick volume).
✅ Replay Tool: Essential for backtesting—TradingView and some platforms have this.
✅ Order Book Access: Helpful for crypto; less available in forex.
✅ Low Candle Delay: Check that candles close on time, not seconds late.
Bad tools lead to bad trades—test everything in demo first.
Market-Specific Notes: Forex vs Crypto vs Stocks
Forex: Traps often happen at London/New York session open when liquidity is highest. Watch for traps around major round numbers (1.1000, 1.2000). Spreads are tight, so stops can be closer.
Crypto: Traps happen 24/7 but are strongest during overlap hours. Crypto is more volatile—use wider stops and smaller position sizes. Liquidation levels on exchanges create huge traps.
Stocks: Traps form at market open (9:30 AM EST) and around earnings reports. Lower liquidity in pre-market means bigger spreads. Insider activity can create traps regular traders can’t predict.
Adapt your SMC trap strategy to each market’s personality.
Common Mistakes with SMC Traps + How to Fix Them
Mistake 1: Chasing Entries
Fix: Wait for the trap candle to fully close before entering.
Mistake 2: Stop Too Tight
Fix: Place stop beyond the entire trap zone, not just the wick tip.
Mistake 3: Ignoring Liquidity Context
Fix: Only trade traps at obvious levels where many stops sit.
Mistake 4: Trading Every Trap
Fix: Be selective—take only A+ setups that pass your checklist.
Mistake 5: No Multi-Timeframe Check
Fix: Always confirm higher timeframe supports your direction.
Mistake 6: Overtrading
Fix: Set a maximum of 3 trap trades per day.
One small fix at a time improves your results.
Mini Case Studies: 3 Real-World Traps (Short Stories)
Forex Story — EUR/USD London Open Trap: Price sat at 1.0800 overnight. At London open, it spiked to 1.0820, breaking resistance. New traders bought the breakout. Within 10 minutes, price crashed to 1.0760. Smart money grabbed buy stops above 1.0815, then pushed down hard. Lesson: Don’t trust breakouts right at session open.
Crypto Story — Bitcoin Liquidation Trap: Bitcoin traded at $30,000 with huge long positions at $30,500. Price shot to $30,550, liquidating longs, then dropped to $28,500 in one hour. Traders who shorted after the trap made 2,000 points. Lesson: Watch funding rates and liquidation levels.
Stock Story — Apple Earnings Trap: Apple had earnings after close. Pre-market it gapped up $5, hitting $180. Day traders bought the gap. By 10 AM, price reversed to $173. Smart money sold into retail excitement. Lesson: Earnings create emotional traps—wait for the dust to settle.
Confluence Tools — What to Use (and What to Avoid)
High-Value Confirmations (Use These):
- Volume Spike: Sharp increase when trap forms shows real activity.
- Order Block Confirmation: Price returning to a previous supply/demand zone.
- Fair Value Gap (FVG) Fill: Price filling an imbalance before reversing.
- Higher Timeframe Structure: Break of structure or change of character on bigger chart.
Low-Value Traps (Avoid These):
- Overusing Lagging Indicators: Too many moving averages clutter your view.
- Ignoring Price Action: Relying only on oscillators without watching actual candles.
- Too Many Indicators: Using 5+ indicators creates confusion, not clarity.
Keep it simple—use 2-3 strong confluences maximum.
Quick Risk Rules & Simple Ruleset to Follow
Rule 1: Never risk more than 1-2% of your account on one trade.
Rule 2: Take maximum 3 SMC trap trades per day.
Rule 3: If you lose 5% of your account in one week, stop trading until next week.
Rule 4: Always use a stop-loss—no exceptions, ever.
Rule 5: Don’t trade 30 minutes before and after high-impact news.
Rule 6: If you’re emotional (angry, overexcited, scared), close your platform.
These simple rules keep you in the game long-term.
Printable One-Page SMC Trap Playbook
═══ SMC TRAP PLAYBOOK ═══
Definition: Smart money pushes price to grab stops, then reverses.
Visual Signs: Stop-hunt wick, false breakout, liquidity sweep.
Checklist (need 6/8): □ Key level visible
□ Volume spike
□ Sharp wick
□ Multi-TF match
□ Order block near
□ No major news
□ Clean structure
□ Good RR (1:2+)
Position Sizing: Risk % × Account = Risk Amount
Risk Amount ÷ (Entry − Stop) = Position Size
Skip Rules:
- Major news coming
- Messy structure
- Poor RR
- Against higher TF
Example: EUR/USD drops to 1.0495, wicks, closes 1.0510. Enter buy 1.0512, stop 1.0490, target 1.0600. Risk 22 pips, gain 88 pips = 1:4 RR.
═══════════════════
Print this and keep it at your desk.
Short Glossary of SMC Terms
Order Block: A zone where big banks placed large buy or sell orders, leaving footprints on the chart.
FVG (Fair Value Gap): An empty space between candles where price moved so fast it left a gap—price often returns to fill it.
BOS trap(Break of Structure trap): When price breaks an important high or low, showing a new trend direction.
ChoCH (Change of Character): When price behavior changes, like going from big moves to small moves, signaling a shift.
Liquidity: Areas where many stop-losses sit, like honey for smart money bees.
Stop Hunt SMC: When market maker trap and push price to hit stop-losses on purpose, grabbing liquidity.
Liquidity Pool: A cluster of stops at obvious levels—smart money targets these.
Inducement in SMC: The bait (like breaking a level) that tricks traders into entering the wrong way.
SMC Liquidity Manipulation: The trap period when smart money tricks everyone before the real move.
Supply Zone: An area where sellers are strong, usually at a previous high.
Demand Zone: An area where buyers are strong, usually at a previous low.
Sweep: A quick touch of liquidity then immediate reversal.
How to Use a Trading Journal to Improve (30-Day Plan)
Week 1 (Days 1-7): Log every trade you take with full details—entry, exit, reason, emotions. Just collect data, no judgments.
Week 2 (Days 8-14): Keep logging. At end of week, review all trades and count wins vs losses. Find your biggest mistake (like chasing entries).
Week 3 (Days 15-21): Continue logging. Focus on fixing one mistake you found in Week 2. Write a reminder note: “Wait for candle close.”
Week 4 (Days 22-30): Log every trade. At month-end, calculate your win rate, average RR, and total pips. Compare Week 4 to Week 1—did you improve?
Repeat: Start Month 2, finding and fixing your next biggest mistake.
Small improvements each month create big results over time.
Simple Metrics to Judge If Your SMC Strategy Works
Win Rate: (Number of Wins ÷ Total Trades) × 100
Example: 12 wins out of 30 trades = 40% win rate
Average Reward-to-Risk (RR): Add all your RR ratios and divide by number of trades.
Example: (2 + 3 + 1.5 + 2.5) ÷ 4 = 2.25 average RR
Expectancy: (Win Rate × Average Win) − (Loss Rate × Average Loss)
Example: (0.4 × $200) − (0.6 × $100) = $80 − $60 = +$20 per trade
Why Expectancy Matters: Even with 40% win rate, if your winners are big enough, you still make money over time. Positive expectancy means your strategy has an edge.
If your expectancy is negative, your strategy loses money long-term—time to adjust.
When SMC Traps Might Fail — Edge Cases to Know
Major News Events: During NFP, Fed announcements, or surprise news, traps can fail because fundamentals overpower technicals. Skip trading 30 minutes before/after.
Illiquid Hours: Asian session or holiday trading has low volume—traps may not complete because not enough liquidity moves price.
Exchange Outages: If your broker or exchange has technical issues, price may not reach targets or stops may not execute.
Spoofing: When fake large orders appear then disappear in the order book—this confuses trap signals. Watch for orders that vanish before getting filled.
Flash Crashes: Rare sudden drops or spikes from algorithm errors—your stop might get hit unfairly at crazy prices.
What to Do: Avoid trading during known illiquid times, always check news calendars, and use limit orders when possible to control fills.
Ethics & Broker Issues: Fair Play and Slippage
Slippage: When your order fills at a different price than you clicked—happens in fast markets. A few pips is normal; 20+ pips is suspicious.
Bad Fills: If your stop constantly gets hit at the worst possible price, your broker might be hunting your stops. Test fills in demo for a month first.
Choosing a Fair Broker: Look for regulated brokers (FCA, ASIC, CFTC), read reviews, check average execution speed, and test their platform in demo.
Fair Play: Remember, SMC traps aren’t illegal—they’re how Market maker(big institutions) manage their large positions. You’re learning to read their footprints, not doing anything wrong.
Red Flags: Brokers who freeze your platform during volatility, constantly requote prices, or have many complaints about withdrawals—avoid them.
Always start with demo trading to test if your broker executes orders fairly.
Extras: Small Tool & Resource List
Replay Tool: TradingView has a bar replay feature—use it to practice finding traps in past data.
DOM (Depth of Market): Shows the order book—available on most crypto exchanges and some futures platforms.
Volume-at-Price: Displays volume as horizontal bars at different price levels—helps find liquidity zones.
Heatmaps: Some platforms show liquidation heatmaps for crypto—see where liquidations cluster.
Economic Calendar: Forex Factory and Investing.com show upcoming news events—essential to avoid trap failures.
Footprint Charts: Advanced tool showing buy vs sell volume at each price level—useful for spotting large players.
Where to Find: Most features are in TradingView, broker platforms like Think or Swim, or crypto exchanges like Binance and Bybit.
Expanded FAQ Additions (Simple Answers)
Question: How long does it take to learn SMC traps?
Answer: About 3-6 months of daily practice. First month learning the patterns, second month backtesting, third month demo trading, then slowly go live with small size.
Question: How much money do I need to start?
Answer: Start with $500-$1,000 in demo money first. When you’re profitable in demo for 2 months, you can start live with $500-$2,000 depending on your market (forex needs less, stocks need more).
Question: Can I automate SMC traps?
Answer: It’s very difficult because traps need context, order flow, and quick decisions. Most algorithms miss the “smart money” read. Manual trading works better for traps.
Question: Are Smart money concept traps illegal?
Answer: No! SMC is just reading what Market Maker do. It’s legal analysis of public price data. You’re not manipulating anything—you’re observing manipulation by others.
Question: Do SMC traps work in all markets?
Answer: They work best in liquid markets (major forex pairs, Bitcoin, large-cap stocks). In tiny stocks or exotic pairs, there isn’t enough liquidity for clean SMC traps.
Question: What if I keep losing even with good setups?
Answer: Check three things: (1) Is your stop too tight? (2) Are you entering too early? (3) Is your broker execution fair? Fix these one at a time.
Question: Should I use indicators with SMC traps?
Answer: Keep it simple—volume and maybe ATR for stop sizing. Too many indicators distract from reading pure price action and liquidity.
Question: How many traps should I take per week?
Answer: Quality over quantity. Even 2-3 perfect setups per week is enough if they’re high-probability. Don’t force trades.
[…] price breaks a level, many traders get SMC trapped on the wrong side. These trapped traders create liquidity. When price returns to the breaker block, […]
[…] inducement motivation plays a huge role here. A breakout looks exciting. A new high looks bullish. But many times, these moves are […]
[…] Not every CHoCH leads to a real trend reversal, and this is where many traders lose money. Fake change of character setups are SMC traps. […]