
A doji candle is a special candlestick pattern you see on a price chart. It forms when the opening price and closing price are almost the same. This tiny but powerful candle tells traders something very important — the market can’t make up its mind.
Simple Meaning of a Doji Candle
Think of it like a tug of war. Both teams pull hard, but nobody moves. That’s exactly what a doji candle meaning is — buyers and sellers fought all day, but nobody won.
What It Tells About the Market
A doji candle in technical analysis shows that the market is in a state of confusion. Neither bulls (buyers) nor bears (sellers) are in control. This makes it an indecision candle pattern worth watching closely.
Why Traders Care About It
Traders love doji candles because they can signal a possible change in direction. When you see one, it’s like a yellow traffic light — slow down and pay attention.
What Does a Doji Candle Look Like?
Shape (Like a Plus ➕ or Cross ✝️)
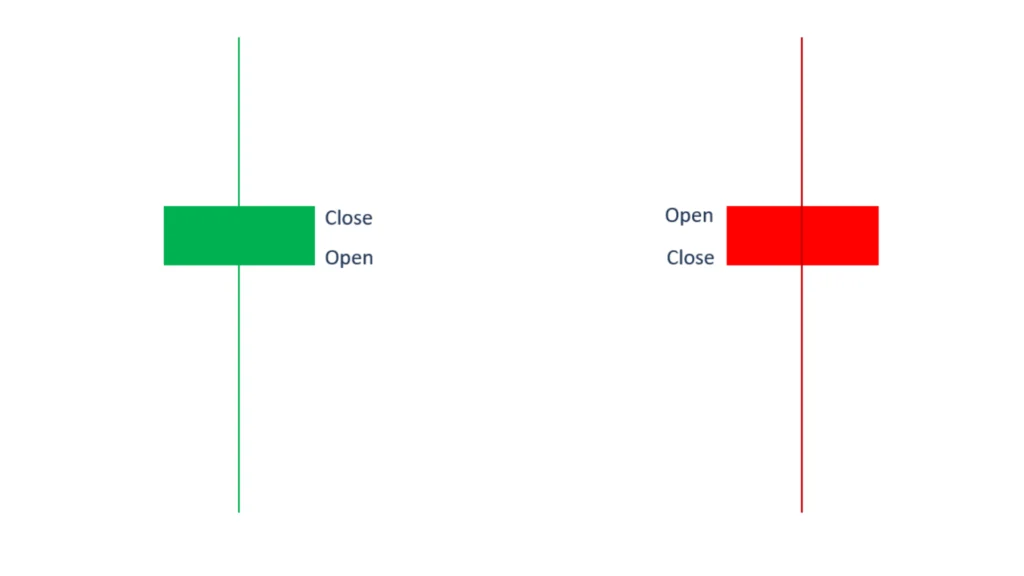
A doji candlestick pattern looks like a plus sign or a cross. It has a very small body in the middle with lines (called shadows or wicks) going up and down.
Open Price vs Close Price
The open and close prices are almost equal. That’s why the body is so thin — sometimes just a tiny line.
Long vs Short Shadows
Some doji candles have very long shadows. Others have short ones. The length of the shadows tells you how wild the price moved during that time period.

Doji Candle in Simple Words (Easy Story)
Buyers vs Sellers Example
Imagine a fruit market. The seller wants $10 for a mango. The buyer wants to pay $8. They argue all day. At the end, they agree on $9 — almost where they started.
“No One Wins” Explanation
That’s the doji candle story. Buyers pushed the price up. Sellers pushed it back down. At the end, the price closed right where it opened. Nobody won.
Why It Shows Confusion
This is why traders call it a candlestick indecision signal. The market is confused. It doesn’t know where to go next.
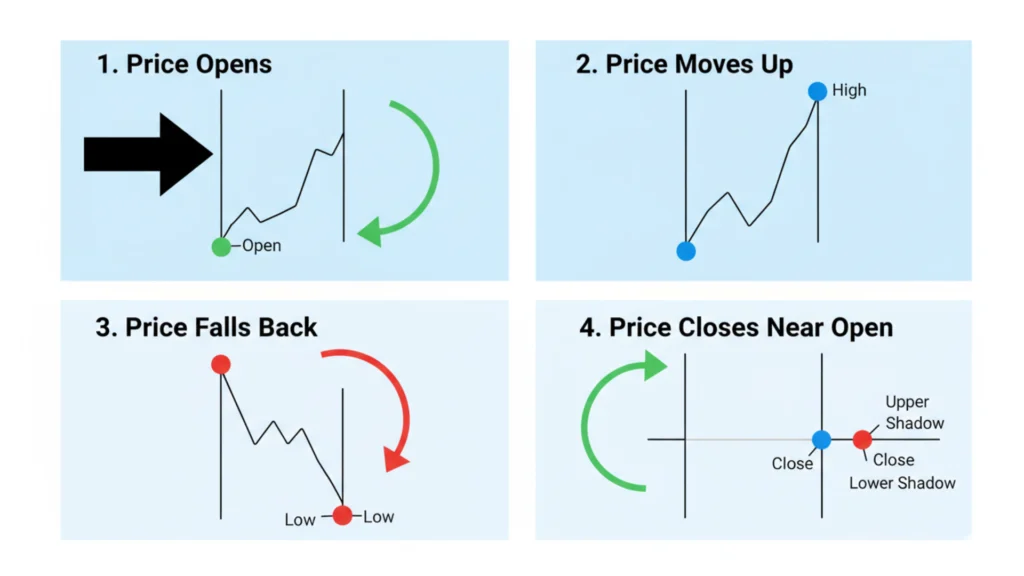
How a Doji Candle Forms (Step-by-Step)
A doji candle forms in a very simple way. First, the price opens at a certain level. Then buyers push it up — sometimes very high. Then sellers push it back down. Finally, the price closes very close to where it opened. That’s the complete story of one doji candle.
What Does a Doji Candle Mean in Trading?
Market Indecision
The most important doji candle meaning is indecision. The market is pausing. This pause can come before a big move.
Possible Trend Change
A doji candle is often a doji reversal signal. If the market was going up and then a doji appears, it might start going down. The same works in reverse.
Warning Signal (Not Confirmation)
Remember — a doji candle is just a warning. It’s not a confirmed signal. Never trade only based on a doji. Always wait for the next candle to confirm the move.
Types of Doji Candlestick Patterns
There are several types of doji candles. Each one looks a little different and tells a slightly different story.
Standard Doji
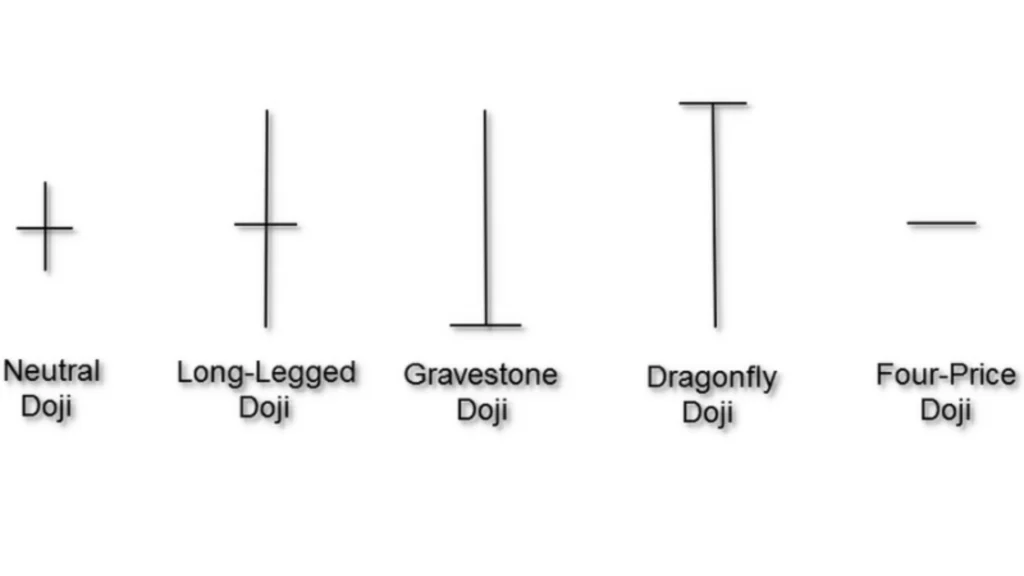
This is the basic doji. It has equal shadows on top and bottom, with a tiny body in the middle. It shows pure market indecision.
Long-Legged Doji
The long-legged doji candle has very long shadows on both sides. This means the price moved wildly in both directions before settling back. It shows extreme confusion in the market.
Dragonfly Doji
The dragonfly doji pattern has a long shadow only at the bottom and no shadow at the top. It looks like a “T” shape. This often appears at the bottom of a downtrend and can be a bullish signal.
Gravestone Doji
The gravestone doji explanation is simple: it’s the opposite of the dragonfly. It has a long shadow at the top and no shadow below. This often appears at the top of an uptrend and can be a bearish signal.
Four-Price Doji
This is a very rare doji. The open, close, high, and low are all the same price. It usually happens in very low-volume markets.
Doji Star
A doji star appears between two candles — one large candle before it and one after. It’s a strong part of reversal patterns like the morning star or evening star.
What Happens After a Doji Candle?
Possible Reversal
Many times, the market changes direction after a doji. This is what traders hope to catch using a doji breakout strategy.
Trend Continuation
Sometimes the trend just keeps going. That’s why confirmation is so important before entering any trade.
Sideways Movement
In some cases, the market stays flat after a doji. This is common in sideways markets where there’s no clear direction.
Doji Candle in Different Market Trends
In an Uptrend
A doji candle at the top of an uptrend is a warning sign. It could mean buyers are losing energy. Sellers might take over soon. This is called a doji at market top meaning.
In a Downtrend
A doji in a downtrend can mean sellers are tired. Buyers might be stepping in. This is the doji at market bottom signal — often a bullish hint.
In a Sideways Market
In a sideways or ranging market, doji candles appear often. In this case, they’re less meaningful. The market is already confused, so one more doji doesn’t help much.
Is a Doji Candle Bullish or Bearish?
Depends on Context
This is a common question. The truth is — a doji candle bullish or bearish answer depends on where it appears.
Examples of Both Cases
If a dragonfly doji appears after a big drop, it’s likely bullish. If a gravestone doji appears after a big rally, it’s likely bearish. Always look at the bigger picture.
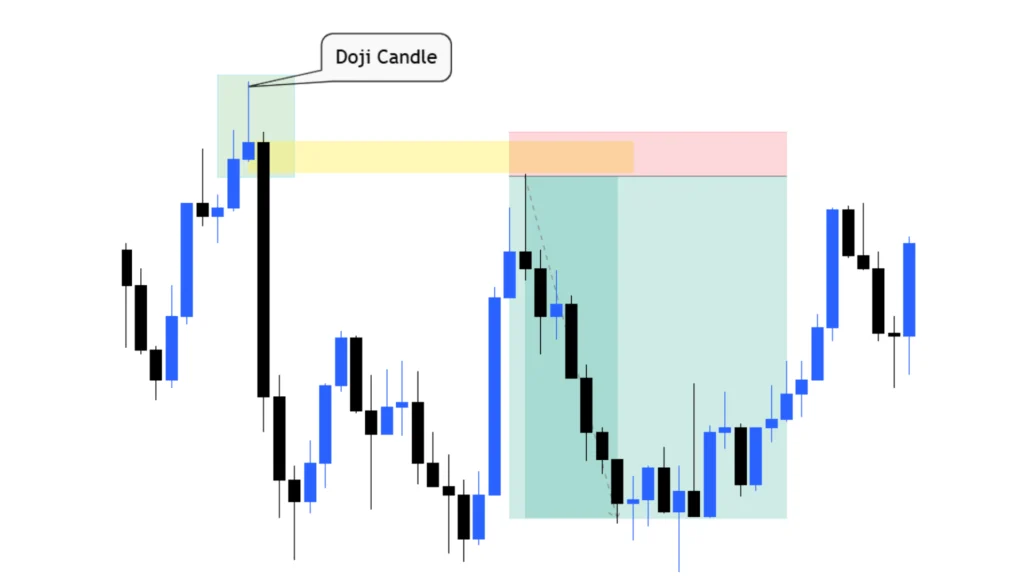
How to Identify a Doji Candle on a Chart
Look for a candle with a very small or nearly invisible body. The open and close should be almost at the same level. There should be shadows (wicks) on one or both sides. Most trading platforms will highlight these easily once you know what to look for.
How to Trade Using a Doji Candle (Step-by-Step)
Here is a simple doji candlestick strategy anyone can follow:
Step 1 – Find the Doji: Look for the cross-shaped candle on your chart.
Step 2 – Check the Trend: Is the market going up, down, or sideways?
Step 3 – Wait for Confirmation: Watch the next candle. Does it move in the expected direction?
Step 4 – Enter the Trade: Enter only after the confirmation candle closes.
Step 5 – Set Stop-Loss: Place your stop-loss just below the doji (for buy trades).
Step 6 – Set Profit Target: Use support and resistance levels to set your target.
Simple Doji Trading Strategies
Doji + Support & Resistance
If a doji forms exactly at a support or resistance level, it becomes much stronger. This is the best way to use doji support and resistance in your trading.
Doji + Trend Confirmation
Use a moving average to confirm the trend. If the price is above the moving average and a dragonfly doji forms, it can be a strong buy signal.
Doji + Multi-Candle Patterns
Combine doji with patterns like the morning star or evening star. These reversal candlestick indicators are much more reliable than a doji alone.
Best Indicators to Use with Doji
RSI: If RSI is above 70 (overbought) and a gravestone doji appears, that’s a strong sell signal. If RSI is below 30 (oversold) and a dragonfly doji forms, consider buying.
Moving Averages: Use these to identify the main trend direction before trading any doji pattern.
Volume: Always check volume. A doji with high volume is more significant.
Doji with volume analysis gives much better results than looking at the candle alone.
Doji Candle vs Other Candlestick Patterns
Doji vs Spinning Top
The doji vs spinning top candle is a common comparison. Both show indecision, but the spinning top has a slightly bigger body. A doji is more extreme in its indecision.
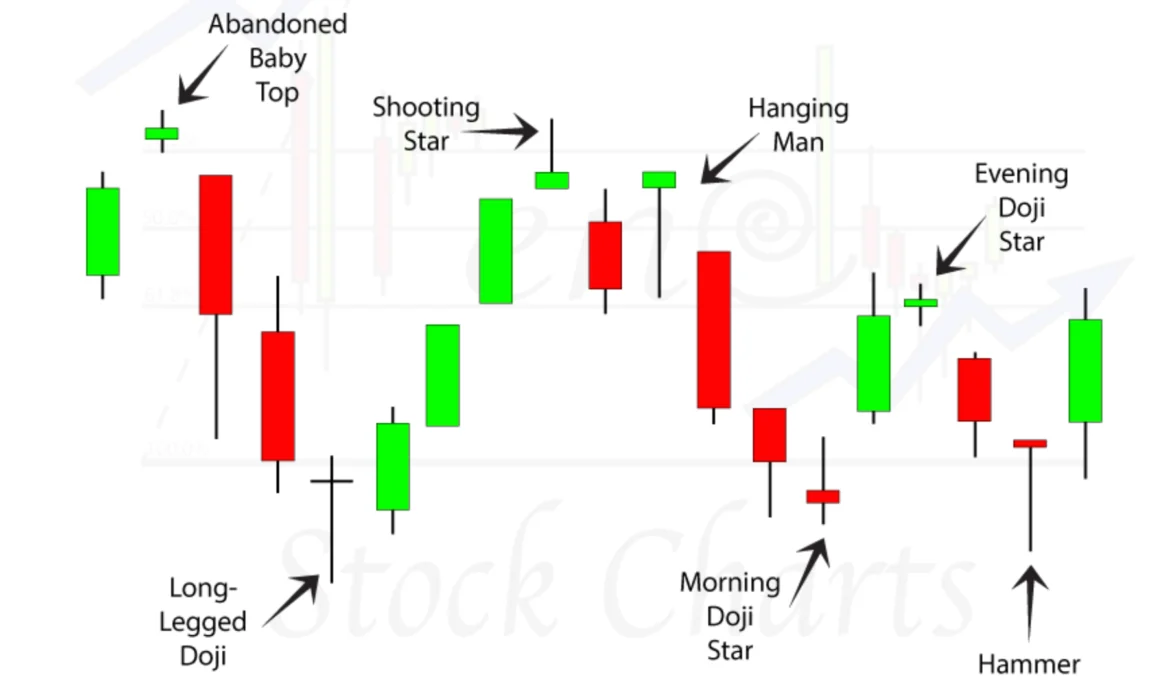
Doji vs Hammer
A hammer has a small body at the top and a long lower shadow. It’s a bullish pattern. A dragonfly doji looks similar but the body is almost invisible. Both can signal reversals.
Doji vs Shooting Star
A shooting star has a small body at the bottom and a long upper shadow. It’s bearish. A gravestone doji is similar but with virtually no body at all.
Doji Candle in Different Markets
Forex Trading
Doji trading strategy forex works well because forex markets are very liquid. Doji candles here are more reliable, especially on 1-hour or 4-hour charts.
Stock Market
The doji pattern in stock market trading is most useful at key earnings levels or after big news events. Always check the context.
Cryptocurrency Trading
Crypto markets are very volatile. Doji candles here can be tricky. Always use extra confirmation before trading in crypto.
How Reliable Is a Doji Candle?
A doji candle alone is not always reliable. But when you combine it with trend analysis, support/resistance, and volume, the doji candle reliability in trading improves greatly. Always look for confirmation before you act.
When You Should NOT Trust a Doji
Avoid trading doji candles in low-volume markets. Also avoid them when the market is moving sideways with no clear trend. Sometimes doji candles appear due to random price noise — these are false signals.
Common Mistakes Beginners Make
Many beginners jump into trades the moment they see a doji. Don’t do that. Always wait for the confirmation candle. Also, never ignore the trend direction. A doji in the middle of a strong trend is very different from one at a market top or bottom.
What Does 2 or 3 Doji in a Row Mean?
When you see multiple doji candles in a row, the market is showing very strong indecision. This usually means a big move is coming soon. Watch for a doji breakout strategy — when price finally breaks out of this range, it can move fast.
Advantages and Disadvantages of Doji Candle
Advantages: A doji is easy to spot even for beginners. It gives an early warning signal before a possible reversal. It works across all markets and timeframes.
Disadvantages: It’s not always reliable on its own. It needs confirmation from the next candle or other indicators. In choppy markets, it can give too many false signals.
Real Trading Examples
Winning Trade Example: A trader sees a dragonfly doji form at a key support level after a downtrend. RSI is at 28. The next candle is a big green bullish candle. The trader buys and makes a profit as price reverses upward.
Losing Trade Example: A trader sees a doji in the middle of a sideways market and jumps in too early. Price doesn’t move in any direction. The stop-loss gets hit. Lesson: always check the trend first.
Doji Candle Psychology
At its core, the doji candle is about emotions. Buyers feel excited and push the price up. Sellers feel scared and push it back down. By the end, both groups are equal. The market is confused. This moment of equal fear and greed is what makes the price action doji strategy so powerful.
Quick Checklist: What to Do When You See a Doji
✅ Check the trend direction
✅ Look at the volume — is it high or low?
✅ Wait for the next confirmation candle
✅ Check RSI or moving averages
✅ Don’t rush — patience wins
Doji Candle Cheat Sheet (Quick Summary)
| Details | |
|---|---|
| What it means | Market indecision, possible reversal |
| When to use it | At trend tops/bottoms, near support/resistance |
| When to avoid it | Low volume, sideways market, no confirmation |
FAQs About Doji Candle
Question: What is a doji candle?
Answer: A doji candle is a candlestick where the open and close prices are almost the same, showing market indecision.
Question: Is it bullish or bearish?
Answer: It depends on where it appears. Context and confirmation matter most.
Question: How often does it appear?
Answer: Doji candles are fairly common, especially in volatile markets. But strong ones with clear signals are less frequent.
Question: Is it profitable?
Answer: Yes, when used with other tools and proper confirmation. Not reliable alone.
Question: Does color matter?
Answer: Not much for a standard doji. The shape and location matter more than the color.
Final Conclusion
The doji candle is one of the most useful tools in technical analysis — but only when you understand it properly. It signals confusion in the market. It warns you that a change might be coming. But it is never a reason to trade blindly.
Always wait for confirmation. Always check the trend. Always use it with other tools like RSI, moving averages, and volume. That’s how smart traders use the doji candlestick pattern to make better decisions — not bigger mistakes.