
What is Forex Trading?
Simple Explanation of the Forex Market
Forex means “foreign exchange.” It is the biggest financial market in the world. People buy and sell currencies here — like US dollars, euros, or British pounds. This market runs 24 hours a day, five days a week.
Think of it like a shop. But instead of buying clothes or food, you are buying money from one country and selling money from another.
How People Make Money in Forex
Traders make money by guessing which currency will go up or down. If you think the euro will become stronger than the dollar, you buy euros. When the price goes up, you sell and make a profit. Simple, right?

What is a Trendline in Forex Trading?
Easy Definition
A trendline in forex trading is a straight line drawn on a price chart. It connects important price points — like peaks or valleys. It shows traders where the price is going.
Why Traders Use Trendlines
Traders love to use of trendlines because they are simple and powerful. They help you see the market direction at a glance. No complicated math needed.
How Trendlines Show Price Direction
When a line goes up, the market is going up. When it goes down, the market is falling. The trendline in forex acts like a guide for the price movement.
Trendlines Explained in a Simple Way
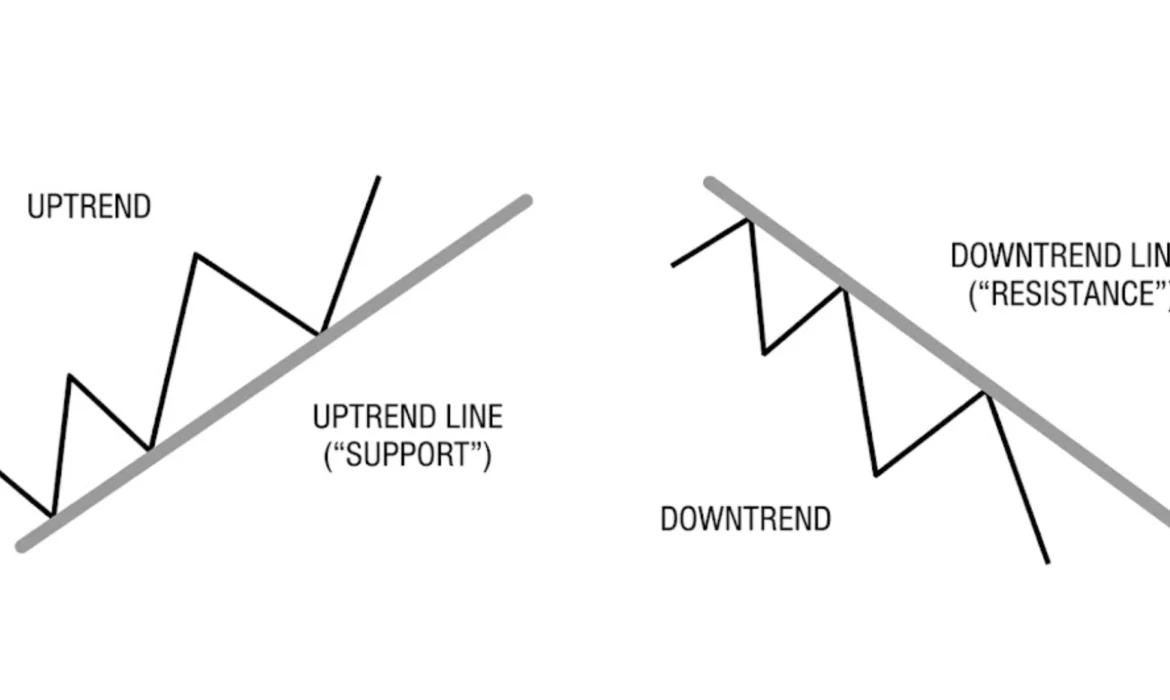
Imagine you are walking up a hill. Each step you take is a little higher than the last. If someone draws a line under your footsteps, that line goes upward. That is an uptrend line.
Now imagine walking down the hill. Each step is lower. The line goes downward. That is a downtrend.
Price in forex moves the same way. It goes up in steps, or down in steps. The trendline connects those steps so you can see the pattern clearly.

Why Trendlines Are Important for Traders
Trendlines are one of the most popular tools in forex technical analysis. Here is why traders cannot live without them.
Helps Find Buying and Selling Points: When price touches the trendline, that is a signal. Traders know it is time to buy or sell.
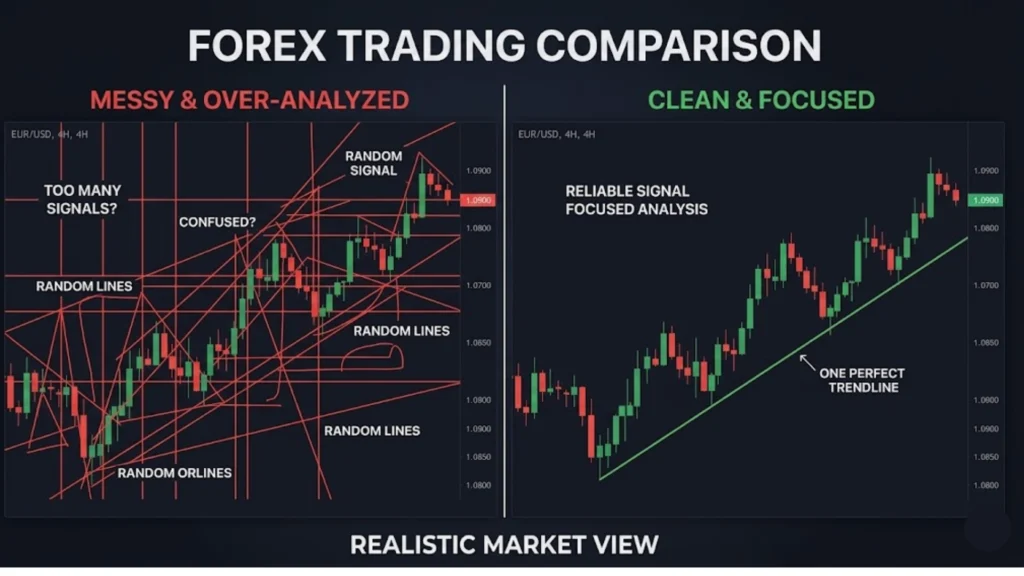
Makes Trading Decisions Easier: Instead of guessing randomly, you follow the line. This keeps your thinking clean and simple.
Reduces Confusion: New traders often feel lost looking at messy charts. A trendline cuts through the noise and shows what really matters — the trend direction.
Types of Trendlines in Forex Trading
Uptrend Line (Bullish Trend)
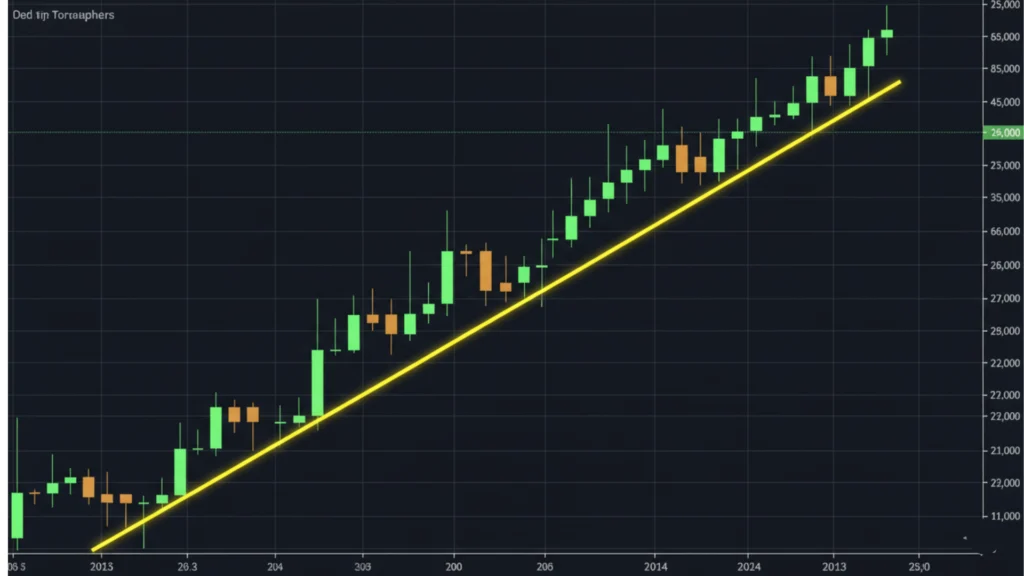
An uptrend line is drawn by connecting higher lows. Each low point is higher than the one before it. This means buyers are strong. Price is going up.
When price comes back down and touches this line, it is often a buying opportunity. This is where smart traders enter the market and ride the trend upward.
Downtrend Line (Bearish Trend)
A downtrend line connects lower highs. Each high is lower than the last. Sellers are in control here. Price is falling.
When price goes up and touches this line, it is often a selling opportunity. This is key to trendline trading forex — you sell at the line and profit as price falls.
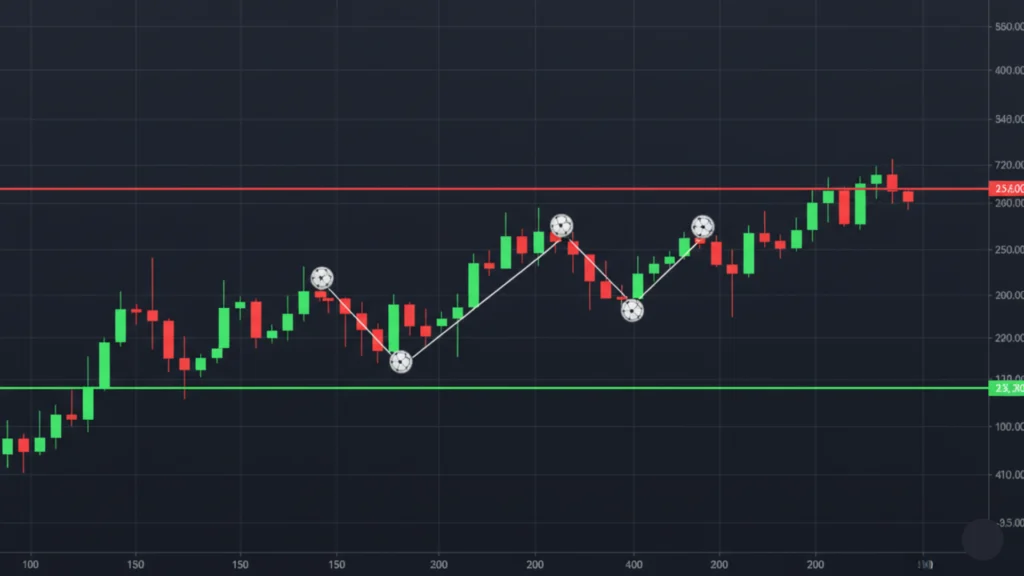
Sideways Trend (Range Market)
Sometimes price does not go up or down clearly. It moves sideways — bouncing between a top level and a bottom level. This is called a range market.
Here, trendline support level acts as the floor and trendline resistance level acts as the ceiling. Traders buy at the bottom and sell at the top.
Understanding Support and Resistance with Trendlines
A trendline can act like a floor. Price keeps bouncing off it from above. This is called trendline support. Buyers step in here and push price back up.
A trendline can also act like a roof. Price keeps hitting it from below and falling back. This is called trendline resistance. Sellers take control here.
When you combine support and resistance trendline analysis, you get a clear map of where price might stop or reverse. This is the heart of forex trendline analysis.
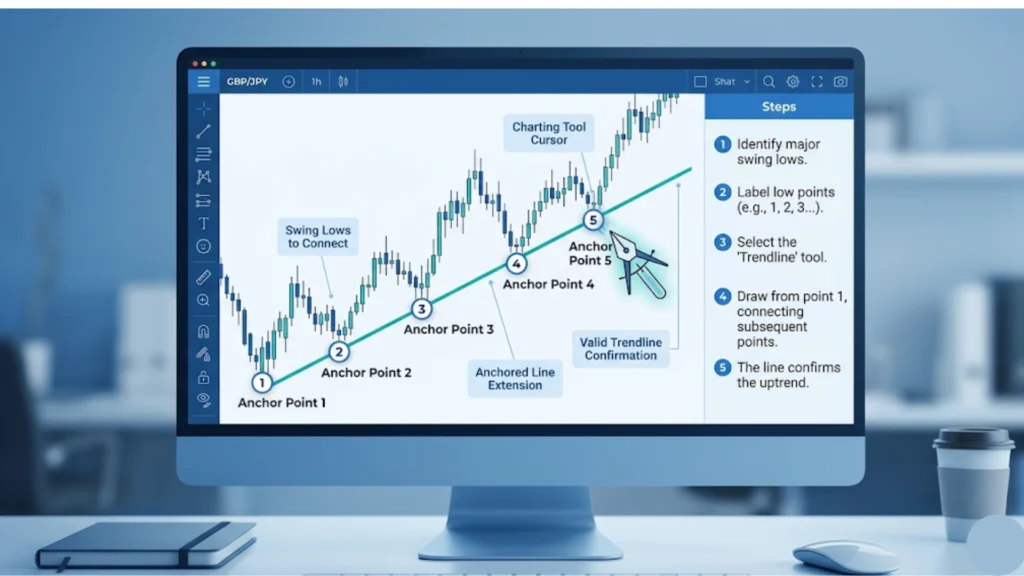
How to Draw Trendlines Step-by-Step
Step 1: Choose the Right Timeframe
Start with a clear timeframe. Beginners should use the daily or 4-hour chart. These are slower and easier to read. Short timeframes have too much noise.
Step 2: Find Highs and Lows
Look for the clear peaks (highs) and valleys (lows) on the chart. These are your anchor points. Mark them clearly.
Step 3: Draw the Trendline
Connect at least two clear lows for an uptrend. Connect at least two clear highs for a downtrend. Use your charting tool and draw the line through these points.
Step 4: Extend the Line
Extend the line forward into the future. This helps you see where price might react next.
Step 5: Check if It Fits Properly
A valid trendline should not cut through too many candles. It should sit neatly along the price. If it looks forced, start over.
How to Identify a Strong Trendline
Not all trendlines are equal. A strong trendline has these qualities:
Multiple Touches: The best trendlines are touched three or more times. More touches mean the line is stronger and more reliable.
Clean Price Reaction: Each time price touches the line, it bounces clearly. This shows traders respect the level.
Proper Angle: A trendline that is too steep or too flat is weak. A medium angle is the healthiest sign of trendline strength in forex.
Not Forced: A good trendline fits naturally. You should not have to twist it to make it fit.
Good vs Bad Trendlines (Common Drawing Mistakes)
Many beginners make mistakes when drawing trendlines. Here are the most common ones:
Forcing Lines: Drawing a line that does not fit the price naturally. If you have to bend the rules to make it work, it probably does not work.
Ignoring Key Points: Skipping important highs or lows. Every anchor point matters when drawing trendlines correctly.
Drawing Too Many Lines: Having fifteen lines on one chart is confusing. Keep it simple. Two or three clean trendlines are better than a messy chart full of lines.
Best Timeframes for Trendline Trading
Short Timeframe (Fast Trades): The 15-minute or 1-hour charts are for day traders. Price moves fast, but signals can be noisy.
Long Timeframe (Safer Trades): The daily or weekly charts are slower. The signals are fewer but much stronger. Great for beginners.
Multi-Timeframe Approach: The smartest traders use multi timeframe trendline analysis. They check the big picture on the daily chart, then zoom in to the 1-hour chart for a precise entry. This gives both safety and accuracy.
Trendline Trading Strategies
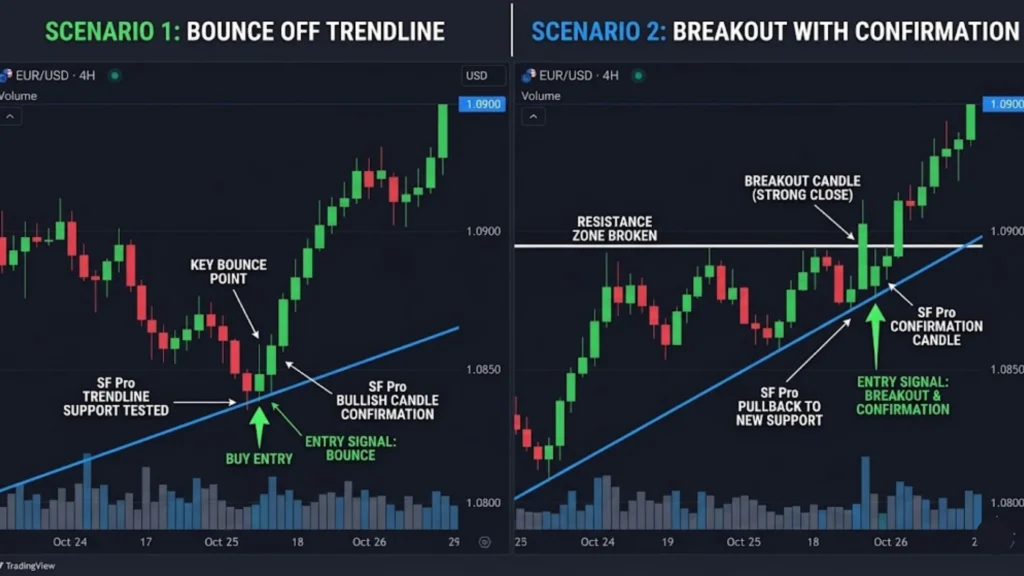
Trendline Bounce Strategy
This is the most popular forex trendline strategy. When price comes back to the trendline and bounces off it, you trade in that direction.
Buy when price bounces off an uptrend line (support). Sell when price bounces off a downtrend line (resistance). This is the core of the trendline bounce strategy.
Trendline Breakout Strategy
Sometimes price breaks through the trendline instead of bouncing. This is called a trendline breakout forex signal.
Do not rush in right away. Wait for trendline breakout confirmation — the price closes clearly beyond the line and retests it. Only then enter the trade.
Trading with the Trend
Always try to trade in the direction of the main trend. If the big trend is up, only look for buying setups. This simple rule saves many trades from going wrong.
What Happens When a Trendline Breaks?
A trendline breakout means price has moved through the line with force. This often signals a trend change or a strong new move.
But be careful. Fake breakouts happen often. Price pokes through the line, tricks traders into entering, then snaps back. Always wait for trendline confirmation signals before trading a breakout.
The best confirmation is a candle that closes beyond the trendline and then retests it as a new support or resistance.
Using Indicators with Trendlines
Moving Average (MA)
A moving average shows the average price over time. When price is above the MA and on a trendline bounce, it confirms a buy setup strongly.
Relative Strength Index (RSI)
RSI tells you if the market is overbought or oversold. When price is at the trendline and RSI shows oversold, it is a strong buy signal.
MACD
MACD shows momentum. A bullish MACD cross near a trendline support is a powerful combined signal.
Bollinger Bands
Bollinger Bands show price volatility. When price touches the trendline and the lower Bollinger Band together, it often signals a sharp reversal.
These indicators support trendlines and help filter weak signals from strong ones.
Risk Management in Trendline Trading
What is Stop Loss: A stop loss is an order that closes your trade automatically if price moves against you. It protects your money.
Where to Place Stop Loss: For a bounce trade, place the stop loss just below the trendline. For a breakout trade, place it just above the old trendline. Trendline stop loss placement should always be logical — not random.
Risk vs Reward: Never risk more than you can afford to lose. A good trade setup should offer at least a 1:2 risk to reward ratio. This means if you risk $50, you should aim to gain $100.
Simple Checklist Before Taking a Trade
Before you click buy or sell, go through this quick checklist:
- Is the trend clear on a higher timeframe?
- Is the trendline valid with at least two to three touches?
- Is price reacting to the trendline right now?
- Is my stop loss placed correctly?
- Is my risk managed properly?
If you answer yes to all five, the trade is worth taking.
Why Trendlines Sometimes Fail
Trendlines are great, but they are not perfect. Here is why they sometimes fail:
Market News: Big news events — like interest rate decisions — can blow through any trendline in seconds.
Fake Signals: Sometimes price touches the trendline but does not bounce. Weak trendlines give false signals more often.
Weak Trendlines: A trendline with only two touches is fragile. Respect it less than one with five touches.
Common Mistakes Beginners Make
- Entering Too Early: Waiting for a confirmed candle close is important. Jumping in too fast leads to losses.
- Ignoring Higher Timeframe: Always check the big picture first.
- No Stop Loss: Trading without a stop loss is like driving without a seatbelt. Always protect yourself.
- Overtrading: Taking too many trades is a classic mistake. Quality over quantity always wins.
Trading Psychology in Trendline Trading
Patience: The best setups take time to form. Wait for price to come to your trendline, not the other way around.
Avoiding Fear and Greed: Fear makes you exit too early. Greed makes you stay too long. Stick to your plan and let the trade play out.
Following Rules: Have a trendline trading system and follow it every single time. Consistency is what separates winning traders from losing ones.
Tools and Platforms for Drawing Trendlines
TradingView: The most popular online charting tool. Clean, easy, and free. Perfect for drawing trendlines in forex.
MT4 / MT5: The most widely used forex trading platforms. Both have built-in trendline tools that are simple to use.
Charting Tools: Most broker platforms also offer basic charting. Always practice on one platform and get comfortable with its tools.
How to Practice Trendline Trading Safely
Demo Accounts: Open a demo account with any broker. Trade with fake money first. This is the safest way to learn.
Backtesting: Look at old charts and practice drawing trendlines on past data. See how price reacted. This builds your eye for good setups.
Practice Before Real Trading: Never risk real money until you are consistently profitable on demo. This step saves beginners from painful losses.
Advantages and Disadvantages of Trendline Trading
Advantages
- Simple to Use: No complex formulas. Just draw a line and follow it.
- Works in All Markets: Forex, stocks, crypto — trendlines work everywhere.
- Great for Beginners: It is one of the best simple forex trading strategies for those just starting out.
Disadvantages
- Can Give False Signals: Not every trendline bounce leads to a big move.
- Needs Practice: Drawing trendlines correctly takes time. Everyone makes mistakes at first.
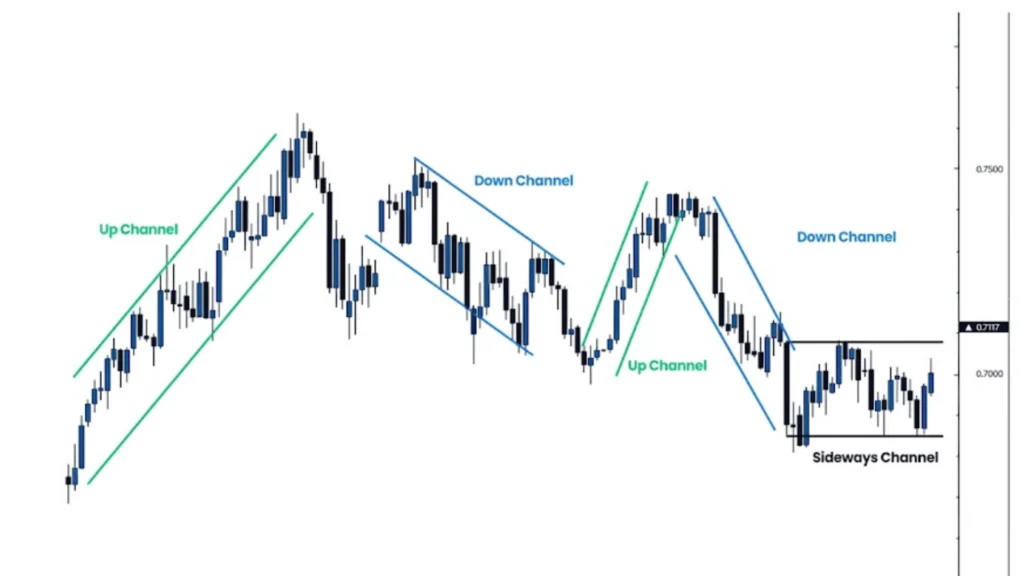
Trendlines vs Channels (Simple Comparison)
A channel is two parallel trendlines — one above and one below price. The upper line is resistance and the lower line is support.
A single trendline shows direction. A channel shows the full range of price movement. Channels are like trendlines with boundaries. They are more advanced but built on the same idea.
Trendlines in Forex vs Stocks
Similarities: In both markets, trendlines work the same way. You connect highs and lows, watch for bounces or breakouts, and manage your risk.
Key Differences: Forex markets run 24 hours. Stock markets have fixed hours. This means forex charts can have gaps less often. Also, forex price action trendline trading is more influenced by global economic events compared to individual company news in stocks.
Frequently Asked Questions (FAQs)
Question: Can Beginners Use Trendlines?
Answer: Yes, absolutely. Trendlines are one of the best tools for forex trading for beginners. They are visual, simple, and effective.
Question: How Many Touches Make a Valid Trendline?
Answer: At least two touches are needed to draw a trendline. But three or more touches make it much stronger and more reliable.
Question: Are Trendlines Always Accurate?
Answer: No. No tool is 100% accurate in trading. Trendlines are helpful guides, not guarantees. Always use risk management alongside them.
Question: Which Timeframe is Best?
Answer: The daily and 4-hour charts are the most reliable for trendline trading. Beginners should start there.
Can I Trade Only with Trendlines?
Answer: Yes, many traders do. A clean forex trendline strategy with good risk management can be a complete trading system on its own.
Final Summary: How to Use Trendlines Successfully
Trendline in forex trading is a powerful and simple tool. It helps you see the market direction, find the best entry and exit points, and manage your trades with confidence.
Here is a quick recap of the key lessons:
Draw trendlines on clear highs and lows. Look for at least three touches. Trade the bounce or the breakout — but always wait for confirmation. Use a stop loss on every trade. Practice on a demo account first.
The biggest secret? Keep it simple. The best trendline trading tips always come back to one idea — follow the trend, respect the line, and protect your money.
Start small, be patient, and trust the process. Trendlines have helped millions of traders succeed — and they can help you too.